The 2026 Autonomous Vehicles Impact Report: How have AV Fleets Disrupted Human Rideshare
The 2026 AV Impact Report analyzes how autonomous vehicle deployments are affecting human rideshare drivers across major U.S. cities—revealing faster declines in trips per hour, localized earnings pressure, and the pricing hurdles AVs must clear to scale.
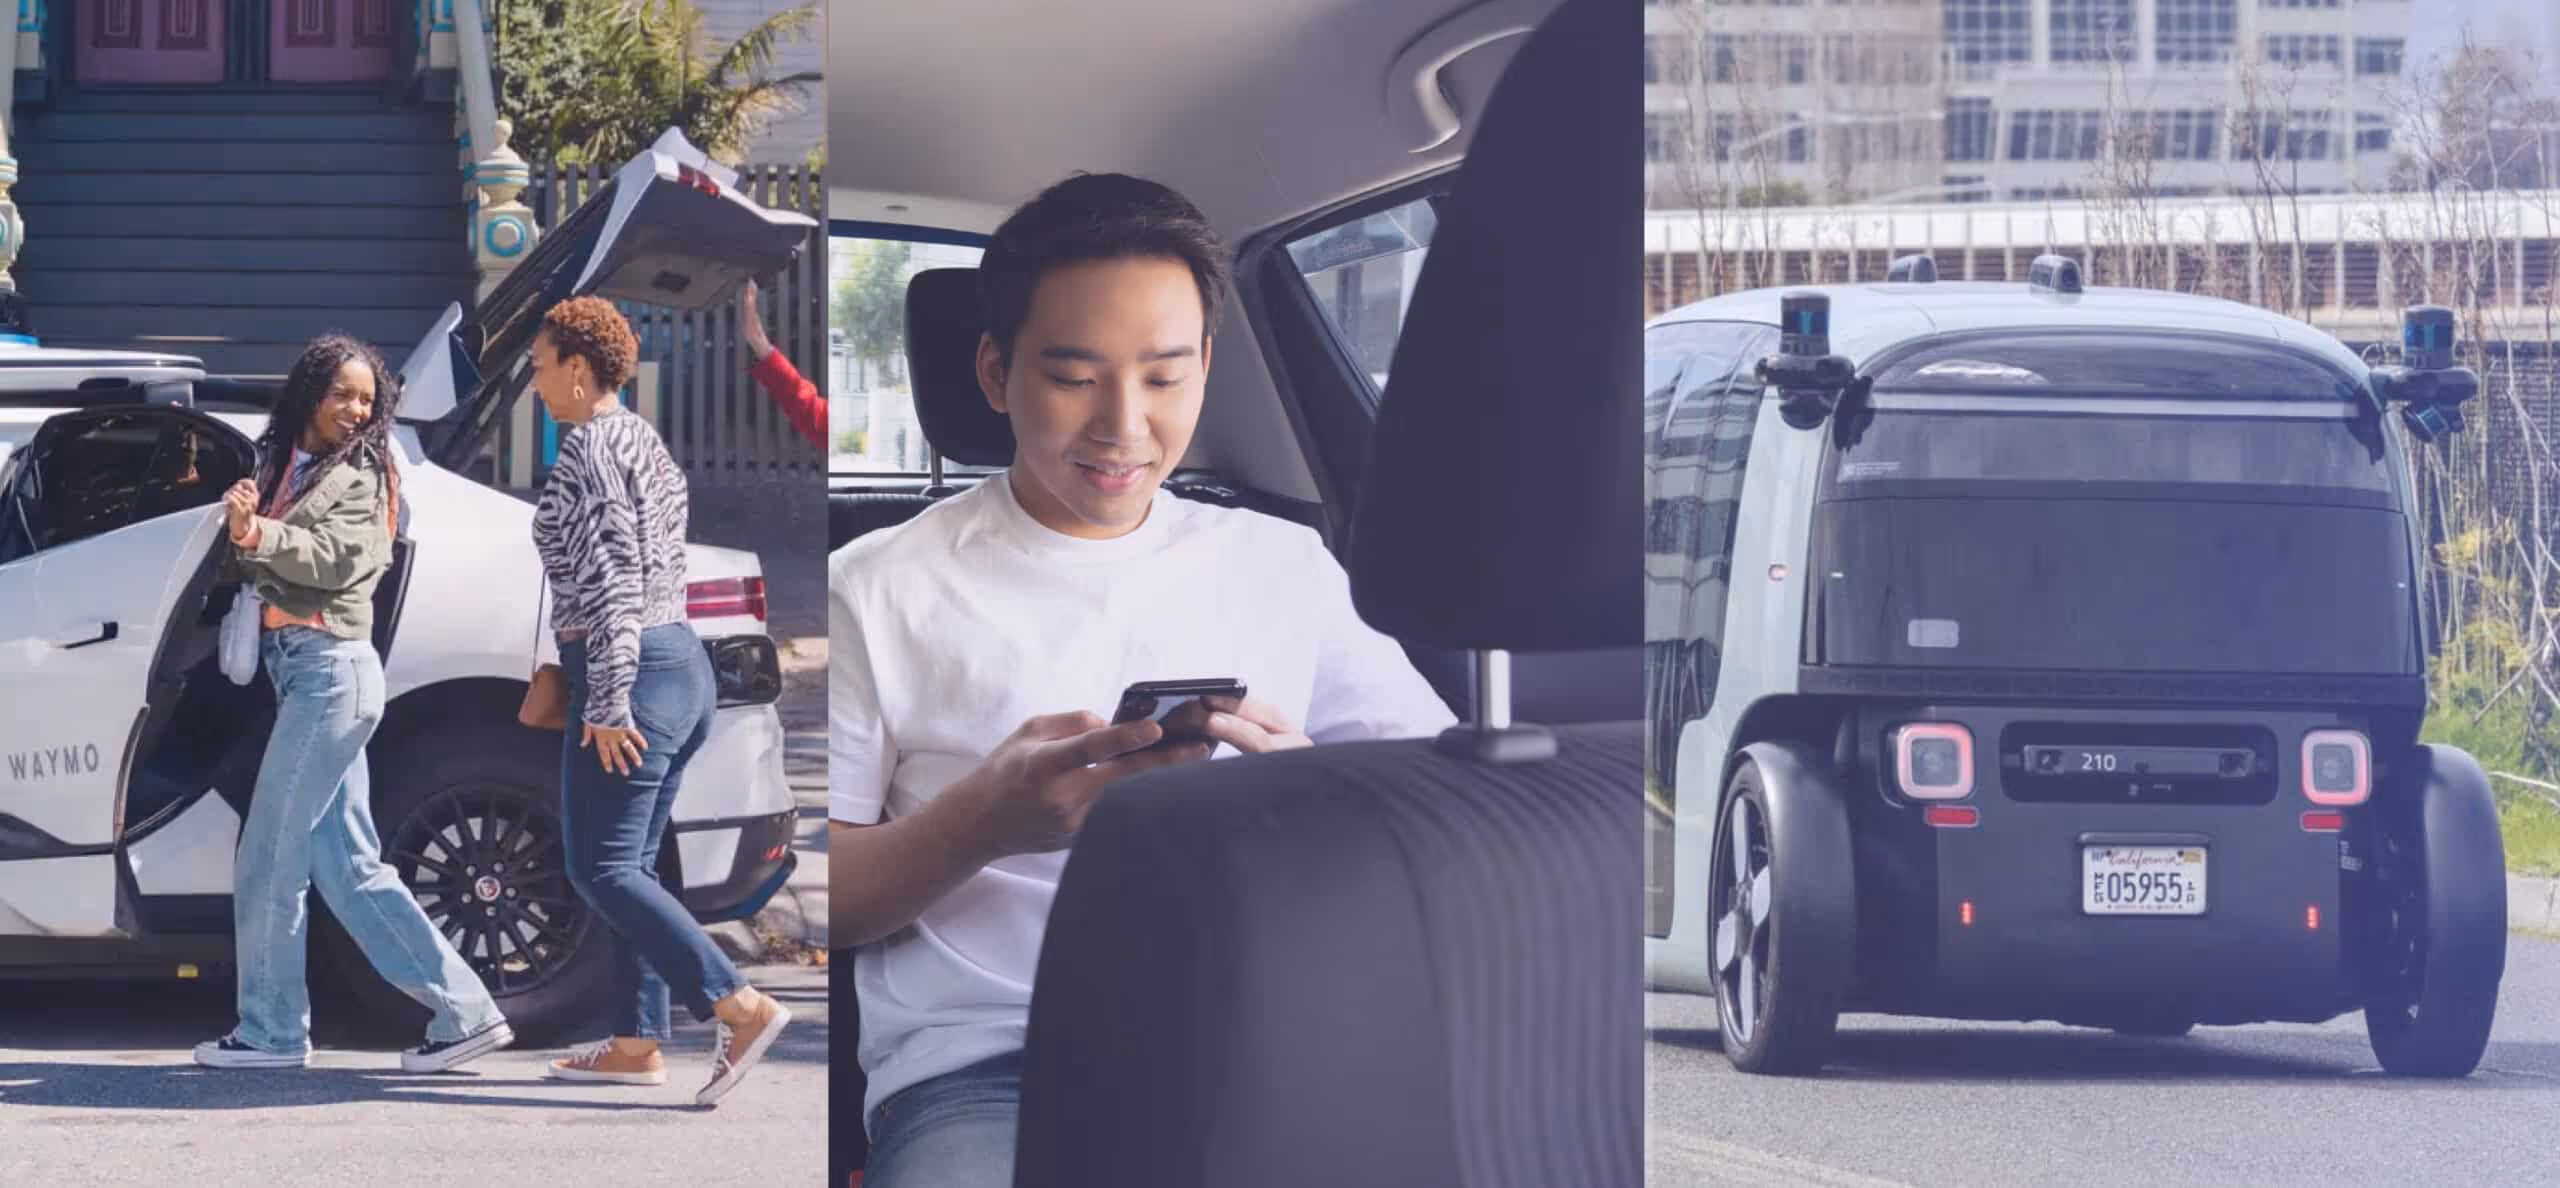


Autonomous vehicles are no longer theoretical—they’re operating in select U.S. cities.
As AV fleets expand alongside human-driven rideshare, early signals are emerging in driver productivity, earnings, and platform dynamics. This report compares AV-active markets to national benchmarks to understand how rideshare economics are shifting—and what those changes may signal for the future of autonomy.
Drivers are spending less time on active trips in AV cities
In Q4 2025, drivers in AV-active markets saw a sharper drop in productivity. Trips per hour declined 5.3% in AV cities vs. 2.6% nationwide—nearly 2× faster.

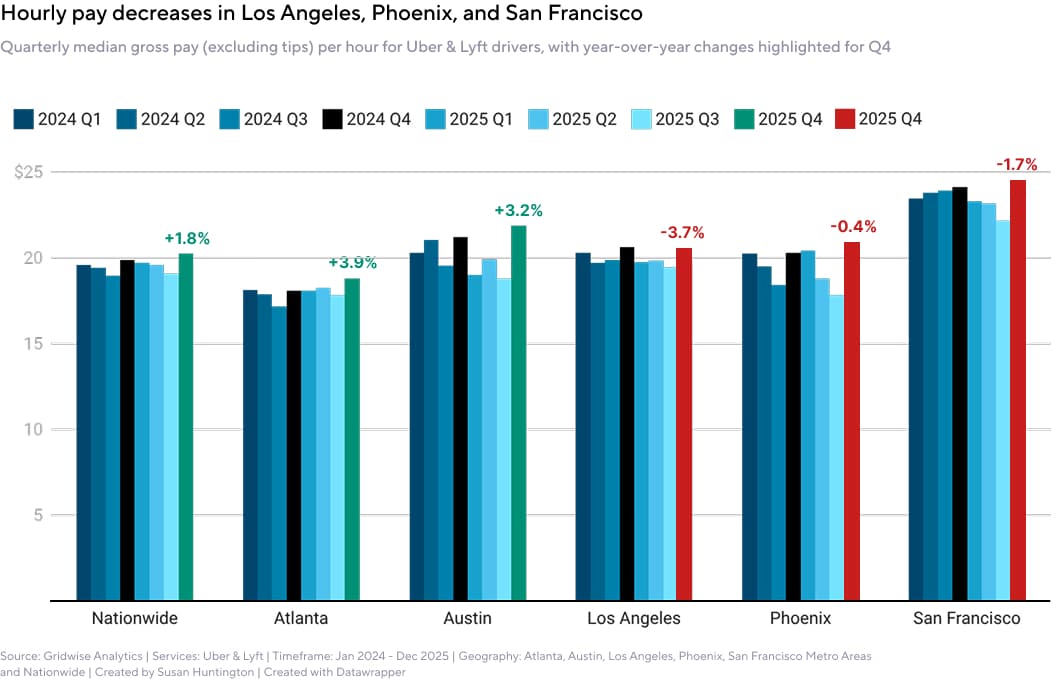
Three AV cities saw earnings decline—while nationwide increased
Nationwide, hourly gross pay rose +1.8% YoY in Q4. But in key AV markets, earnings fell: Los Angeles (-3.7%), Phoenix (-0.4%), and San Francisco (-1.7%).
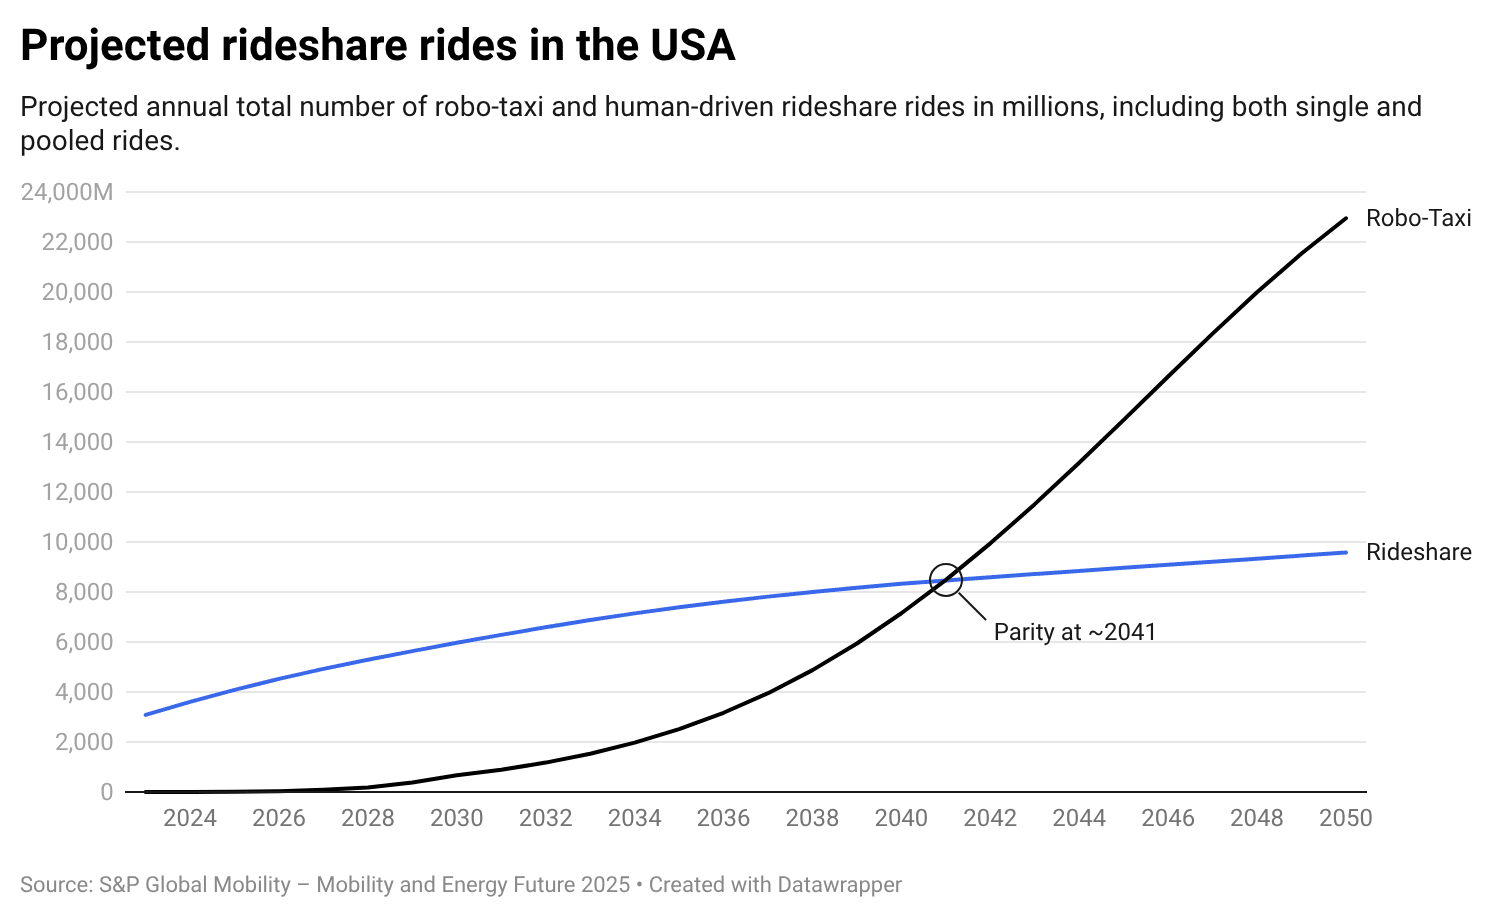
The $1 barrier that would make or break AVs
S&P Global projects AVs need pricing near $1 per mile to scale sustainably. Even then, AV rides and miles aren’t expected to reach parity with human rideshare until around 2040–2041.
Want to know where AVs are reshaping the market first?
Download the full report for city-by-city data and insights on where AV rollout is beginning to reshape rideshare economics — and where traditional rideshare markets remain resilient.
Explore a full year of performance trends in AV Active cities.
In the full report, you’ll uncover:
- Year-over-year pay shifts in AV-active markets
- Incentive trends and driver utilization data
- Trips-per-hour metrics across key cities
- A full summary table of platform-level impacts