Build and optimize your AV fleet operations with actionable insights from Gridwise
Leverage gig mobility data to assess market demand for AV fleets, build robust economic models, and forecast operational needs for your fleet's deployment.


The most comprehensive and representative gig mobility dataset in the U.S.
Every month, we ingest and process millions of anonymized location, trip, and earnings records from ride-hail and delivery drivers that work on platforms like Uber, Lyft, DoorDash, Grubhub, Instacart, Amazon Flex, and countless others.
Gridwise Analytics’ driver panel is highly representative of market dynamics when compared with quarterly reported gig platform metrics.
0
Merchants
0
KPIs
0
Tickers
0
Gig Platforms
0
MAPE
0
KPI YoY Accuracy for Top Tickers
Gridwise Analytics transforms workforce data into actionable insights that help mobility firms make better financial and operational decisions.
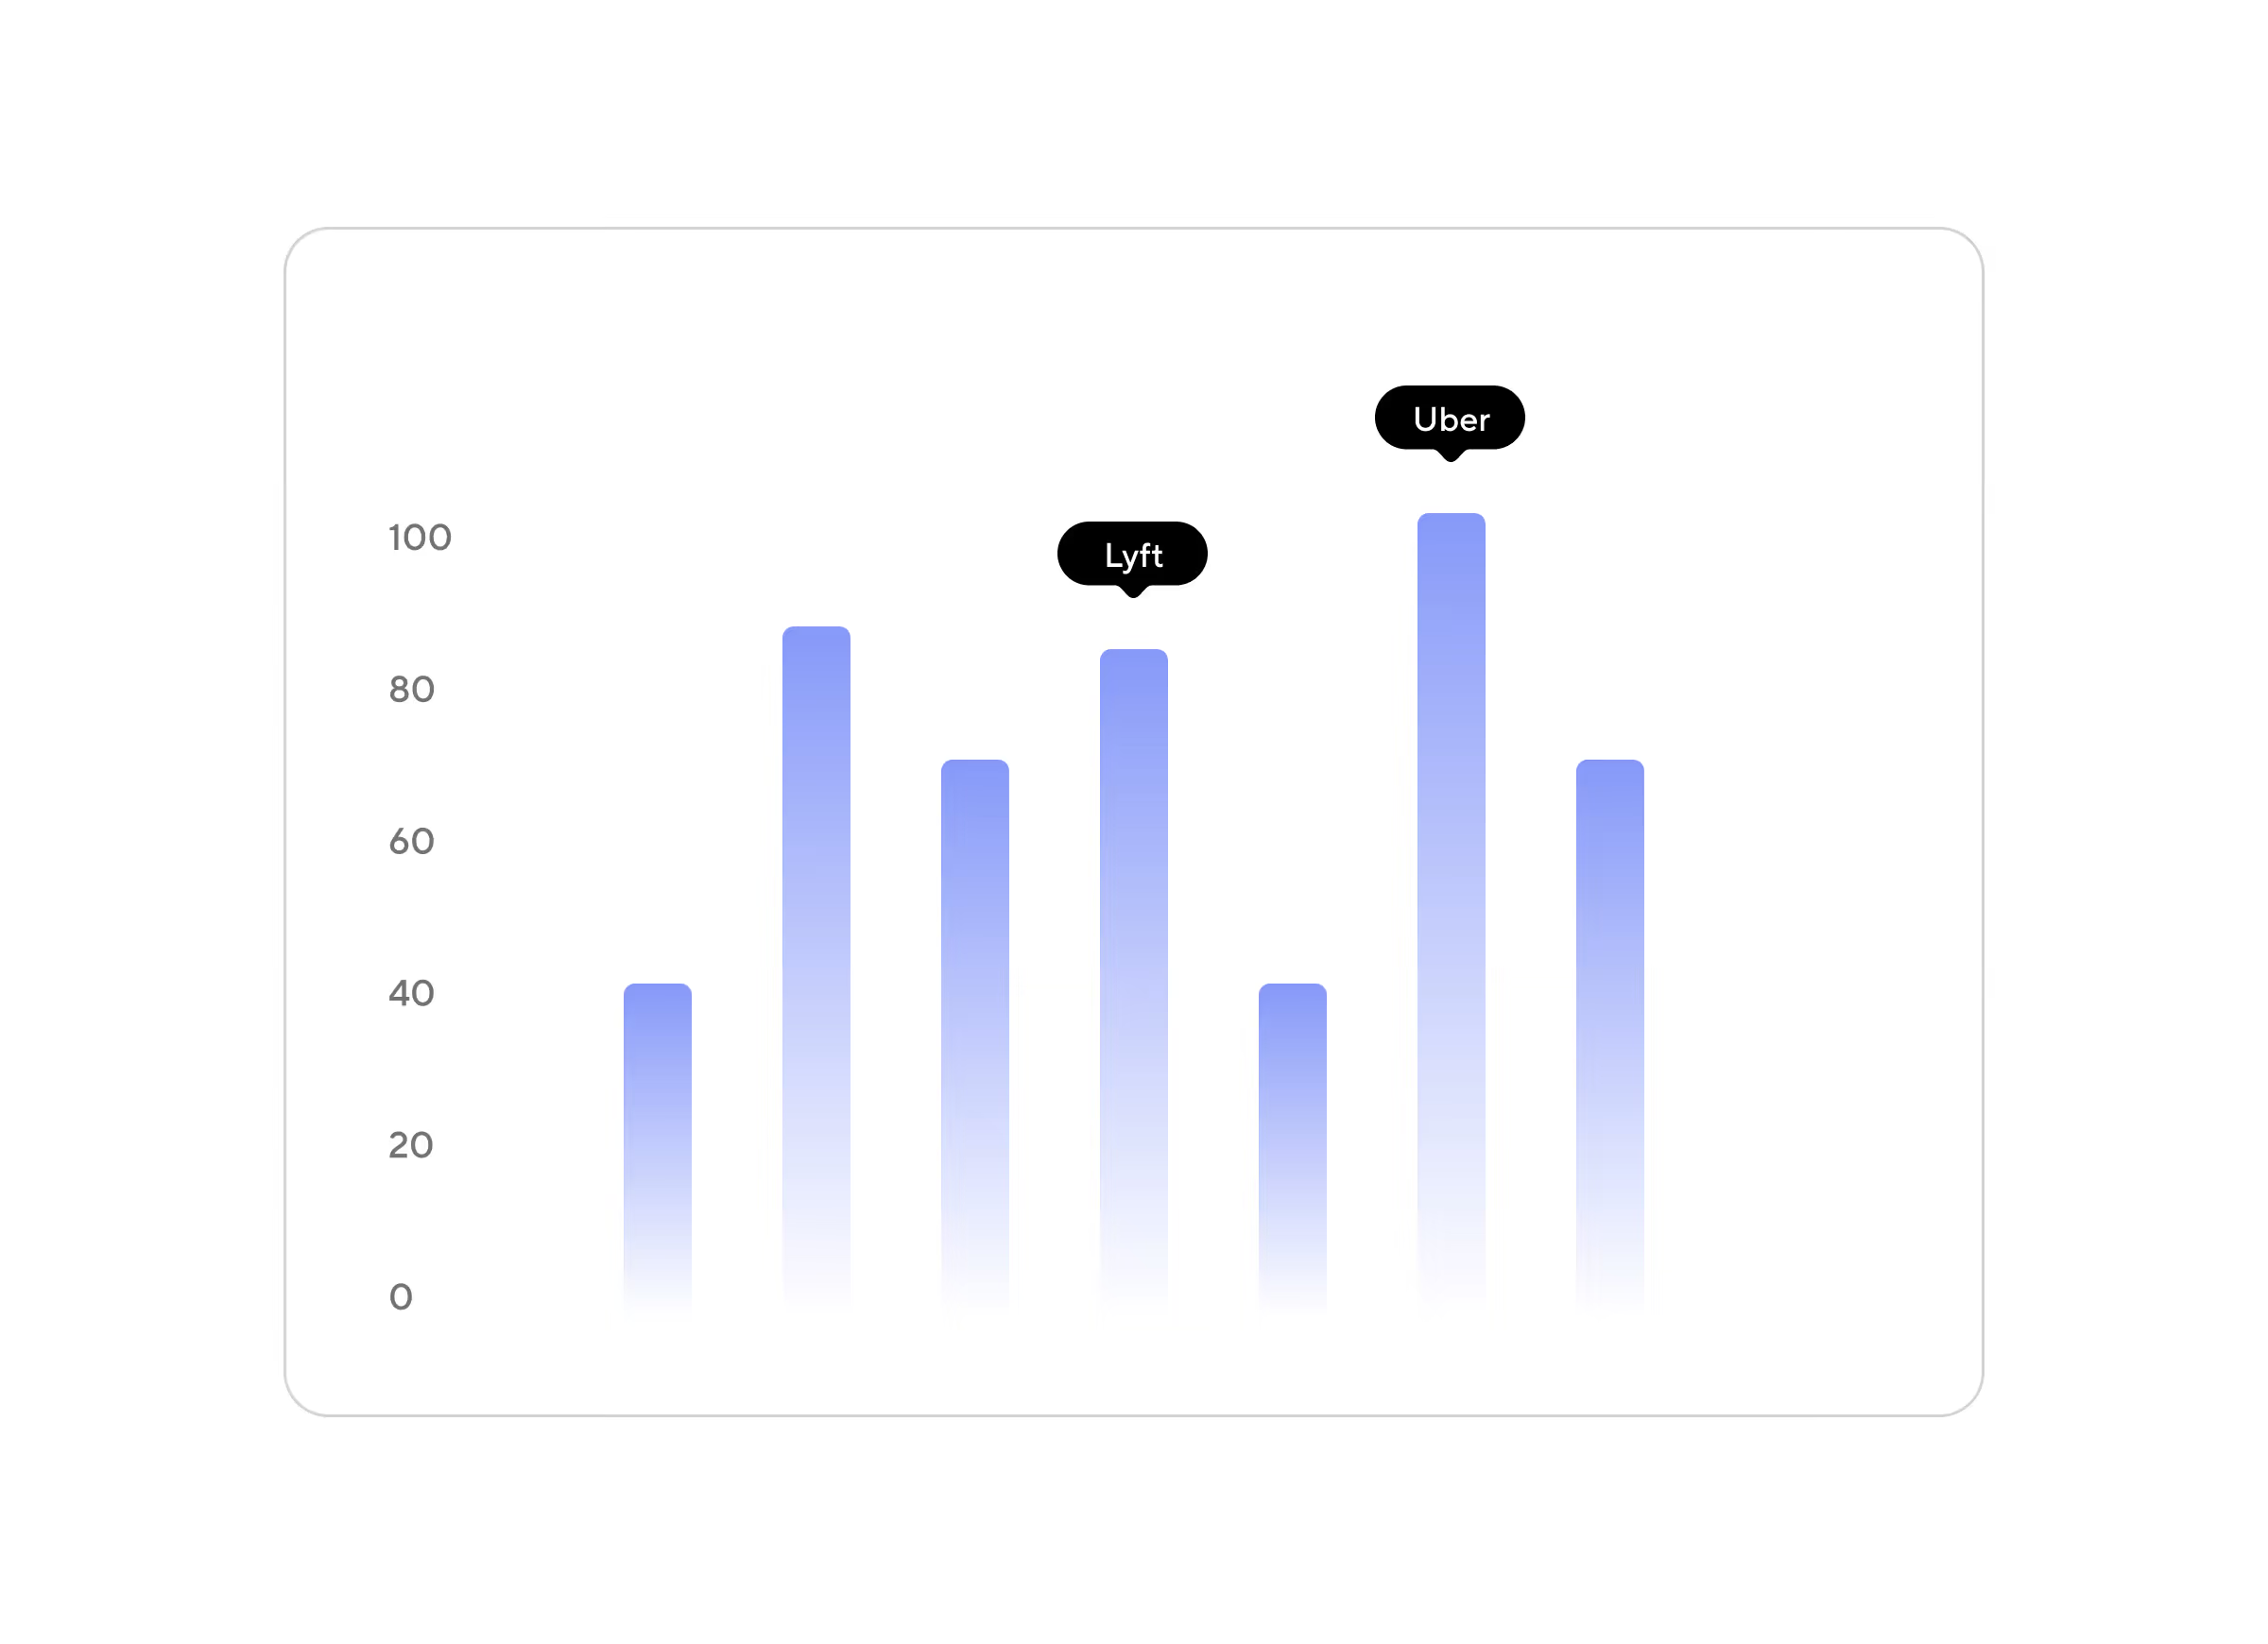
Understand demand for your fleet
Leverage real-world data from every major gig platform to identify high-demand markets and pinpoint specific areas within them for your autonomous vehicle services to ensure maximum fleet utilization.

Build robust economic models
Develop financial models based on real-world data to more accurately forecast revenues, optimize pricing strategies, and assess the viability of AV fleets within specific markets.
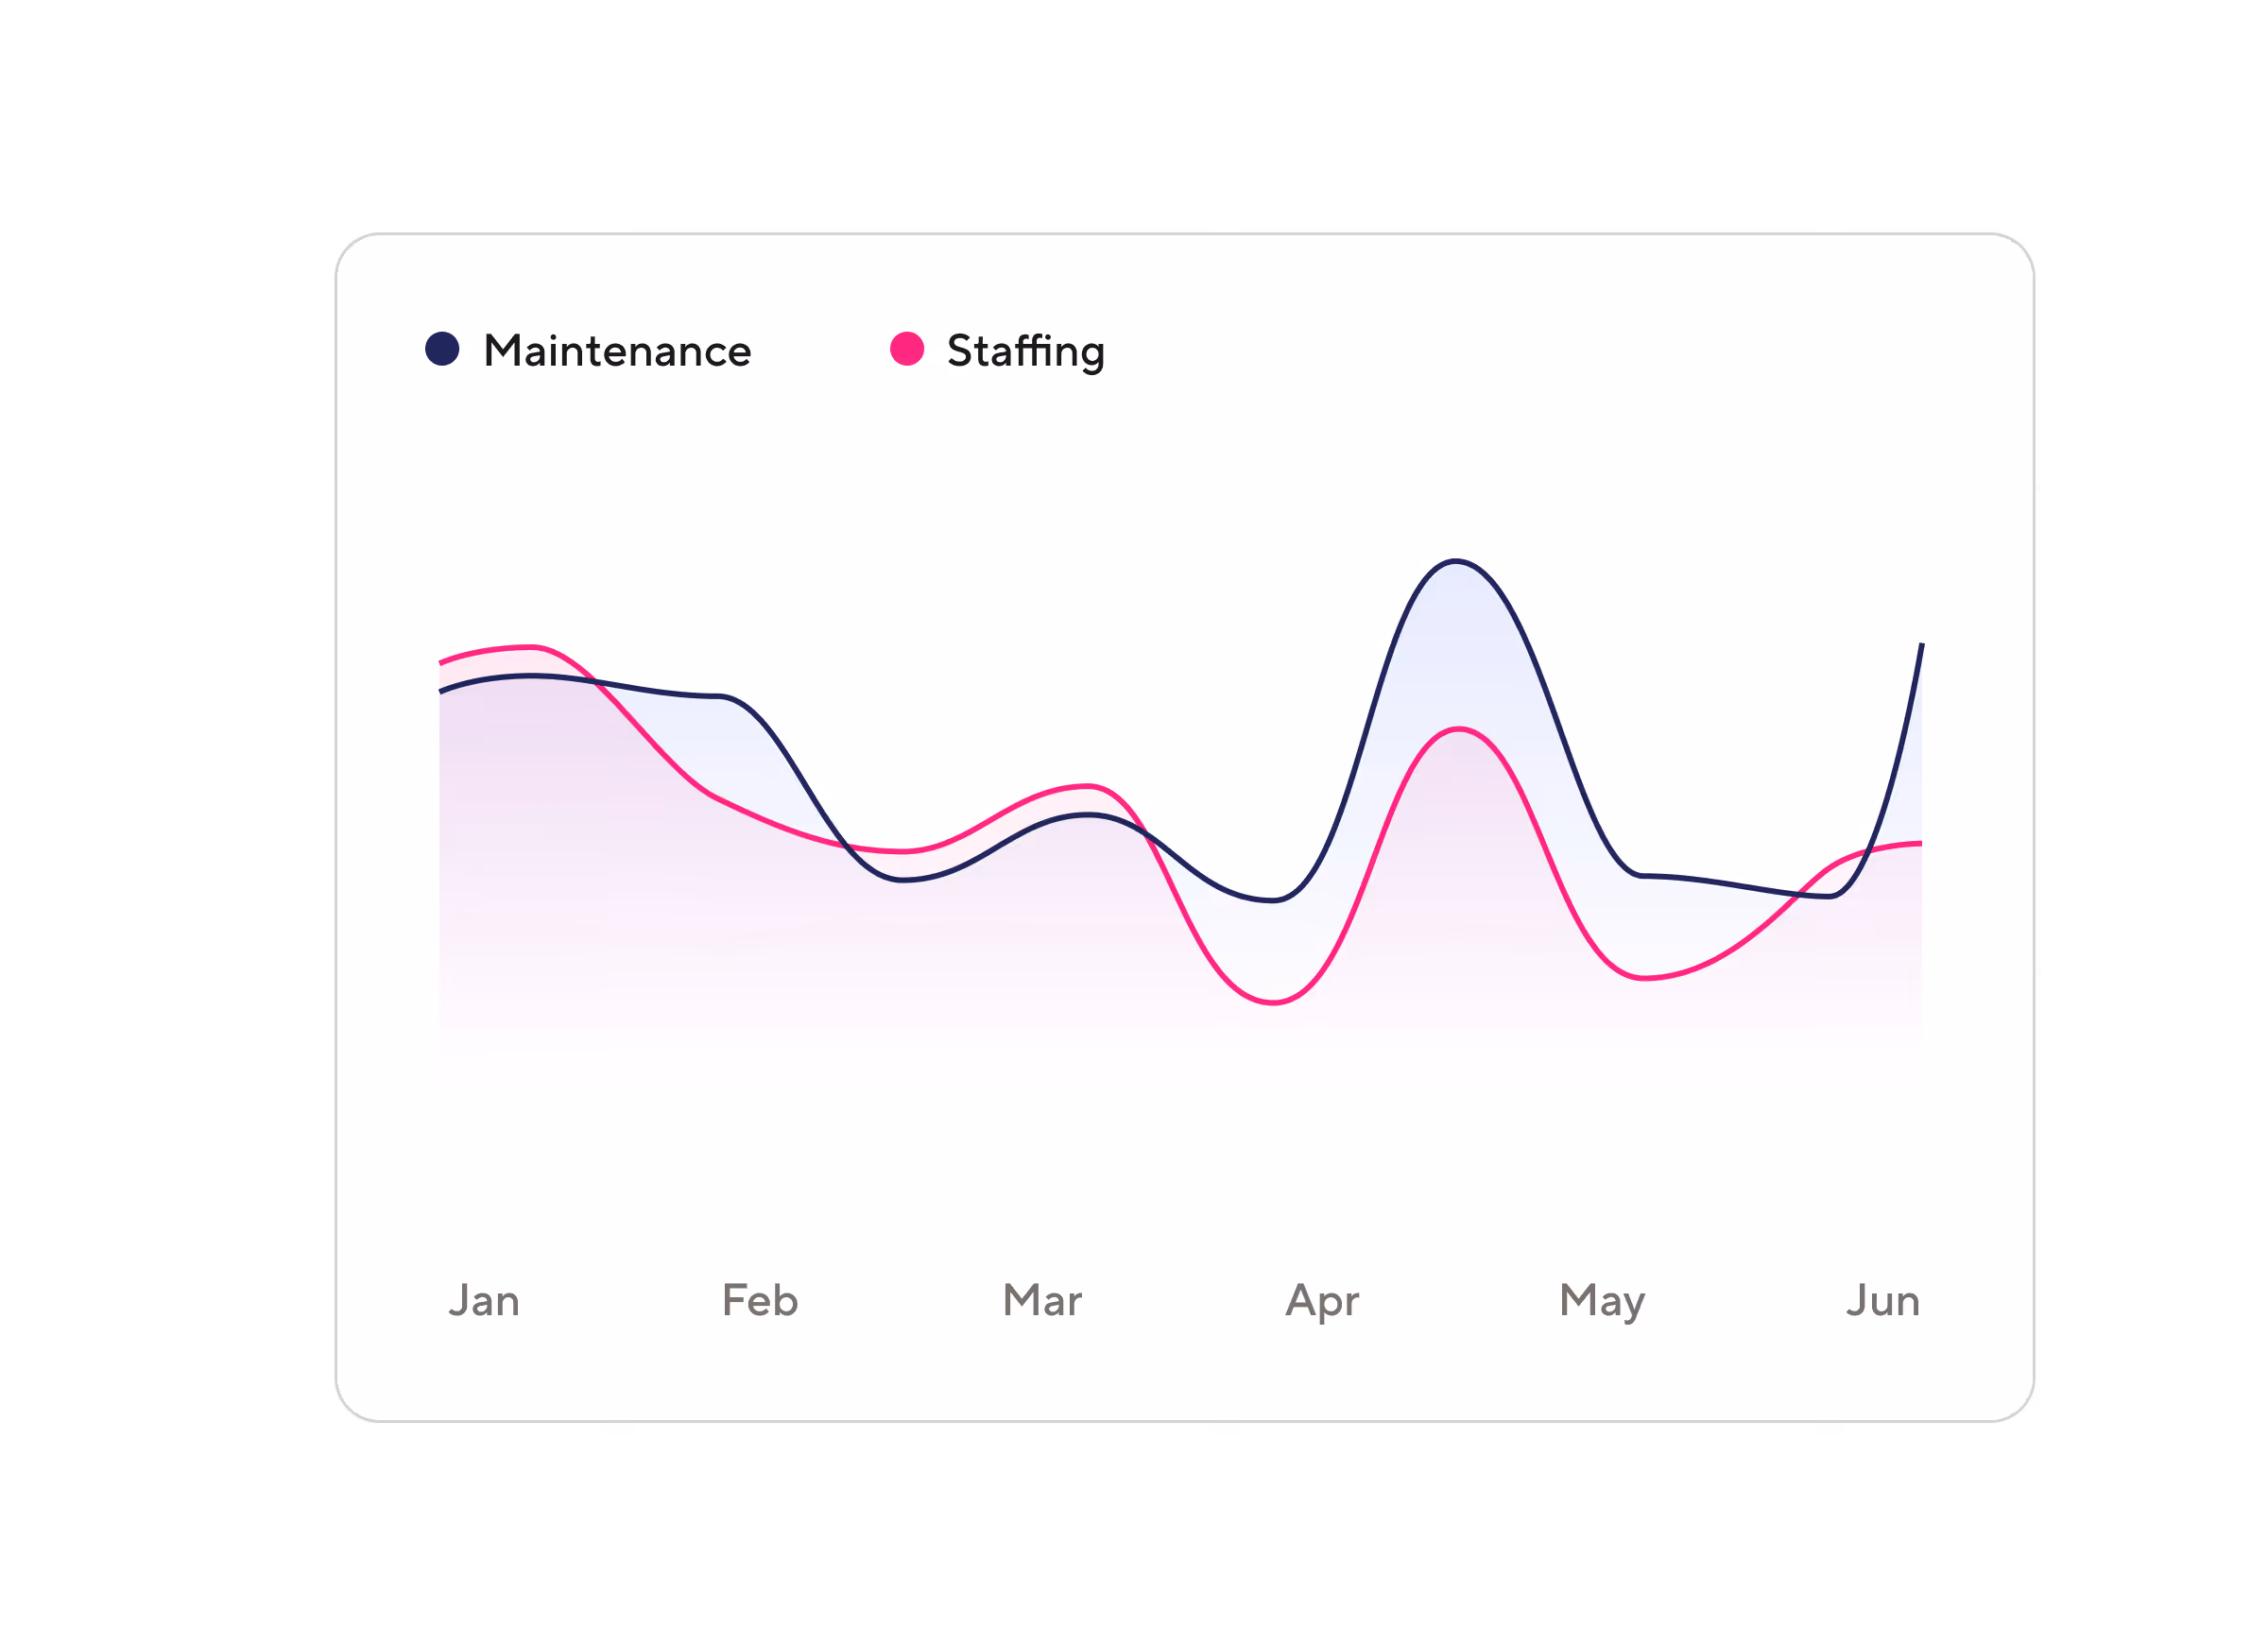
Forecast operational needs
Leverage gig mobility data to forecast vehicle, maintenance, staffing and logistical needs for your AV Fleet to ensure efficient resource allocation.

The data you need to master operational performance
Leverage over 100 metrics on work, wages, trips, and deliveries to make smarter operational decisions.
Supply and demand insights & patterns
Know where and when ride-hail and delivery services are being used most.
Worker earnings data
See how much drivers make per hour, per mile, and per service.
Unit economics
Understand the unit economics of each trip based on driver earnings, incentives, and passenger tips
Fleet efficiency
Understand how efficiently gig mobility services are leveraging their fleets.
Market share
Identify the most and least used gig mobility services by region.
Vehicle trends and popularity
Find out what vehicles are driven most by gig drivers
Customer demand
Find out how much customers are paying per trip, delivery, and job.
Platform profitability
Leverage insights into customer demand and worker wages to understand platform take rate.
Merchant performance
Identify to performance of individual merchants on each gig platform.
Data-driven reports


Get started with analytics
Let’s talk about how Gridwise Analytics can fit into your operations and goals.