Here's what we cover:
DoorDash’s Rise: A Look at Recent Delivery Performance
DoorDash’s transformation from a Silicon Valley start-up to a dominant force in the gig economy has reshaped the food and retail delivery landscape. Once a niche service, it has expanded its reach and secured dominance across QSR, grocery, and retail sectors. For QSRs and retailers, this evolution presents unparalleled opportunities and new challenges.
[elementor-template id="20891"]
DoorDash’s Market Leadership: Maintaining Its Edge
As of late 2024, DoorDash maintains a 67% market share in food delivery, yet competitors—notably Uber Eats—have gradually gained ground. Over the past two years, Uber Eats has expanded its footprint, capturing a larger share of the delivery market, while DoorDash’s overall percentage has slightly declined.
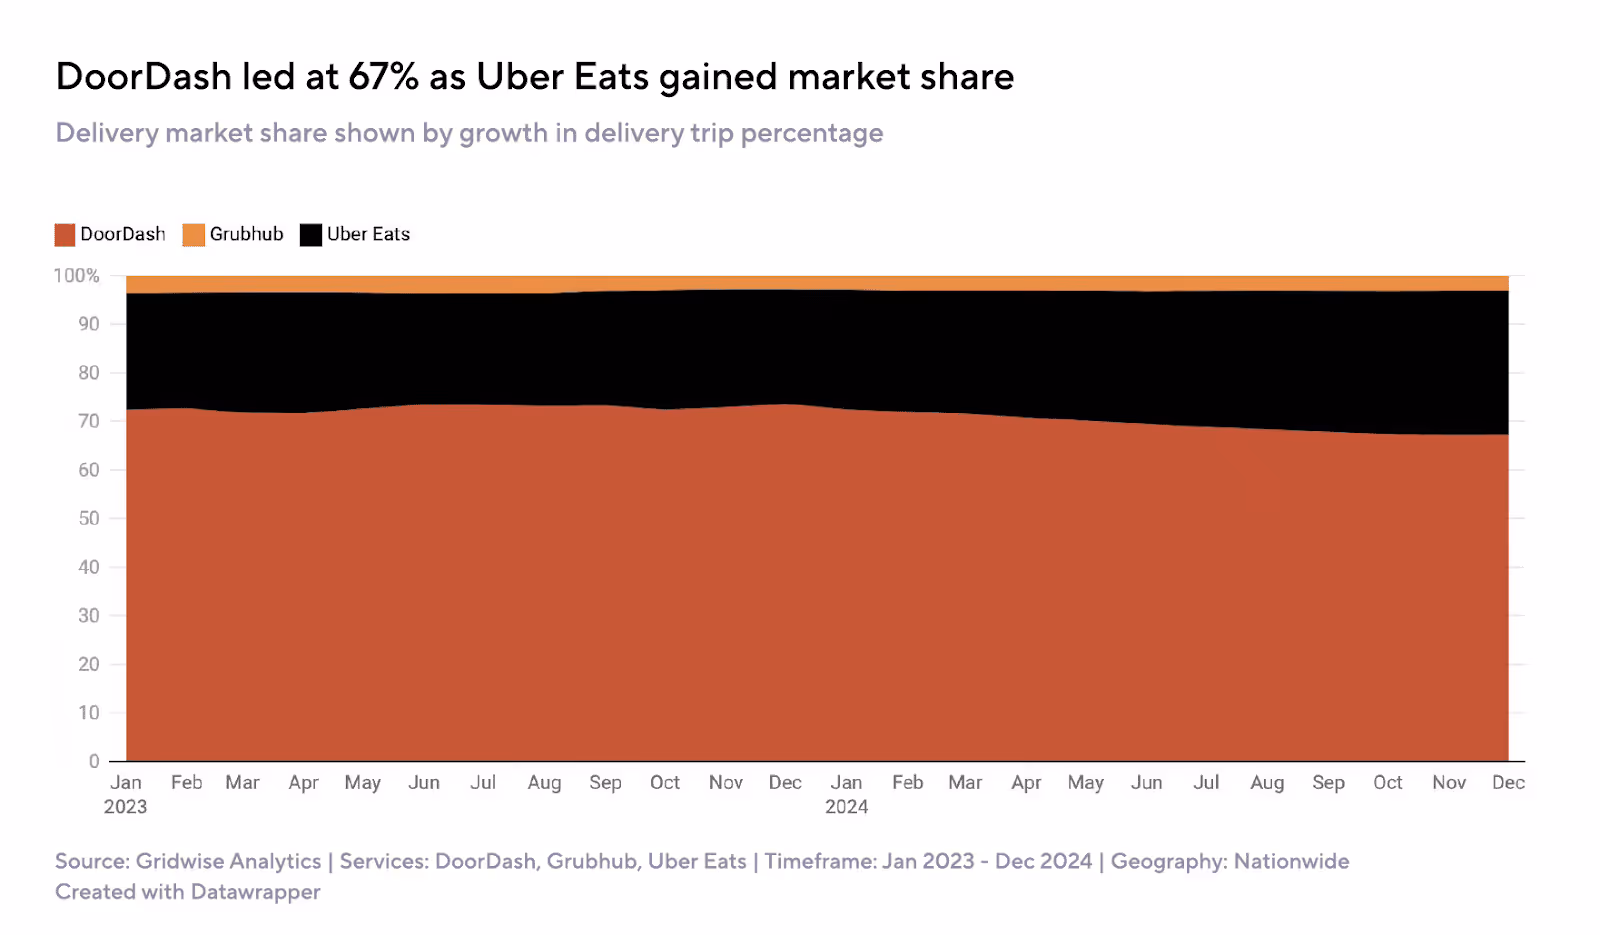
This shifting market share underscores an evolving delivery landscape where QSRs and retailers must take a strategic approach. While DoorDash remains dominant, businesses should consider a multi-platform strategy, leveraging Uber Eats’ growing presence to optimize reach. Additionally, Grubhub continues to hold a smaller but steady market share, highlighting the importance of diversified partnerships.
Understanding these shifts is crucial for QSRs to negotiate fees, optimize promotional spending, and ensure platform visibility. For retailers, the growing competition in third-party logistics presents new opportunities to engage customers increasingly using these apps for more than just food delivery.
DoorDash’s Expanding Market Share in Food, Grocery, and Retail
New data highlights how food-focused delivery services, including DoorDash, increasingly diversify into grocery and retail deliveries.
As of 2024, food delivery remains the dominant segment for services like DoorDash, Uber Eats, and Grubhub, but grocery and retail have gained significant ground. For example, while DoorDash and Uber Eats handled 86% of food deliveries in 2023, that share has declined to 82% in 2024 as more grocery and retail deliveries enter the mix. Instacart remains almost entirely grocery-focused, while Spark’s deliveries are overwhelmingly retail.

This trend signals a growing consumer appetite for multi-category delivery services for QSRs, increasing competitive pressures to offer a seamless, omnichannel experience.
The Retail Explosion: Macy’s and the DoorDash Surge
One of the most striking delivery trends of 2024 has been the meteoric rise of retail deliveries through DoorDash. From January to December 2024, Macy’s delivery volume via DoorDash skyrocketed by 4,525%, signaling an aggressive expansion of DoorDash’s retail footprint.

The surge in retail deliveries marks a pivotal shift in how consumers use third-party platforms, expanding beyond food into lifestyle and retail purchases. For retailers, this presents an opportunity to capitalize on DoorDash’s vast logistics network and customer reach. However, for QSRs, it introduces new competitive dynamics, as increased retail volume could impact fulfillment speed and prioritization for restaurant partners.
At the same time, retailers face a more complex operating environment within DoorDash’s app ecosystem. To remain competitive, they must optimize visibility, leverage in-app promotional tools, and ensure their fulfillment capabilities align with platform expectations.
Driver Loyalty and the Multi-Apping Challenge
One of the defining factors of DoorDash’s continued dominance is its ability to retain gig drivers. DoorDash has the lowest percentage of multi-apping drivers, meaning more of its workforce remains exclusive to its platform compared to Uber Eats, Grubhub, and Instacart.

This is an essential operational consideration for QSRs. Drivers who stick to a single platform tend to provide consistent service levels, reducing order delays and improving fulfillment reliability. A stable driver base for retailers translates to improved logistics efficiency and predictable last-mile fulfillment.
Comparing Driver Compensation and Pay Breakdown
An analysis of pay structure and earnings highlights key differences across major delivery and rideshare platforms. For DoorDash, the data reflects a moderate balance between base pay, tips, and minimal bonus incentives—positioning it between gig categories like rideshare and parcel delivery, which are far more reliant on fixed base pay.
DoorDash Drivers Earned More in 2024 While Working More Hours
DoorDash drivers earned an average of $240 per week in 2024, up 4.8% year-over-year. This growth came alongside a 5.2% increase in average weekly work hours—from 17.2 to 18.1 hours. Pay per hour fell slightly to $12.23, while pay per mile dropped to $0.92, down from $1.01. These shifts reflect higher total engagement on the platform, possibly driven by increased demand or improved driver activation.

DoorDash Relies Heavily on Tips to Drive Earnings
Tips accounted for 53.4% of total driver compensation on food delivery platforms—by far the highest of any gig category. Food delivery drivers on average received only 44.3% of their earnings from base pay, and 2.2% from bonuses. This compensation model emphasizes variability and highlights the importance of customer tipping behavior in sustaining earnings.

These compensation trends underscore key operational considerations for platforms. Tip-reliant models like DoorDash’s introduce variability in driver earnings, which may influence retention and engagement. Meanwhile, base-heavy models in parcel and rideshare offer greater earning predictability, albeit with less customer-facing variability.
Site Selection Insights Powered by Delivery Demand Data
ZIP-level delivery trip volume data offers valuable signals for delivery platforms to refine network operations, prioritize partnerships, and deepen geographic penetration. By analyzing neighborhood-level demand patterns, stakeholders can make smarter and more strategic decisions.
High Coffee Delivery Volumes Signal Platform Opportunity in Residential Zones
O’Hare/Dunning (60634) leads Starbucks delivery trip share at 5.3%, followed by Irving Park/Avondale (60618) at 4.7% and Uptown/Andersonville (60640) at 3.9%. These residential areas represent strong, sustained coffee demand—ideal for optimizing driver coverage, prioritizing peak-hour incentives, and identifying areas with under-onboarded café partners.

Healthy Food Demand Clusters Around Affluent Urban Hubs
River North/West Town (60654) accounts for 6.9% of healthy food delivery volume, with Lincoln Park/Old Town (60614) at 6.8% and Magnificent Mile/Streeterville (60611) at 6.1%. Delivery platforms can use this concentration to inform merchant recruitment, cross-promotions with health-focused brands, and hyperlocal marketing strategies targeting wellness-conscious consumers.

Fast Food Thrives in Youth-Dense, Social Neighborhoods
Lake View/Northalsted (60657) leads fast food delivery trip volume at 4.5%, with Wrigleyville/Buena Park (60613) at 3.9% and Uptown/Andersonville (60640) at 3.6%. These data points can guide platforms in load-balancing driver dispatch during evening hours, surfacing high-velocity fast food partners, and calibrating pricing algorithms in high-demand zones.

Delivery trip volume isn’t just a reflection of consumer behavior—it’s a strategic asset for platform operations and growth. As geographic preferences become clearer, platforms that use this intelligence effectively can deliver faster, increase order frequency, and deepen local engagement.
For QSR partners, these insights can help guide where to scale delivery operations or test new store formats.
For retail brands, trip density data can inform which neighborhoods are primed for rapid fulfillment infrastructure or exclusive promotions.
The Road Ahead: Adapting to an Evolving On-Demand Landscape
DoorDash’s expansion into grocery and retail reflects a broader industry shift toward multi-category convenience. For delivery platforms, this evolution creates new opportunities to deepen market penetration, optimize fulfillment networks, and refine geographic strategy using trip-level data.
Driver compensation trends—such as DoorDash’s high reliance on tips and modest base pay—underscore the need for platforms to balance engagement incentives with reliability. As more hours are worked and driver supply increases, platforms must continue optimizing earnings structures that sustain service levels without eroding margin.
At the same time, ZIP-level delivery volume data is becoming a critical strategic asset. Platforms can use these insights to guide driver coverage, surface merchant gaps, and enable QSR and retail partners to scale more effectively in the neighborhoods where demand is highest.
Ultimately, as consumers expect faster, more flexible service across food, retail, and beyond, delivery platforms must continue evolving from transaction enablers to localized infrastructure engines—powering the next chapter of on-demand commerce.
Share article:
Related posts

How Much Do Roadie Drivers Make? (Data from 500k+ Drivers)
How much do Roadie drivers actually make in 2026? Roadie is not your typical gig delivery app. Owned by UPS, it specializes in same-day and last-mile delivery for major retail partners like Home Depot, Walmart, Best Buy, and even Delta Air Lines. You are delivering packages, furniture, and appliances -- not burritos. That means the pay structure, tip expectations, and earning potential are fundamentally different from food delivery platforms. Based on data from 6,725 Roadie drivers tracked through Gridwise in 2025, we can show you exactly what Roadie pays -- the real numbers, not guesses. Whether you are considering signing up or benchmarking your current Roadie income, this guide covers hourly pay, per-delivery earnings, the truth about tips, and how top earners nearly double the median rate.
Quick Answer -- How Much Do Roadie Drivers Make Per Hour?
Roadie drivers earn a median of $12.70 per hour in total trip pay, based on data from 6,725 Roadie drivers tracked through Gridwise in 2025. The average is slightly higher at $13.84 per hour, pulled up by top earners on long-distance and big & bulky gigs.
That puts Roadie on the lower end of delivery platforms. For context, DoorDash driver earnings come in at $11.26 per hour median, while Amazon Flex driver earnings vary widely by delivery block. Roadie edges out DoorDash, but the gap is modest.
The more interesting story is the variance. The top 25% of Roadie drivers earn $16.31 or more per hour, and the top 10% clear $20.49 per hour -- nearly double the median. That gap is driven almost entirely by gig selection: drivers who consistently land big & bulky deliveries and long-distance gigs earn significantly more than those taking short-haul small-item runs.
Roadie Driver Earnings Breakdown (2025 Data from 6,725 Drivers)
Here is the complete picture of what Roadie drivers earn, broken down by every metric that matters. All figures are based on 2025 data from Gridwise's network of 6,725 tracked Roadie drivers. Note: gross pay per hour and gross pay per task data was unavailable, so all earnings figures below reflect total trip pay (base pay + tips).
Hourly Earnings
Total trip pay per work hour:
- Average: $13.84/hr
- Median: $12.70/hr
- Top 25% (p75): $16.31/hr
- Top 10% (p90): $20.49/hr
The $7.79 gap between the median and p90 is one of the widest spreads of any delivery platform, percentage-wise. That tells you Roadie rewards strategic gig selection more than most apps -- picking the right deliveries matters enormously.
Per-Task Earnings
How much Roadie drivers earn per completed delivery:
- Average: $11.65 per task
- Median: $9.60 per task
- Top 25% (p75): $13.92 per task
- Top 10% (p90): $20.27 per task
At $9.60 median per delivery, Roadie pays 29% more per individual task than DoorDash ($7.44 per delivery). The per-task number looks respectable -- the challenge is throughput. Roadie drivers complete fewer tasks per hour than food delivery drivers (more on that below), which is why the hourly rate does not scale up as dramatically.
Tip Earnings
Tips per task:
- Average: $0.37 per task
- Median: $0.01 per task
- Top 25% (p75): $0.22 per task
- Top 10% (p90): $0.74 per task
Tips per work hour:
- Average: $0.35/hr
- Median: $0.02/hr
- Top 25% (p75): $0.29/hr
- Top 10% (p90): $0.83/hr
Those numbers are not a typo. The median Roadie driver earns one cent in tips per delivery. We will break down why in detail below, but the short version: Roadie delivers packages and retail items, not food. Customers ordering a drill from Home Depot or a TV from Best Buy do not tip the delivery driver the way they tip a DoorDash Dasher bringing dinner. Roadie is effectively a base-pay-only platform. Plan your earnings expectations accordingly.
Tasks Per Work Hour
- Average: 1.51 tasks per hour
- Median: 1.21 tasks per hour
- Top 25% (p75): 1.69 tasks per hour
- Top 10% (p90): 2.60 tasks per hour
At 1.21 tasks per hour median, Roadie's throughput is lower than DoorDash (1.51 deliveries per hour). This makes sense: Roadie deliveries often involve larger items that take longer to load, transport, and deliver. A big & bulky furniture delivery from Home Depot is a very different task than dropping off a bag of Chipotle. The lower throughput is partially offset by higher per-task pay ($9.60 vs $7.44), but it does compress the hourly rate.
Pay Per Mile
Gross pay per point-to-point mile:
- Average: $2.10 per mile
- Median: $1.58 per mile
- Top 25% (p75): $2.36 per mile
- Top 10% (p90): $3.65 per mile
At $1.58 per mile median, Roadie drivers earn well above the IRS standard mileage deduction rate of $0.70 per mile in 2026. The per-mile rate is reasonable and reflects a mix of shorter local deliveries and longer-distance gigs. Drivers who focus on shorter-distance deliveries will see higher per-mile rates, while long-distance gigs pay more in total but compress the per-mile figure.
How Roadie Pay Works
Roadie operates differently from food delivery apps like DoorDash or Uber Eats. It is a same-day delivery platform owned by UPS that connects drivers with retail partners who need items delivered to customers. Understanding how the pay structure works helps you decide which gigs to accept and how to maximize your time.
The UPS Connection
UPS acquired Roadie in 2021, and the platform now functions as UPS's crowdsourced same-day delivery arm. This means many Roadie gigs originate from major retail brands that partner with UPS for last-mile delivery. You are essentially filling a role that a UPS driver would handle -- but as an independent contractor using your own vehicle.
Per-Gig Pricing
Roadie pays a flat rate per gig based on several factors:
- Distance: Longer deliveries pay more. A cross-town furniture delivery pays significantly more than a 2-mile package drop-off.
- Item size and weight: Roadie categorizes gigs by size -- small, medium, large, and big & bulky. Larger items command higher payouts.
- Time sensitivity: Same-day and express deliveries may carry higher rates than standard delivery windows.
- Demand: When delivery volume exceeds available drivers in an area, payout rates can increase.
Gig Categories
Roadie offers four main gig types, each with different pay and vehicle requirements:
- Small items: Envelopes, small boxes, documents. Fit in any vehicle. Typically the lowest-paying gigs ($5 to $10 range).
- Medium items: Standard packages, electronics boxes, auto parts. Fit in a sedan trunk. Mid-range pay ($8 to $15).
- Large items: Bigger boxes, multiple packages, bulkier retail orders. May require an SUV or van. Higher pay ($12 to $25).
- Big & bulky: Furniture, appliances, grills, large home improvement items. Requires a truck, SUV, or van with significant cargo space. Highest pay ($20 to $50+). This is where the real money is on Roadie.
Retail Partners
Roadie's gig volume comes primarily from major retail brands:
- Home Depot: One of the largest Roadie partners. Delivers lumber, tools, appliances, and home improvement items.
- Walmart: Package and retail deliveries (distinct from Walmart's own Spark delivery service).
- Best Buy: Electronics, TVs, and appliance deliveries.
- Advance Auto Parts: Auto parts and accessories deliveries.
- Delta Air Lines: Roadie delivers delayed or lost luggage to passengers -- a unique gig type that pays well for what are typically local deliveries.
Payment Schedule
Roadie pays drivers via direct deposit, typically processing payments weekly. The app shows your estimated payout before you accept a gig, so you always know what you will earn before committing to a delivery.
Roadie Tips -- The Honest Truth
This is the section no other Roadie article will give you with this level of transparency. The data is clear: tips on Roadie are essentially nonexistent.
The median Roadie driver earns $0.01 per delivery in tips. Not $1. Not $0.10. One penny. The average is $0.37, pulled up by the rare occasion when a customer tips on a delivery, but the median tells the real story: the vast majority of Roadie deliveries come with zero tip.
Why Roadie Tips Are So Low
The explanation is simple: Roadie is a package and retail delivery platform, not a food delivery service. The tipping dynamic is completely different.
- Customers are not ordering food: When someone orders dinner on DoorDash, tipping the delivery driver feels natural -- it is an extension of restaurant tipping culture. When someone orders a drill bit from Home Depot, they do not think to tip the person who drops it off. The social norm simply does not exist for package delivery.
- Many orders are placed through retail apps: Customers often do not know Roadie is handling the delivery. They placed an order on HomeDepot.com or BestBuy.com and selected same-day delivery. The Roadie driver is invisible to them -- they think it is a regular delivery service.
- The tipping prompt may not be prominent: Unlike food delivery apps where tipping is a central part of the checkout flow, retail partner integrations may not surface the tipping option as prominently.
- Corporate accounts: Some Roadie deliveries are fulfilled through corporate retail accounts where tipping is not an option at all.
What This Means for Your Earnings
Roadie is a base-pay-only platform. Your earnings are determined entirely by which gigs you accept and how efficiently you complete them. Unlike DoorDash, where tips make up nearly half of hourly income, or Uber Eats, where tips are a significant supplement, Roadie drivers should calculate their expected income using base pay alone. If a gig pays $12 for the delivery, you will earn $12 -- do not factor in a tip.
The upside of this: your earnings are predictable. You know exactly what each gig pays before you accept it, and there is no waiting to see if a customer adjusts the tip after delivery. What you see is what you get.
Best Times to Deliver with Roadie (Delivery Earnings Heatmap)
When you deliver matters. The following earnings data is based on all delivery platforms combined (not Roadie-specific), showing the average gross earnings per hour by day and time block. It gives you a reliable picture of when delivery demand -- and pay -- peaks.
Peak Earning Windows
The highest-paying delivery windows based on Gridwise data:
- Sunday 6-8pm: $18.28/hr average -- the single best delivery window of the week
- Saturday 6-8pm: $17.48/hr average
- Friday 6-8pm: $17.42/hr average
- Sunday 3-5pm: $17.27/hr average
- Sunday 6-8am: $17.30/hr average
The dinner rush (6-8pm) consistently pays the most across every day of the week. Weekends dominate the top of the list, with Sunday being the single best day for delivery earnings.
Lowest Earning Windows
- Tuesday 12-2pm: $14.17/hr average -- the lowest-paying window
- Tuesday 9-11am: $14.25/hr average
- Wednesday 9-11am: $14.64/hr average
- Thursday 9-11am: $14.43/hr average
Midday on weekdays is consistently the lowest-paying window. If you are choosing your Roadie hours, skip the Tuesday through Thursday late-morning lull.
Roadie-Specific Timing Considerations
While the heatmap above covers all delivery platforms, Roadie has some unique timing patterns worth noting:
- Retail store hours drive gig availability: Unlike food delivery apps that run late into the night, Roadie gigs are tied to retail partner store hours. Home Depot closes at 9pm or 10pm in most locations. Best Buy closes at 8pm or 9pm. Plan your Roadie shifts around when retail stores are open and actively dispatching deliveries.
- Weekend big & bulky surge: Homeowners tend to buy large items (furniture, appliances, grills) on weekends. Saturday and Sunday see the highest volume of big & bulky gigs -- the highest-paying category on Roadie. If you have a truck or SUV, weekends are your prime earning window.
- Holiday season is peak Roadie: Black Friday through Christmas is the highest-volume period for Roadie. Retail partners are shipping massive quantities of items for same-day delivery, and driver demand surges. Expect higher gig availability and potentially higher payouts during November and December.
- Home improvement season (spring/summer): Home Depot deliveries spike during spring and summer as homeowners tackle renovation and landscaping projects. Large-item deliveries of lumber, power tools, and outdoor furniture increase significantly.
How to Earn More on Roadie
The difference between a median Roadie driver ($12.70/hr) and a top 10% earner ($20.49/hr) is $7.79 per hour -- or $312 per 40-hour week. Here is what separates top Roadie earners from average ones.
Chase Big & Bulky Gigs
This is the single most important strategy for maximizing Roadie income. Big & bulky deliveries -- furniture, appliances, grills, large home improvement items -- pay $20 to $50+ per gig. The p90 per-task figure of $20.27 is more than double the median ($9.60), and big & bulky gigs are the primary driver of that gap.
- You need the right vehicle: A truck, SUV, or van with significant cargo space is required. Sedan drivers cannot accept most big & bulky gigs. If you have access to a pickup truck, you are unlocking Roadie's highest-paying category.
- Home Depot is your best friend: Home Depot is one of Roadie's largest partners and generates a high volume of big & bulky deliveries. Position yourself near Home Depot locations during peak hours.
- The math works even at lower throughput: A single big & bulky delivery at $35 that takes 45 minutes yields an effective hourly rate of $46.67. Even accounting for load time and drive time, these gigs dramatically outpay small-item runs.
Prioritize Long-Distance Gigs
Roadie pays more for longer deliveries, and the per-gig premium on distance is substantial. The p90 per-task figure ($20.27) versus the median ($9.60) is partly driven by drivers who consistently accept longer-distance gigs that pay $15 to $25+. While long-distance gigs take more time and put more miles on your vehicle, the per-delivery pay often translates to a higher effective hourly rate than multiple short runs.
Position Near Retail Partner Hotspots
Roadie gigs originate from retail stores, not restaurants. Your positioning strategy should target:
- Home Depot locations: Consistently high gig volume, especially for large-item deliveries
- Walmart stores: General package and retail delivery volume
- Best Buy locations: Electronics and appliance deliveries
- Retail corridor areas: Shopping centers with multiple Roadie partners in close proximity give you the highest gig density
Multi-App Between Roadie Gigs
Roadie's gig flow can be inconsistent, especially in smaller markets. Between Roadie deliveries, toggle on DoorDash or Amazon Flex to fill gaps. Use Roadie for its highest-paying gigs (big & bulky, long-distance) and fill downtime with food delivery or Amazon blocks. Many experienced gig drivers earn $18 to $22 per hour by multi-apping strategically with Roadie as one piece of the puzzle.
Track Your Earnings by Gig Type
Not all Roadie gigs are created equal. Track your per-hour earnings by gig type (small vs big & bulky), retail partner (Home Depot vs Walmart vs Best Buy), and time of day. Over time, you will identify which gig types and locations produce the highest effective hourly rate. Gridwise tracks this automatically across all your gig apps.
Roadie vs Amazon Flex vs DoorDash
Roadie competes most directly with other package and delivery platforms. Here is how it compares using real Gridwise data.
Median Hourly Earnings
- Roadie: $12.70/hr (total trip pay)
- DoorDash: $11.26/hr
- Amazon Flex: Varies by delivery block (typically $18-25/hr for scheduled blocks)
Roadie's median hourly rate is 13% higher than DoorDash, but the comparison is not straightforward because the platforms are fundamentally different. DoorDash delivers food and the tipping culture adds significantly to earnings. Amazon Flex operates on a block-based scheduling model with more predictable hourly rates but less flexibility.
Per-Delivery Earnings
- Roadie: $9.60 per task median
- DoorDash: $7.44 per delivery median
Roadie pays 29% more per individual delivery, reflecting the larger item sizes and longer distances typical of package delivery versus food delivery.
Tips Comparison
- Roadie: $0.01 per task median (effectively zero)
- DoorDash: $3.56 per delivery median (nearly half of total pay)
- Amazon Flex: Minimal tips on most delivery blocks
This is the biggest difference. DoorDash drivers rely heavily on tips -- they account for roughly 48% of hourly earnings. Roadie drivers get no tips. Amazon Flex drivers receive occasional tips but they are not a significant income component. On Roadie, base pay is everything.
Throughput
- DoorDash: 1.51 deliveries per hour median
- Roadie: 1.21 tasks per hour median
DoorDash's food delivery model produces higher throughput -- smaller items, shorter distances, faster handoffs. Roadie's lower throughput reflects the reality of delivering larger packages and items that take more time to load and transport.
Which Platform Is Best?
There is no single best answer -- it depends on your vehicle, location, and goals:
- Roadie is best for: Drivers with trucks or SUVs who can access big & bulky gigs, drivers who prefer package delivery over food handling, drivers who want predictable base-pay earnings with no tip dependency
- DoorDash is best for: Drivers who want maximum flexibility, higher order volume in urban areas, and are comfortable with tip-dependent income
- Amazon Flex is best for: Drivers who prefer scheduled blocks with guaranteed pay rates and do not mind the structure of Amazon's delivery routes
The smartest approach for many gig drivers is to use multiple platforms. Accept Roadie's highest-paying gigs (big & bulky, long-distance), fill gaps with DoorDash food deliveries, and pick up Amazon Flex blocks when the rate is right.
Is Roadie Worth It?
Based on the data: Roadie is worth it as a supplemental gig platform, but it is not the best choice as your sole source of gig income.
Here is the honest case for Roadie:
- $12.70/hr median is modest but real. It is above federal minimum wage and slightly above DoorDash's median. For drivers who prefer package delivery over food, it is a viable option.
- Big & bulky gigs change the math. If you have a truck or SUV and consistently land big & bulky deliveries, your effective hourly rate can reach $20+ -- competitive with most delivery platforms.
- Predictable earnings. No tip dependency means what you see is what you get. Every gig shows you the payout upfront. There is no guessing about whether a customer will tip $5 or $0.
- UPS backing provides stability. Roadie is not a venture-funded startup burning cash. It is owned by UPS, one of the largest logistics companies in the world. The platform is unlikely to disappear or dramatically cut driver pay overnight.
- No food handling. No hot bags, no restaurant wait times, no spilled drinks, no food safety concerns. You are delivering boxes and packages.
- Lower vehicle wear on short runs. At $1.58 per mile median, Roadie's per-mile rate covers vehicle costs comfortably. Short local deliveries put minimal wear on your car.
Here is when Roadie is not the right fit:
- You need full-time gig income. At $12.70/hr median, 40 hours per week produces roughly $508 per week before expenses. After gas, maintenance, and insurance, net pay could drop to $400 or less weekly. Platforms like Spark ($21.74/hr median) or Uber rideshare ($21.18/hr median) offer substantially higher full-time earning potential.
- You drive a sedan. Without access to big & bulky gigs, you are limited to small and medium deliveries that pay less. The highest-earning Roadie drivers almost universally have trucks or SUVs.
- Your area has low Roadie volume. Roadie gig availability varies significantly by market. If you live far from major retail partners or in a market with low same-day delivery demand, gig flow may be too inconsistent to rely on.
- You expect tips. If tip income is part of your earnings calculation, Roadie will disappoint. This is a zero-tip platform for the vast majority of deliveries.
The best way to use Roadie: treat it as one app in a multi-platform strategy. Accept Roadie's big & bulky and long-distance gigs when they pay well, fill the gaps with DoorDash or Amazon Flex, and track everything so you know which combination produces the highest hourly rate. Do not forget to claim tax deductions for gig workers -- mileage, phone expenses, and vehicle costs add up quickly.
Roadie Driver Earnings FAQ
How much can you make doing Roadie full-time?
At the median hourly rate of $12.70, a full-time Roadie driver working 40 hours per week would earn approximately $508 per week or $2,032 per month before expenses. Top 10% drivers earning $20.49 per hour would gross about $820 per week. After expenses (gas, maintenance, insurance), most full-time Roadie drivers can expect to net $10 to $12 per hour at the median level. However, Roadie gig flow may not consistently support 40 hours per week in all markets, making full-time Roadie-only driving challenging.
How much do Roadie drivers make per delivery?
The median Roadie driver earns $9.60 per delivery in total trip pay. The average is higher at $11.65, pulled up by big & bulky and long-distance gigs. Top 25% of drivers earn $13.92 or more per delivery, and top 10% earn $20.27 or more -- more than double the median.
Do Roadie drivers get tips?
Effectively, no. The median tip on Roadie is $0.01 per delivery. Roadie delivers packages and retail items, not food, and customers rarely tip for package delivery. The average tip of $0.37 per task is pulled up by rare tipped deliveries, but the vast majority of Roadie gigs come with zero tips. Plan your earnings expectations using base pay only.
Is Roadie better than DoorDash?
Roadie's median hourly pay ($12.70) is slightly higher than DoorDash ($11.26), but the comparison depends on your situation. DoorDash offers higher order volume in most markets, tips that add significantly to earnings (median $3.56 per delivery), and 24/7 availability through late-night restaurants. Roadie offers higher per-delivery pay ($9.60 vs $7.44), no food handling, and predictable base-pay earnings. For drivers with trucks or SUVs who can access big & bulky gigs, Roadie can outpay DoorDash. For sedan drivers in urban areas, DoorDash is typically the better option.
How much do Roadie drivers make after expenses?
After accounting for gas, vehicle maintenance, and depreciation, most Roadie drivers net approximately $10 to $12 per hour at the median level. The $1.58 per mile median pay rate is above the IRS standard mileage deduction ($0.70/mile in 2026), which helps offset vehicle costs at tax time. Drivers who focus on shorter-distance deliveries with higher per-mile rates will retain more of their earnings after expenses.
Do you need a truck for Roadie?
No -- any reliable vehicle can complete small and medium Roadie gigs. However, a truck, SUV, or van is strongly recommended if you want to maximize your earnings. Big & bulky deliveries (furniture, appliances, large home improvement items) are Roadie's highest-paying category, and they require significant cargo space. Sedan drivers are limited to lower-paying gig types, which is why vehicle choice significantly impacts earning potential on this platform.
Start Tracking Your Roadie Earnings Today
Roadie drivers earn a median of $12.70 per hour -- modest compared to top-paying platforms, but competitive with food delivery apps and offering a fundamentally different kind of gig work. Tips are essentially zero, but base pay is predictable. The real money is in big & bulky deliveries, where top earners push past $20 per hour. Your vehicle, gig selection strategy, and willingness to multi-app across platforms determine whether Roadie is a $12-per-hour side hustle or a $20-per-hour earner.
The drivers who earn the most are the ones who track their numbers. They know which gig types pay best, which retail locations produce the most volume, and when to switch to another app during slow periods. That is exactly what Gridwise does automatically -- tracking every delivery across all your gig apps, calculating your true hourly rate, and showing you where your time is best spent.

How Much Do Veho Drivers Make? (2026 Guide)
How much do Veho drivers make in 2026? Veho is a fast-growing last-mile package delivery platform that connects drivers with e-commerce and retail brands needing packages delivered to customers. If you have driven for Amazon Flex or Roadie, the model will feel familiar: you claim a delivery route, pick up packages from a hub, and deliver them along your assigned route. Based on publicly reported driver data, job listings, and driver community feedback, Veho drivers typically earn between $16 and $25 per hour depending on route type, market, and efficiency. A note on our data: Gridwise does not currently track Veho-specific earnings. The Veho figures in this article come from public sources. Where we reference Amazon Flex or Roadie data, those numbers come from Gridwise's proprietary dataset -- we will always make that distinction clear.
Quick Answer -- How Much Do Veho Drivers Make?
Based on driver reports, job board listings, and gig worker community data, Veho drivers typically earn between $16 and $25 per hour before expenses. Most drivers report earning closer to the $18 to $22 per hour range on standard routes in mid-size and large markets.
For context, here is how that compares to similar platforms tracked by Gridwise:
- Amazon Flex driver earnings: $20.89/hr median (Gridwise data from tracked drivers)
- Roadie driver earnings: $12.70/hr median (Gridwise data from 6,725 tracked drivers)
- Veho: $16\u2013$25/hr reported range (public sources, not Gridwise data)
That puts Veho squarely between Roadie and Amazon Flex in terms of reported hourly pay. The range is wide because Veho pay depends heavily on your market, route length, and how quickly you complete your deliveries.
Veho Driver Pay Breakdown
Veho pays drivers per route, not per package or per hour. You claim a route through the Veho app, pick up your assigned packages from a local Veho delivery hub, and deliver them along a predetermined path. Your pay for that route is set before you start.
Per-Route Pay
Drivers report route pay ranging from $60 to $150 or more depending on several factors:
- Package count: Routes typically include 20 to 40+ packages. More packages generally means higher pay.
- Route distance: Longer routes covering more ground pay more than compact urban routes.
- Market: Pay varies significantly by city. Higher cost-of-living markets and markets with fewer available drivers tend to offer better route pay.
- Time of year: Holiday seasons and peak e-commerce periods (Black Friday through January) often bring higher route payouts.
Effective Hourly Rate
Most Veho routes are designed to take 3 to 5 hours. If you earn $80 on a route and finish in 4 hours, that is $20 per hour. Finish the same route in 3 hours and your effective rate jumps to $26.67 per hour. This is one of the most attractive aspects of Veho's model: you keep the full route pay regardless of how quickly you finish. Faster drivers earn a higher effective hourly rate.
Per-Package Estimate
Working backward from route pay and package counts, drivers report earning roughly $1.50 to $3.50 per package. This is not how Veho structures its pay -- they pay per route, not per package -- but the per-package math helps you evaluate whether a route is worth claiming.
How Veho Pay Works
Understanding Veho's pay mechanics helps you decide which routes to claim and how to maximize your time on the platform.
Route Claiming
Veho uses a route-claim system similar to Amazon Flex's block system. Routes become available in the app, and drivers claim them on a first-come, first-served basis. Each route includes:
- A pickup location (Veho delivery hub or partner warehouse)
- A set number of packages to deliver
- A delivery zone with mapped stops
- A fixed pay amount visible before you claim the route
This transparency is a significant advantage. Unlike food delivery platforms where you accept orders without knowing exactly how long they will take, Veho tells you the pay and approximate scope before you commit.
Delivery Hub Model
Unlike Roadie (which dispatches from retail stores) or Amazon Flex (which uses Amazon warehouses), Veho operates its own network of delivery hubs. You drive to a Veho hub, scan and load your packages, and head out on your route. The hub model means your first stop is always the same location for a given market, which makes planning your day easier.
Finish Early, Keep Full Pay
This is the key Veho incentive. If your route is estimated at 4 hours and you finish in 3, you still earn the full route pay. Experienced drivers who learn efficient delivery techniques -- optimal stop ordering, quick parking strategies, and familiarity with their delivery zones -- can consistently beat the estimated completion time and effectively increase their hourly rate.
Payment Schedule
Veho typically pays drivers within 24 to 48 hours of completing a route via direct deposit. Some markets may offer same-day or next-day payment options. This is faster than the weekly pay cycles on some competing platforms.
Tips on Veho
Expect minimal to zero tips on Veho. This is package delivery for e-commerce brands and retailers -- not food or grocery delivery. Customers receiving a Veho package usually do not even know who is delivering it until the driver arrives, and there is no built-in tipping prompt in the customer experience the way there is on DoorDash or Uber Eats.
For comparison, Roadie driver earnings show a median tip of just $0.01 per delivery based on Gridwise data from 6,725 drivers -- and Roadie at least delivers branded retail items where customers might think to tip. Package delivery from unknown e-commerce orders is even less likely to generate tips.
The upside of no tips: your earnings are predictable. The route pay you see before claiming is effectively your total compensation. There is no hoping for a generous tipper or worrying about a $0 tip tanking your hourly rate. What you see is what you get.
How to Earn More on Veho
Since Veho pay is route-based and you keep the full amount regardless of completion time, earning more comes down to two things: picking better routes and finishing them faster.
Prioritize High-Pay Routes
Not all routes are created equal. Routes with more packages, longer distances, or in higher-demand markets pay more. When multiple routes are available, do the quick math: divide the route pay by the estimated hours to find your effective hourly rate. A $120 route estimated at 4 hours ($30/hr) beats a $75 route estimated at 3 hours ($25/hr) even though the shorter route sounds more convenient.
Build Route Efficiency
The fastest way to increase your effective hourly rate is to finish routes ahead of schedule. Strategies that experienced Veho drivers report using:
- Sort packages at the hub: Organize your packages by stop order before leaving. This saves time at every delivery.
- Learn your delivery zones: Familiarity with neighborhoods, apartment complex layouts, and parking options cuts minutes per stop.
- Optimize your stop sequence: The Veho app provides a suggested route, but experienced drivers sometimes find more efficient paths.
- Minimize failed deliveries: Every redelivery attempt costs you time. Follow delivery instructions carefully on the first attempt.
Choose the Right Vehicle
A vehicle with more cargo space lets you handle larger routes with more packages in a single run. SUVs and minivans are ideal for Veho -- they offer the cargo space of a truck with easier access for frequent loading and unloading. Sedans work for smaller routes but may limit the routes available to you.
Multi-App Between Routes
If Veho route availability is inconsistent in your market, pair it with other delivery platforms between routes. Amazon Flex driver earnings average $20.89/hr median per Gridwise data, and the block-based structure fits well alongside Veho routes. Roadie driver earnings are lower at $12.70/hr median, but Roadie gigs can fill gaps between Veho routes nicely.
Watch for Peak Periods
E-commerce delivery volume surges during holiday seasons, Prime Day events, and major retail sales. Veho typically offers more routes and sometimes higher pay during these periods. Drivers who make themselves available during peak season can earn significantly more.
Veho vs Amazon Flex vs Roadie -- How Pay Compares
All three platforms involve delivering packages in your own vehicle, but they differ in structure, pay, and who you are delivering for. Here is how they compare.
Pay Comparison
- Amazon Flex: $20.89/hr median hourly earnings (Gridwise data). Block-based, delivering Amazon packages from Amazon warehouses. The most established and highest-paying block-based delivery platform.
- Veho: $16\u2013$25/hr reported range (public sources). Route-based, delivering packages from Veho hubs for multiple retail/e-commerce brands. Growing platform with expanding market coverage.
- Roadie: $12.70/hr median hourly earnings (Gridwise data from 6,725 drivers). Per-gig, delivering packages and large items from retail stores. UPS-owned, lower throughput, essentially no tips.
Model Differences
- Amazon Flex: You deliver exclusively Amazon packages. Blocks are claimed from Amazon logistics warehouses. Pay is per block (typically 3-5 hours). Amazon controls the delivery ecosystem end to end.
- Veho: You deliver packages for multiple e-commerce brands and retailers. Routes are claimed from Veho's own delivery hubs. Pay is per route. Veho is a third-party logistics provider, not a retailer.
- Roadie: You deliver packages, large items, and specialty items (like Delta Air Lines luggage) from retail stores. UPS-owned. Per-gig pricing based on distance, size, and weight. Gig types range from small packages to big and bulky furniture.
Which Is Best?
Amazon Flex pays the most based on Gridwise data but has the most competition for blocks. Veho offers comparable pay in some markets with potentially less competition as the platform grows. Roadie pays less but offers unique big and bulky gigs that can be lucrative for drivers with trucks or SUVs. Many drivers run two or all three of these platforms to maximize their delivery hours.
Is Veho Worth It?
Veho is worth considering if you are in or near a market where it operates. Here is the honest assessment.
The Case for Veho
- Predictable pay: You see the route pay before you claim it. No guessing, no tip dependency.
- Efficiency is rewarded: Finish early and your effective hourly rate goes up. This is rare in gig work.
- Growing platform: Veho has expanded rapidly into new markets since 2023. More hubs mean more routes and more opportunity.
- No passenger interaction: Package delivery means no rider ratings, no awkward conversations, and no concerns about vehicle interior condition.
- Fast payment: 24-48 hour payment turnaround beats the weekly cycles on some platforms.
The Case Against Veho
- Limited markets: Veho does not operate everywhere. If there is no Veho hub near you, it is not an option.
- No tips: Your route pay is your total pay. On food delivery platforms like DoorDash, tips can add 30-50% to your base pay.
- Route competition: In popular markets, desirable routes get claimed quickly. You may need to check the app frequently to grab good routes.
- Expenses eat into pay: Like all gig delivery work, you pay for gas, vehicle maintenance, and insurance. At $18-22/hr gross, net pay after expenses is likely $13-17/hr. Make sure you are tracking tax deductions for gig workers to offset your costs.
Bottom Line
Veho is a solid option for drivers who want predictable, route-based package delivery income. It is not the highest-paying gig platform -- Uber driver earnings and Amazon Flex tend to be higher -- but the pay transparency and efficiency incentives make it attractive for organized, fast drivers. As Veho continues expanding into new markets, it is a platform worth watching.
Veho Driver Earnings FAQ
How much can you make doing Veho full-time?
At the reported range of $16-25/hr, a driver working 40 hours per week could gross roughly $640 to $1,000 per week before expenses. After accounting for gas, maintenance, and self-employment taxes, net income would likely be $500 to $800 per week. These are estimates based on public driver reports, not Gridwise-tracked data.
How much do Veho drivers make per route?
Route pay ranges from approximately $60 to $150+ depending on package count, route distance, and market. Most standard routes in mid-size markets fall in the $70 to $110 range based on driver reports.
Do Veho drivers get tips?
Effectively no. Veho is a package delivery platform, and customers typically do not tip for e-commerce deliveries. Plan your earnings around route pay only.
Is Veho better than Amazon Flex?
Amazon Flex pays a median of $20.89/hr based on Gridwise data, which is at the upper end of Veho's reported range. Amazon Flex has wider market availability but more competition for blocks. Veho's advantage is growing markets with potentially less driver competition and the finish-early-keep-full-pay structure. Many drivers run both platforms.
How much do Veho drivers make after expenses?
After gas, vehicle maintenance, insurance, and self-employment taxes, Veho drivers likely net $13 to $20 per hour depending on vehicle efficiency and local gas prices. The IRS standard mileage deduction for 2026 is $0.70 per mile -- track your miles carefully to maximize your deductions.
What cities is Veho available in?
Veho has been expanding steadily since 2023 and operates in dozens of U.S. metro areas. Availability changes as the company opens new delivery hubs. Check the Veho app or website for current market availability in your area.
Start Tracking Your Delivery Earnings with Gridwise
Veho is a growing platform with promising pay for package delivery drivers, and it is worth adding to your gig app lineup if it is available in your market. While Gridwise does not currently track Veho-specific earnings data, we continue expanding our platform coverage as the gig economy evolves.
What Gridwise does track right now: real earnings data for Amazon Flex, Roadie, DoorDash, Uber, and 200+ other gig platforms. If you are multi-apping across delivery platforms -- and you should be -- Gridwise gives you the data to see exactly which apps pay you the most per hour, per delivery, and per mile in your market.
How Much Do Uber Black Drivers Make? (2025 Data)
Uber Black is the premium tier of Uber's rideshare platform -- and for drivers who qualify, it can be one of the highest-paying gig opportunities on the road. While a standard UberX trip might pay $12 to $15, a single Uber Black trip routinely pays $40 to $80 or more. The tradeoff? You need a qualifying luxury vehicle, demand is lower, and expenses are significantly higher. In this guide, we break down what Uber Black drivers actually earn, what it costs to operate, and whether the premium tier is worth it for your situation. We will use real earnings data from 66,952 Uber drivers tracked through Gridwise as a baseline, then explain how Uber Black pay differs from the aggregate.
Quick Answer -- How Much Do Uber Black Drivers Make?
Uber Black drivers typically gross $30 to $50 per hour during active driving time in major markets. That is significantly higher than the overall Uber median of $21.92 per hour, which includes all service types (UberX, Comfort, and Black) combined.
Here is how the numbers break down. Gridwise tracks overall Uber driver earnings across all tiers. The aggregate data provides a useful floor:
- All Uber drivers median gross pay: $21.92/hr
- All Uber drivers top 25%: $25.44/hr
- All Uber drivers top 10%: $30.11/hr
- All Uber drivers median per trip: $12.62
- All Uber drivers top 10% per trip: $21.94
Uber Black fares run 2 to 3 times higher than UberX on the same route. Where a typical UberX ride pays $12 to $15, the same distance on Uber Black pays $35 to $60+. For full-time Uber Black drivers in top markets like New York City, Los Angeles, or San Francisco, annual gross earnings of $75,000 to $100,000+ are achievable -- though expenses eat into that figure more than they would for a standard UberX driver.
The key caveat: Uber Black demand is lower than UberX. You will complete fewer trips per hour -- typically 0.8 to 1.2 compared to the 1.7 trips per hour average across all Uber tiers. But each trip is worth so much more that the math often works out in your favor, especially if you are strategic about when and where you drive.
Uber Black vs. UberX -- Why Premium Pays More
The earnings gap between Uber Black and UberX comes down to three factors: higher fares per trip, better tips, and longer average trip distances. Here is how they compare:
Per-Trip Earnings
Across all Uber service types, the median per-trip earnings tracked by Gridwise is $12.62. That figure is heavily weighted toward UberX, which accounts for the vast majority of Uber rides. Uber Black trips typically fall in the $40 to $80+ range, depending on distance and market. Airport transfers and cross-town business trips -- bread-and-butter Uber Black rides -- regularly clear $50 to $100.
The top 10% per-trip figure in our aggregate data ($21.94) gives you a glimpse of what premium-tier trips look like mixed into the overall numbers. Many of those high-value trips are likely Uber Comfort and Black rides pulling the top end upward.
Tips
Across all Uber drivers, the median tip is $1.20 per trip and the average is $1.48. Uber Black riders -- who tend to be business travelers and higher-income passengers -- tip more consistently and at higher amounts. Tips of $5 to $15 per trip are common on Black rides, and some drivers report tip rates of 15-20% on premium fares. On a $60 trip, a 15% tip adds $9 -- compared to the $1.20 median tip on a standard Uber ride.
Trip Volume vs. Trip Value
Standard Uber drivers average about 1.70 trips per hour. Uber Black drivers typically complete fewer trips -- roughly 0.8 to 1.2 per hour -- because demand is lower and trips tend to be longer. The math often still favors Black: one $55 trip per hour beats two $14 trips per hour. But during slow periods, the lower volume can mean significant downtime. Many Black drivers hedge by also accepting Uber Comfort or even UberX requests to fill gaps.
How Uber Black Pay Works
Uber Black uses a premium fare structure that is fundamentally different from UberX pricing.
Premium Fare Structure
Uber Black charges riders higher base fares, per-mile rates, and per-minute rates than UberX. The exact rates vary by market, but as a general comparison:
- Base fare: $8 to $15 (vs. $1 to $3 for UberX)
- Per-mile rate: $3 to $5 (vs. $0.80 to $1.50 for UberX)
- Per-minute rate: $0.40 to $0.65 (vs. $0.10 to $0.20 for UberX)
- Minimum fare: $15 to $25 (vs. $5 to $8 for UberX)
This means even a short Uber Black trip earns you $15 to $25 minimum. A 10-mile, 20-minute trip that would pay $12 to $15 on UberX could pay $45 to $65 on Uber Black.
Surge Pricing on Uber Black
Surge multipliers apply to Uber Black trips just like UberX -- and the dollar impact is much larger on a premium fare. A 1.5x surge on a $15 UberX trip adds $7.50. That same 1.5x surge on a $50 Black trip adds $25. Experienced Black drivers position themselves near airports, convention centers, and high-end hotels during peak demand to catch premium surge fares.
Uber's Service Fee
Uber still takes its service fee on Black trips, typically around 25% of the fare before tips. On a $60 trip, that is $15 to Uber and $45 to you -- plus the full tip amount. Tips are passed through to drivers at 100%.
Uber Black SUV
Uber Black SUV is an even higher-paying tier for drivers with qualifying luxury SUVs that seat 6+ passengers. Black SUV fares run 20-30% higher than standard Uber Black. Vehicles like the Cadillac Escalade, Lincoln Navigator, Mercedes GLS, and BMW X7 qualify. If you already own one of these vehicles, Black SUV can be the most lucrative rideshare tier available.
Uber Black Vehicle Requirements
Not every luxury car qualifies for Uber Black. The requirements are strict and vary by market, but here are the general standards:
Vehicle Specifications
- Exterior color: Black only
- Interior: Black leather seats required
- Model year: Typically 2019 or newer (varies by market, updated annually)
- Vehicle condition: Excellent -- no dents, scratches, or interior wear
- Four doors minimum
Qualifying Vehicle Makes and Models
Examples of commonly approved Uber Black vehicles include:
- Sedans: BMW 5-Series/7-Series, Mercedes-Benz E-Class/S-Class, Audi A6/A8, Cadillac CT5/CT6, Lincoln Continental, Genesis G80/G90, Lexus ES/LS
- SUVs (for Black SUV tier): Cadillac Escalade, Lincoln Navigator, Mercedes-Benz GLS, BMW X7, Audi Q7, Infiniti QX80, Lexus LX
Uber maintains a market-specific approved vehicle list. Check your city's requirements in the Uber driver app before purchasing or upgrading a vehicle.
Driver Requirements
- Clean driving record -- no major violations in the past 7 years
- Background check -- standard Uber screening plus additional review in some markets
- Commercial insurance -- required in most markets for Black drivers
- TCP or TLC license -- required in California (TCP) and New York City (TLC), among other markets
- Vehicle inspection -- must pass Uber's inspection process
- Professional appearance -- Uber Black riders expect a professional, well-groomed driver
The licensing and insurance requirements can add significant upfront cost. A TCP license in California, for example, involves commercial registration, drug testing, and annual renewal fees. Read our Uber driver insurance guide for a full breakdown of coverage requirements.
Best Times to Drive Uber Black
Uber Black demand follows different patterns than standard UberX. While UberX demand spikes on weekend nights with bar crowds, Black demand peaks during business travel windows and high-end evening events.
To put peak earning times in context, here is what rideshare earnings look like across the full week. This data from Gridwise covers all Uber and Lyft rides combined, showing gross pay per hour by time block and day:
Rideshare Earnings by Day and Time (Gross $/hr)
- Highest earning windows: Sunday 12am-2am ($28.89/hr), Wednesday 12am-2am ($31.07/hr), Saturday 9pm-11pm ($27.32/hr), Saturday 12am-2am ($28.14/hr)
- Lowest earning windows: Tuesday 9am-11am ($20.01/hr), Tuesday 12pm-2pm ($20.37/hr), Wednesday 9am-11am ($20.33/hr)
- Weekend premium: Weekend evenings and late nights consistently pay 25-40% more than weekday midday hours
For Uber Black specifically, the premium demand windows include:
- Weekday mornings (6am-9am): Business travelers heading to meetings and airports
- Weekday evenings (5pm-9pm): Corporate dinners, client entertainment, executive commutes
- Airport runs (all day): Business and first-class travelers arriving and departing consistently request Black
- Friday and Saturday evenings (7pm-12am): High-end dining, events, and nightlife
- Conference and event days: Major business conferences, sporting events, and concerts drive surge demand for premium rides
Best Markets for Uber Black
Uber Black demand is heavily concentrated in major metropolitan areas with large business traveler and affluent populations:
- New York City -- highest demand and highest fares nationally
- Los Angeles -- entertainment industry and airport traffic
- San Francisco -- tech executives and high-income commuters
- Chicago -- strong business travel market
- Miami -- tourism, events, and nightlife
- Las Vegas -- conventions and high-end tourism
- Washington, D.C. -- government and lobbying travel
If you are in a smaller market, Uber Black demand may be too inconsistent to rely on as a primary income source. Check your market's Black ride availability before committing to the vehicle investment.
Uber Black Expenses -- The Real Costs
Higher earnings come with higher costs. Before calculating your net income as an Uber Black driver, you need to account for expenses that are significantly above what UberX drivers face.
Vehicle Cost
A qualifying Uber Black vehicle typically costs $40,000 to $80,000+ depending on make, model, and condition. Even a used BMW 5-Series or Mercedes E-Class in good condition with recent model year will run $35,000 to $55,000. If you are financing, monthly payments of $600 to $1,200 are common. This is the single largest expense consideration.
Depreciation
Luxury vehicles depreciate faster than economy cars, and rideshare miles accelerate that depreciation significantly. Driving 30,000 to 40,000 miles per year for rideshare can cost $8,000 to $15,000+ per year in depreciation on a luxury vehicle. This is a hidden cost many new drivers underestimate.
Insurance
Uber Black typically requires commercial rideshare insurance, which costs $3,000 to $6,000+ per year -- roughly 2 to 3 times what personal auto insurance costs on the same vehicle. In markets requiring a TCP or TLC license, additional commercial liability coverage may be mandatory. See our Uber driver insurance guide for details on coverage requirements.
Maintenance and Repairs
Luxury car maintenance costs 2 to 3 times more than standard vehicles:
- Oil changes: $80 to $150 (vs. $30 to $50 for standard vehicles)
- Tires: $800 to $1,500+ per set (vs. $400 to $600)
- Brakes: $500 to $1,200 per axle (vs. $200 to $400)
- Annual maintenance budget: $3,000 to $6,000+ depending on mileage
Fuel
Most qualifying luxury vehicles require premium gasoline and get lower fuel economy than compact cars. At 20 to 25 MPG and premium gas prices, fuel costs can run $300 to $500+ per month for full-time driving.
Detailing and Presentation
Uber Black riders expect a spotless vehicle inside and out. Budget for professional detailing every 1 to 2 weeks at $50 to $100 per visit, plus supplies for daily touch-ups. That is $150 to $400+ per month for a full-time driver.
Total Expense Estimate
For a full-time Uber Black driver, total annual expenses (excluding vehicle purchase/financing) typically run $15,000 to $25,000+:
- Insurance: $3,000 to $6,000
- Maintenance: $3,000 to $6,000
- Fuel: $3,600 to $6,000
- Depreciation: $8,000 to $15,000
- Detailing: $1,800 to $4,800
- Licensing/permits: $500 to $2,000
Make sure you are tracking every business expense for tax deductions for gig workers. The standard mileage deduction (67 cents per mile in 2026) can offset a significant portion of these costs. Read our Uber driver tax guide for a complete breakdown.
Is Uber Black Worth It?
The answer depends almost entirely on one question: do you already own a qualifying luxury vehicle?
Scenario 1: You Already Own a Qualifying Vehicle
If you have a black BMW 5-Series, Mercedes E-Class, or similar luxury sedan sitting in your driveway, Uber Black can be an excellent income source. Your incremental costs are the insurance upgrade ($2,000 to $4,000 more per year), commercial licensing, and extra detailing. Against potential gross earnings of $50,000 to $80,000+ per year in a good market, the ROI is strong.
Even part-time -- driving 15 to 20 hours per week targeting peak demand windows -- you could gross $25,000 to $40,000 per year with relatively low incremental expenses. Many drivers in this situation find Black significantly more profitable than UberX.
Scenario 2: You Would Need to Buy a Qualifying Vehicle
If you need to purchase a luxury vehicle specifically for Uber Black, the math gets much tighter. A $50,000 vehicle with $800/month payments plus the higher insurance, maintenance, and fuel costs means you need to gross $35,000 to $45,000 per year just to cover your additional vehicle-related expenses -- before you have earned a dollar of actual income.
In top markets with strong Black demand (NYC, LA, SF), buying a qualifying vehicle can still make financial sense if you commit to driving 30+ hours per week. In smaller or less dense markets, the risk is considerably higher. We generally would not recommend purchasing a luxury vehicle solely for Uber Black unless you have researched your specific market thoroughly and have a financial cushion.
The Hybrid Approach
Many successful Uber Black drivers take a hybrid approach: they accept Black requests when available and fill downtime with Uber Comfort or UberX trips. This maximizes your earning hours while still capturing premium fares when demand is there. If your vehicle qualifies for multiple tiers, this is typically the most profitable strategy.
For comparison, see how Lyft driver earnings stack up if you are considering multi-apping to fill gaps in Black demand.
Uber Black Driver Earnings FAQ
How much do Uber Black drivers make per trip?
Uber Black trips typically pay $40 to $80+ depending on distance and market. Short trips still earn the minimum fare ($15 to $25), while airport transfers and cross-town rides regularly exceed $60. For context, the median per-trip earnings across all Uber service types is $12.62 based on Gridwise data from 66,952 drivers.
Can you do Uber Black part-time?
Yes, and many Black drivers do exactly that. Targeting peak demand windows -- weekday business hours, airport runs, and Friday/Saturday evenings -- allows part-time drivers to capture premium fares without the downtime that comes with off-peak hours. Part-time Black drivers working 15 to 20 hours per week in strong markets can gross $1,000 to $1,800+ per week.
How much do Uber Black drivers make in New York City?
NYC is the strongest Uber Black market in the country. Full-time Black drivers in New York report gross earnings of $40 to $60+ per hour, with annual gross income of $80,000 to $120,000+. However, NYC also requires a TLC license and commercial insurance, which adds significant cost. Net earnings after all expenses typically range from $50,000 to $75,000 for full-time drivers.
Do Uber Black drivers get better tips?
Significantly better. While the median tip across all Uber rides is $1.20 per trip (based on Gridwise data), Uber Black riders tip more frequently and at higher amounts. Tips of $5 to $15 are common, and some drivers report that 60-70% of Black riders tip compared to roughly 30-40% of UberX riders. Professional service -- opening doors, offering water, maintaining a pristine vehicle -- directly impacts your tip rate.
What is the difference between Uber Black and Uber Black SUV?
Uber Black SUV requires a qualifying luxury SUV with seating for 6+ passengers (vehicles like the Cadillac Escalade, Lincoln Navigator, or Mercedes GLS). Black SUV fares are 20 to 30% higher than standard Uber Black. The tradeoff is a more expensive vehicle with higher fuel and maintenance costs, but per-trip earnings can exceed $100 on longer routes.
How do I sign up for Uber Black?
You apply through the Uber driver app or website. You will need to submit your vehicle information for approval, provide proof of commercial insurance (in most markets), pass a background check, and complete a vehicle inspection. In markets requiring a TCP or TLC license, you must obtain that license before you can be approved. The approval process typically takes 1 to 3 weeks.
Start Maximizing Your Premium Earnings
Whether you drive Uber Black, UberX, or a mix of both, the drivers who earn the most are the ones who know their numbers. They track their real hourly rate, they know which days and times generate the best fares in their market, and they log every mile for tax deductions.
The data in this article draws from 66,952 Uber drivers who track their earnings through Gridwise. While we do not break out Uber Black as a separate tier, the aggregate data provides a reliable baseline -- and the premium that Black commands above that baseline is well-documented by drivers across the platform.
Work smarter. Earn more.
Whether you drive, deliver, or pick up shifts — Gridwise helps you track earnings, mileage, and performance so you stay in control of your work. Download the app and take charge today.
