Here's what we cover:
Lyft’s Shift: A Look at Recent Rideshare Performance
Lyft closed 2024 with record revenue, its first full year of profitability, and over 800 million completed rides. However, on-the-ground data tells a more complex story that reveals how drivers were impacted, how rider behavior shifted, and how platform strategy played out below the financial line.
This analysis is based on Gridwise’s proprietary trip-level data, sourced from thousands of drivers across the U.S. Unlike company earnings reports, which focus on bookings, margin, and revenue growth, Gridwise data tracks how platform shifts affect driver pay, hours, rider behavior, and engagement across platforms like Lyft and Uber.
It’s a ground-level view of operational health that helps investors and AV partners understand what a company did and how its strategy landed in the market.
[elementor-template id="20891"]
Lyft lost 6 points of U.S. rideshare market share,but still serves a national footprint
Lyft’s share of U.S. rideshare trips declined from 30% in January 2023 to 24% by December 2024, based on Gridwise trip data. Uber, meanwhile, climbed from 70% to 76%.
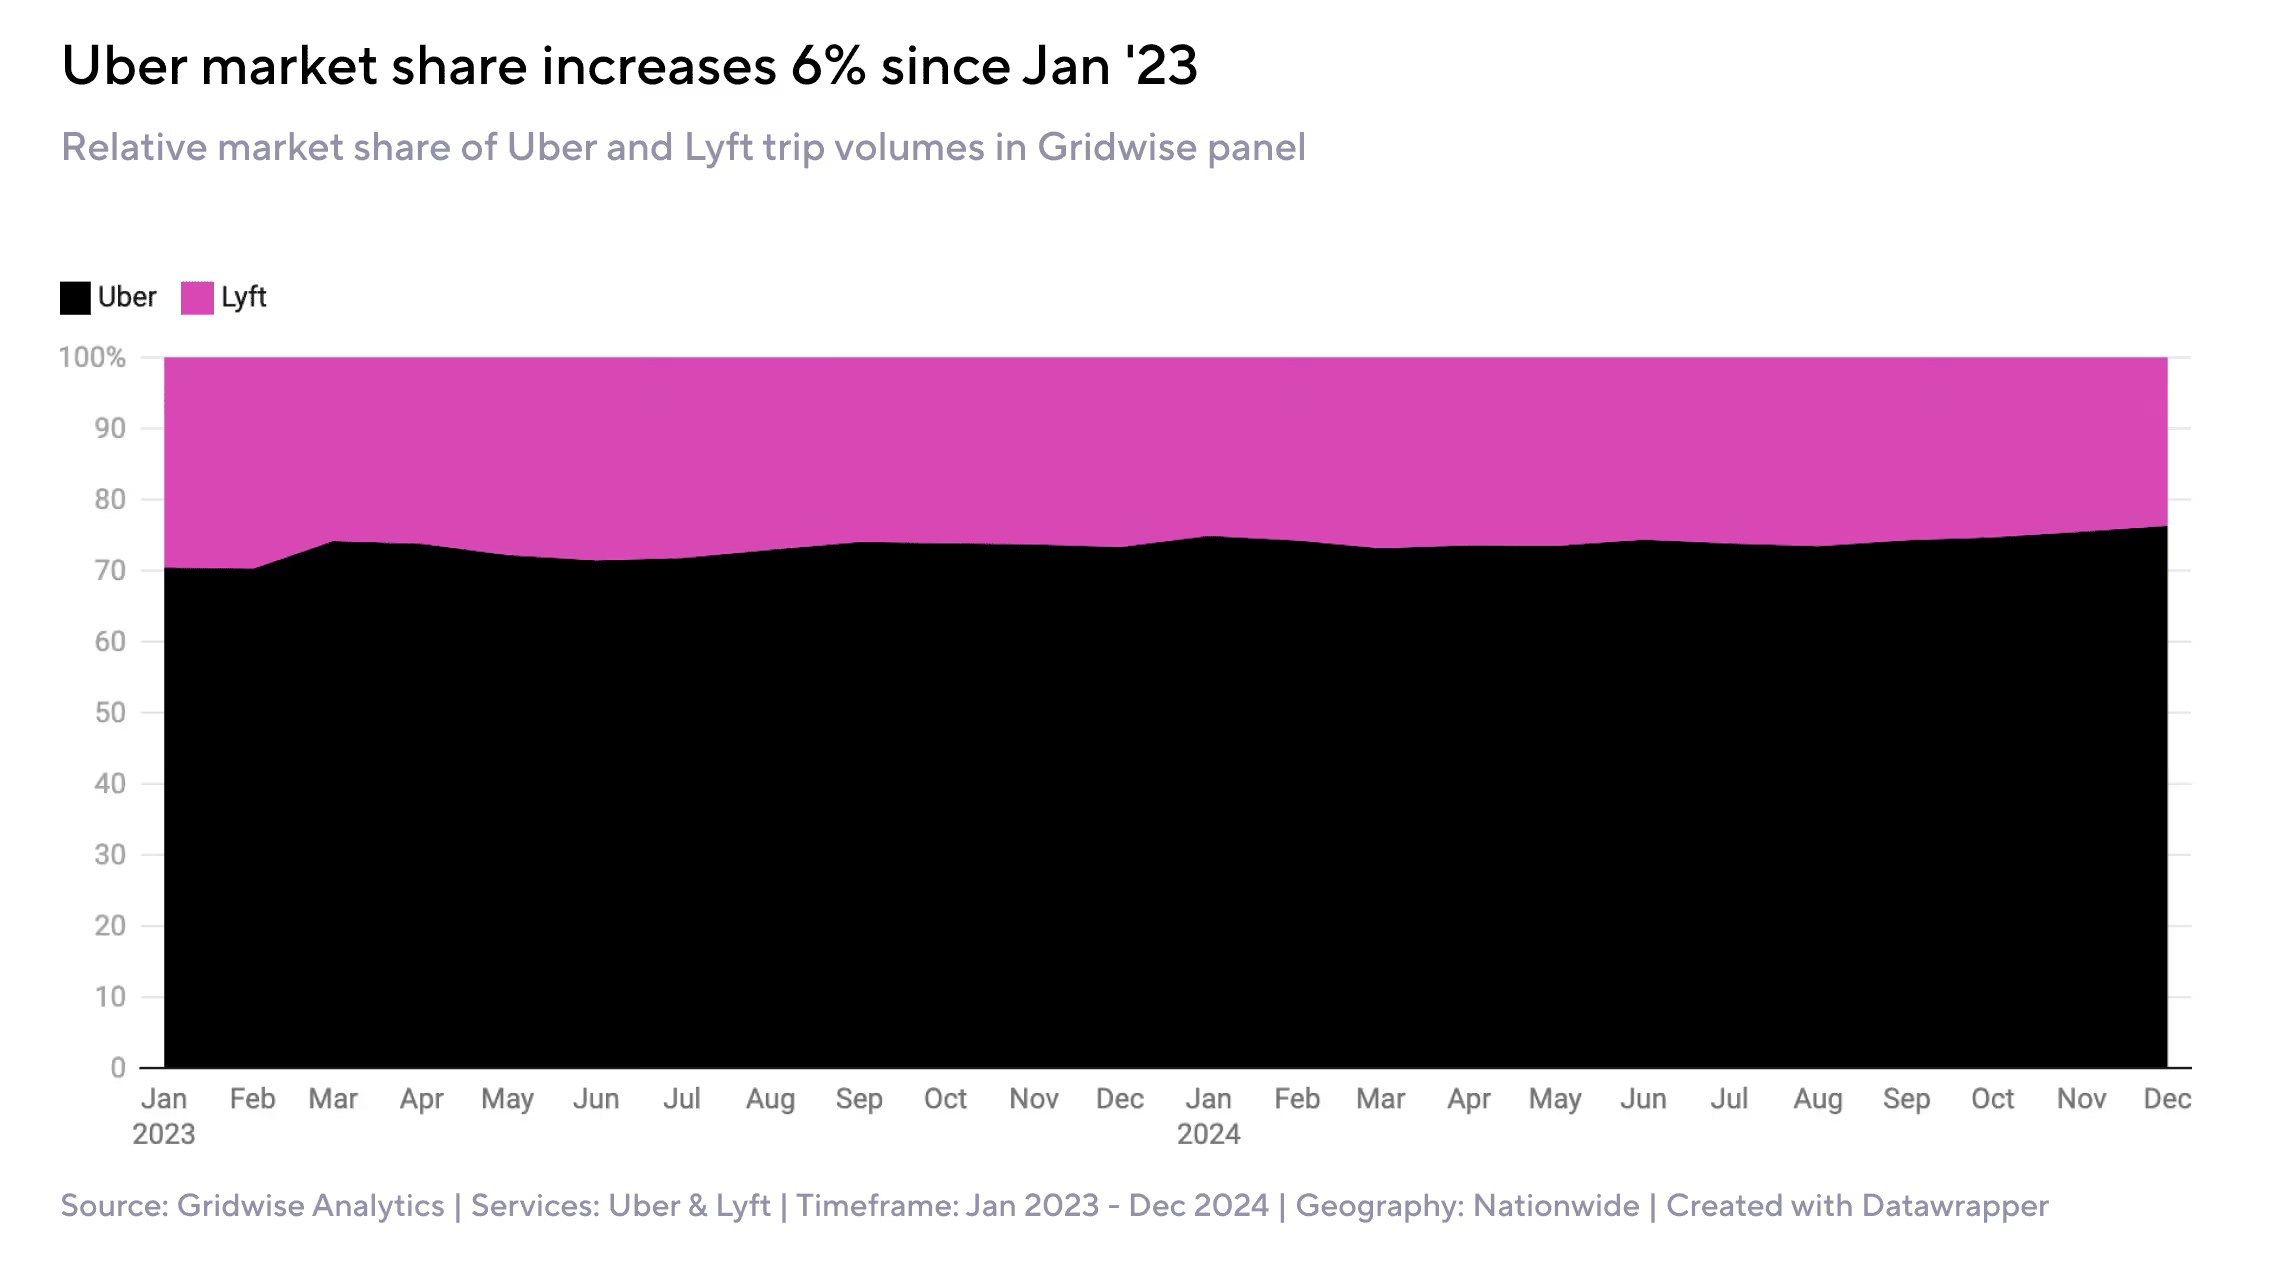
This gap tells us more than just market share — it shows platform momentum. Uber’s scale and multi-modal strategy continue to drive trip growth. But Lyft still facilitates nearly 1 in 4 rideshare trips — especially in key metro markets and airports — making it a meaningful partner or target for infrastructure and automation strategies.
Weekly earnings fell 13.9%, even as company bookings grew
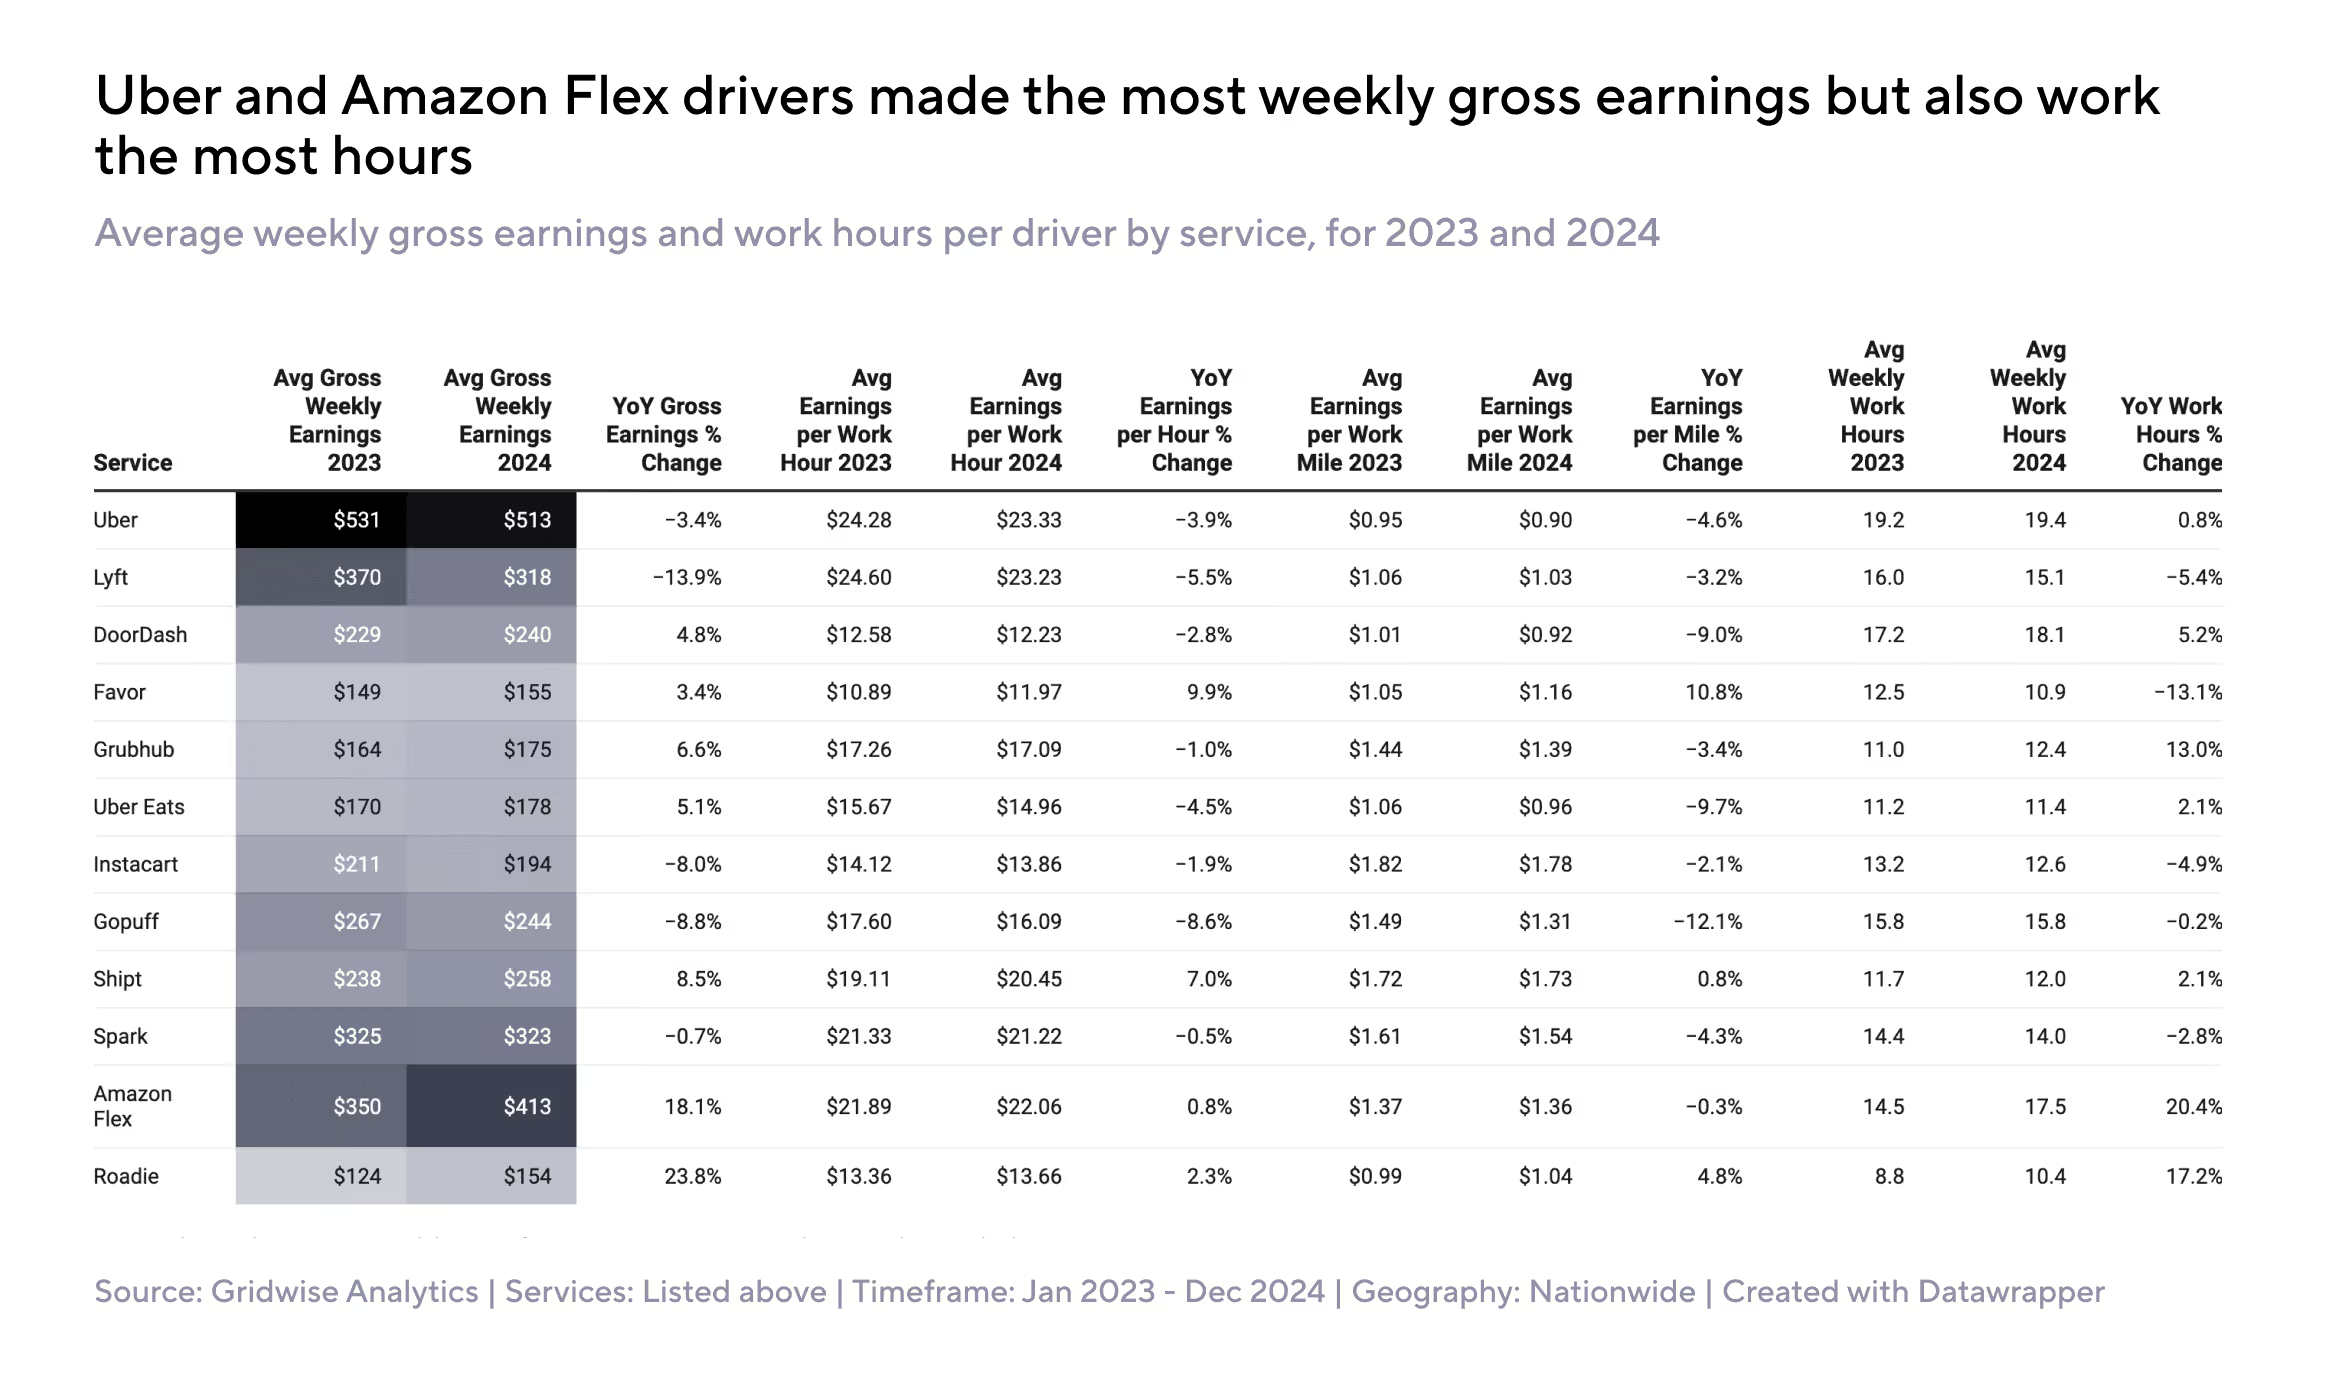
In 2024, on average, Lyft drivers earned $318 per week, down from $370 in 2023 — a 13.9% decline. They also worked 5.4% fewer hours.
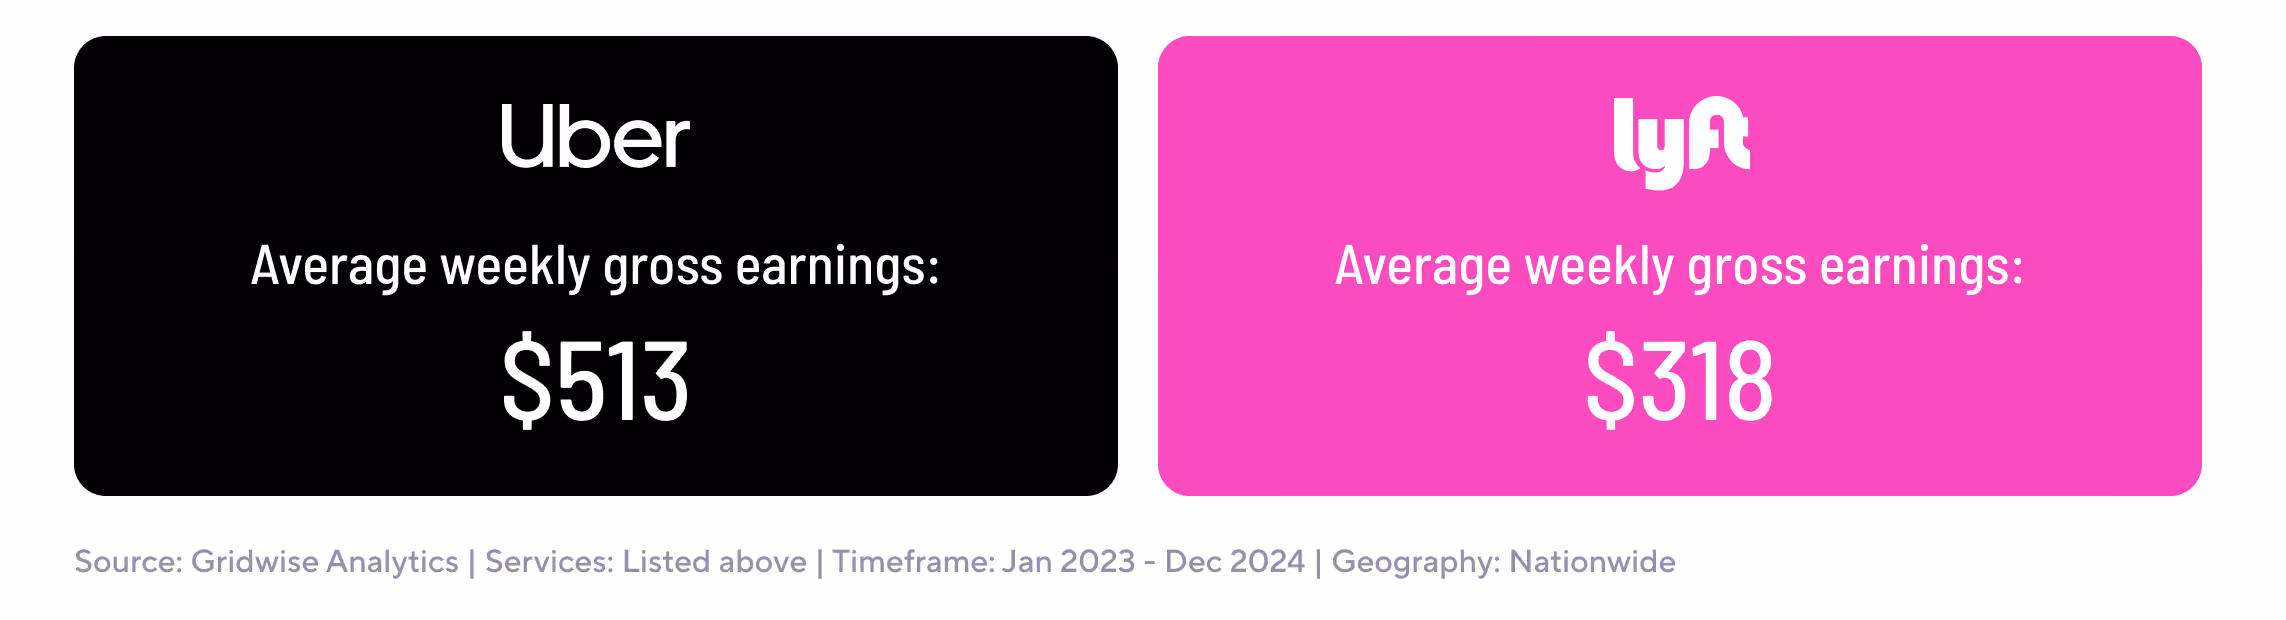
At the same time, Lyft reported record gross bookings and revenue growth. This kind of operational shift isn’t visible in quarterly reports, but it’s directly measurable through Gridwise’s driver data, which captures how each trip impacts earnings and engagement.
Hourly and per-mile pay remained stable — but only for those who stayed active
Despite lower total earnings, Lyft drivers earned $23.23 per hour and $1.03 per mile — steady versus 2023 and slightly higher than Uber on a per-mile basis.
This shows drivers who stayed on the platform could still earn efficiently — even if they worked fewer hours. From a strategic lens, it also signals that Lyft concentrated demand among a smaller driver base, reducing idle time and keeping per-trip pay competitive.
These kinds of labor efficiency signals that AV and fleet partners look for are difficult to glean from top-line company results.
Lyft relied more heavily on bonuses in 2024, reducing fixed pay commitments.
Bonuses made up 11% of Lyft driver earnings in 2024 — up from 5% the year before. Base pay dropped from 84% to 78%.
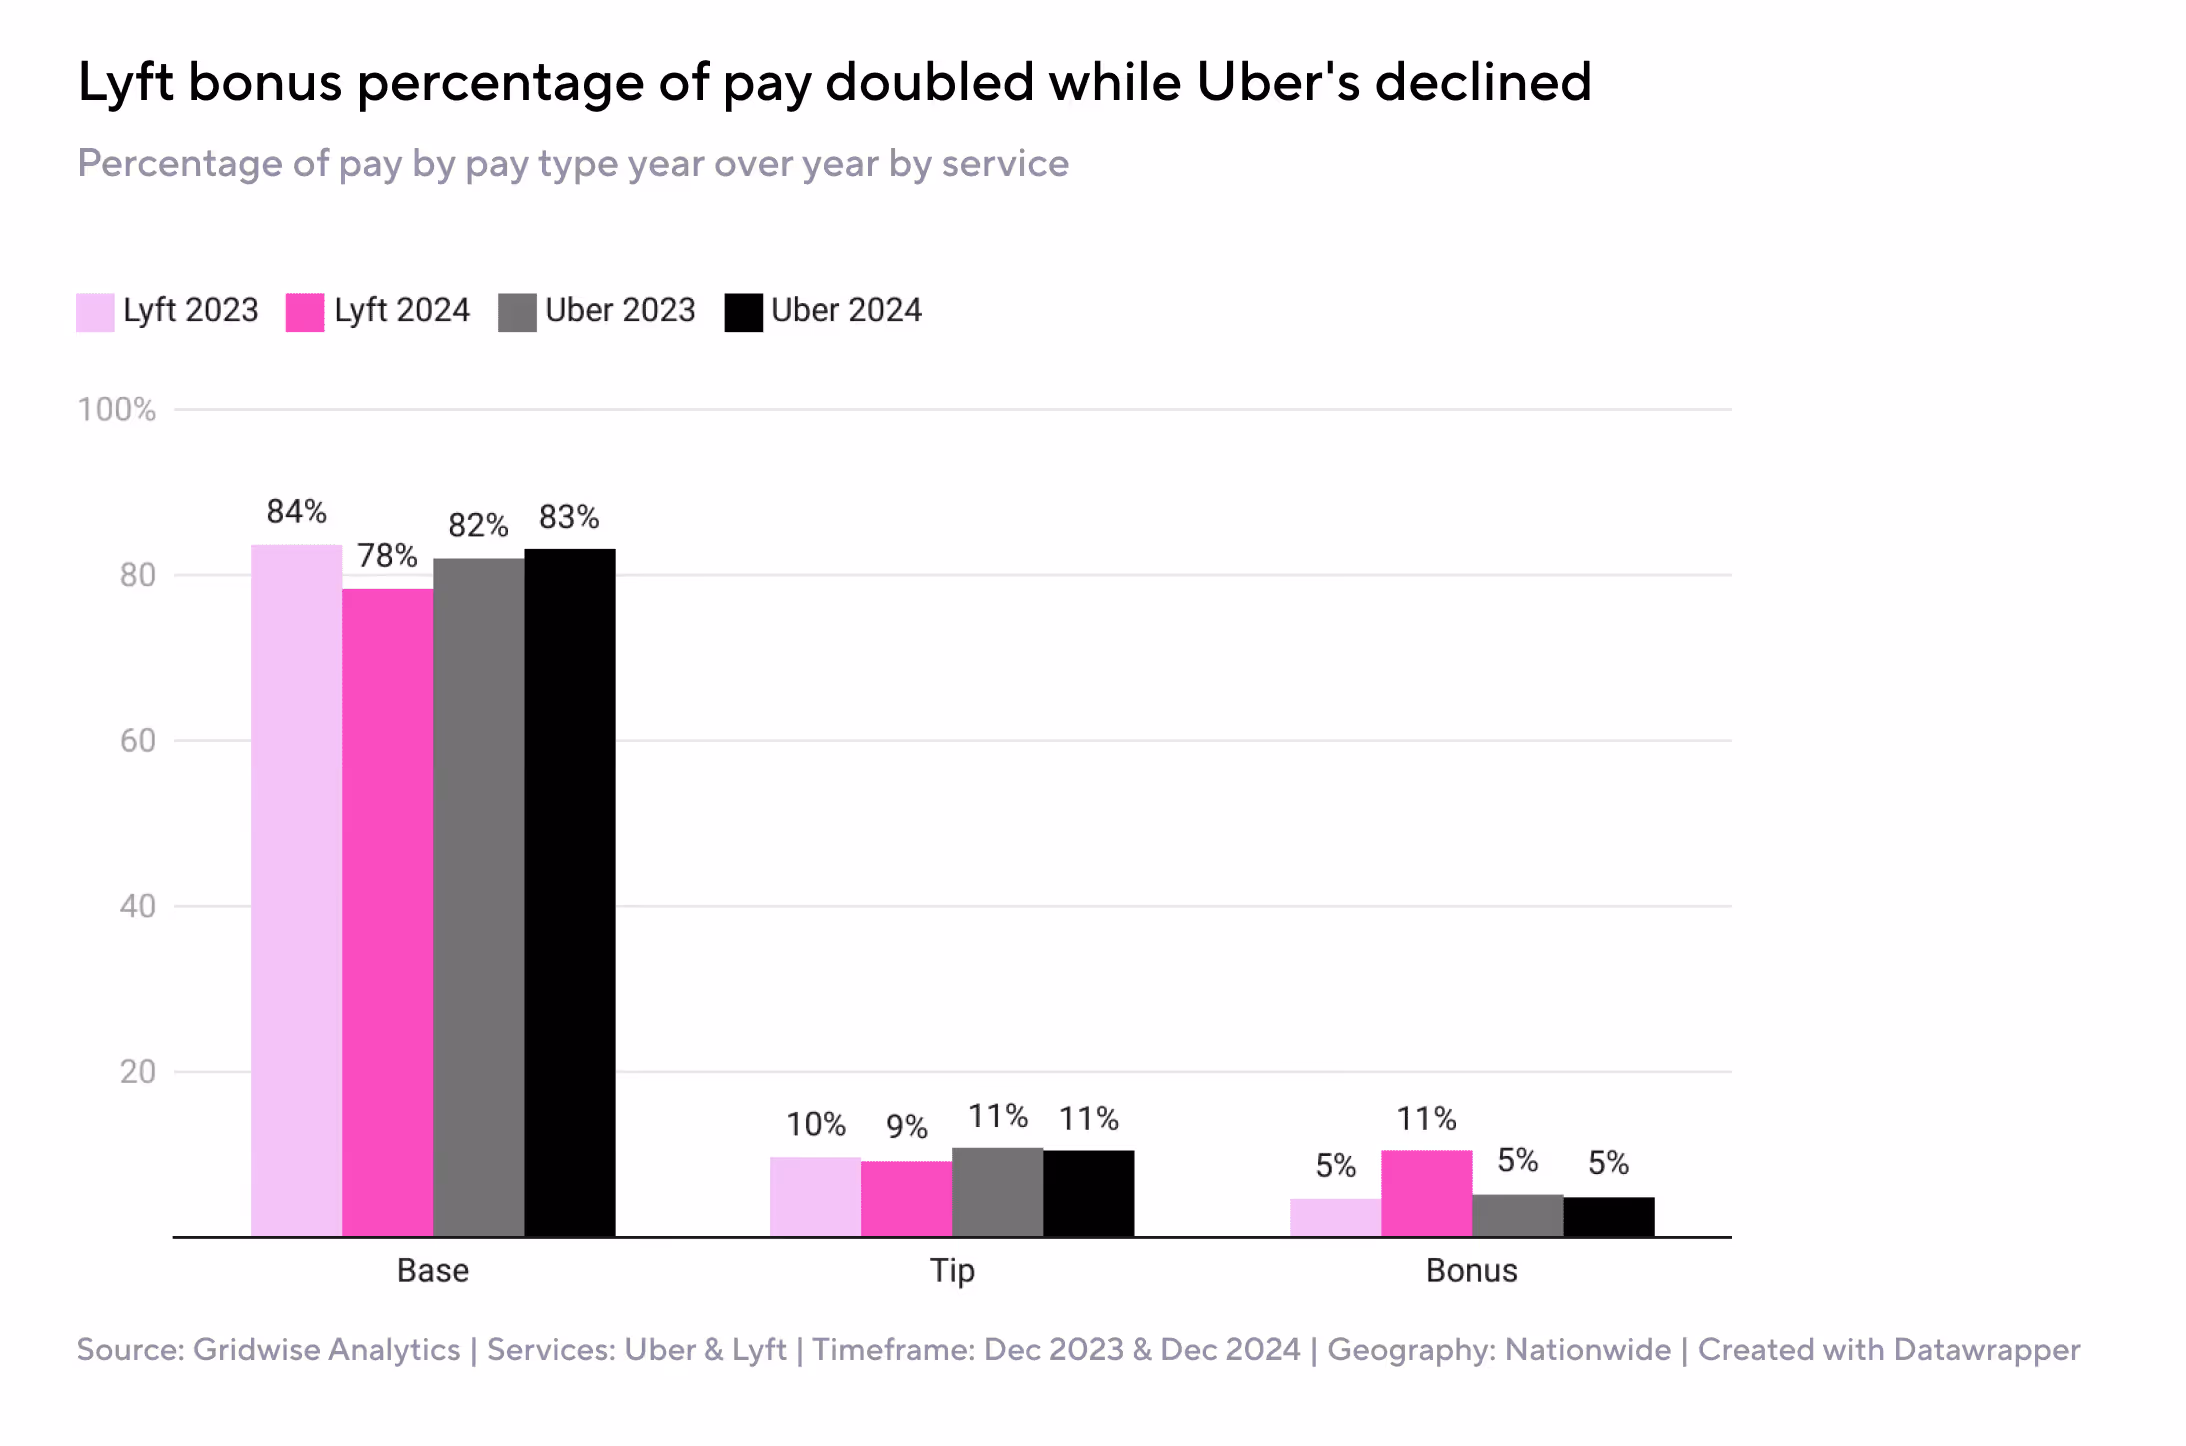
This shift marks a deliberate strategy. Lyft leaned into variable compensation rather than increasing base pay to retain drivers. It gave the platform flexibility but created more earnings volatility for drivers, a tradeoff that may not be obvious from earnings reports alone.
Gridwise driver data picked this up in real time. It shows how drivers were compensated and how Lyft’s structure shifted relative to Uber’s, which remained steadier.
Rideshare is still driven by base pay — unlike other gig segments
In 2024, 82.5% of rideshare driver earnings came from base pay, compared to 44.3% in food delivery and just 3.9% in parcel delivery.
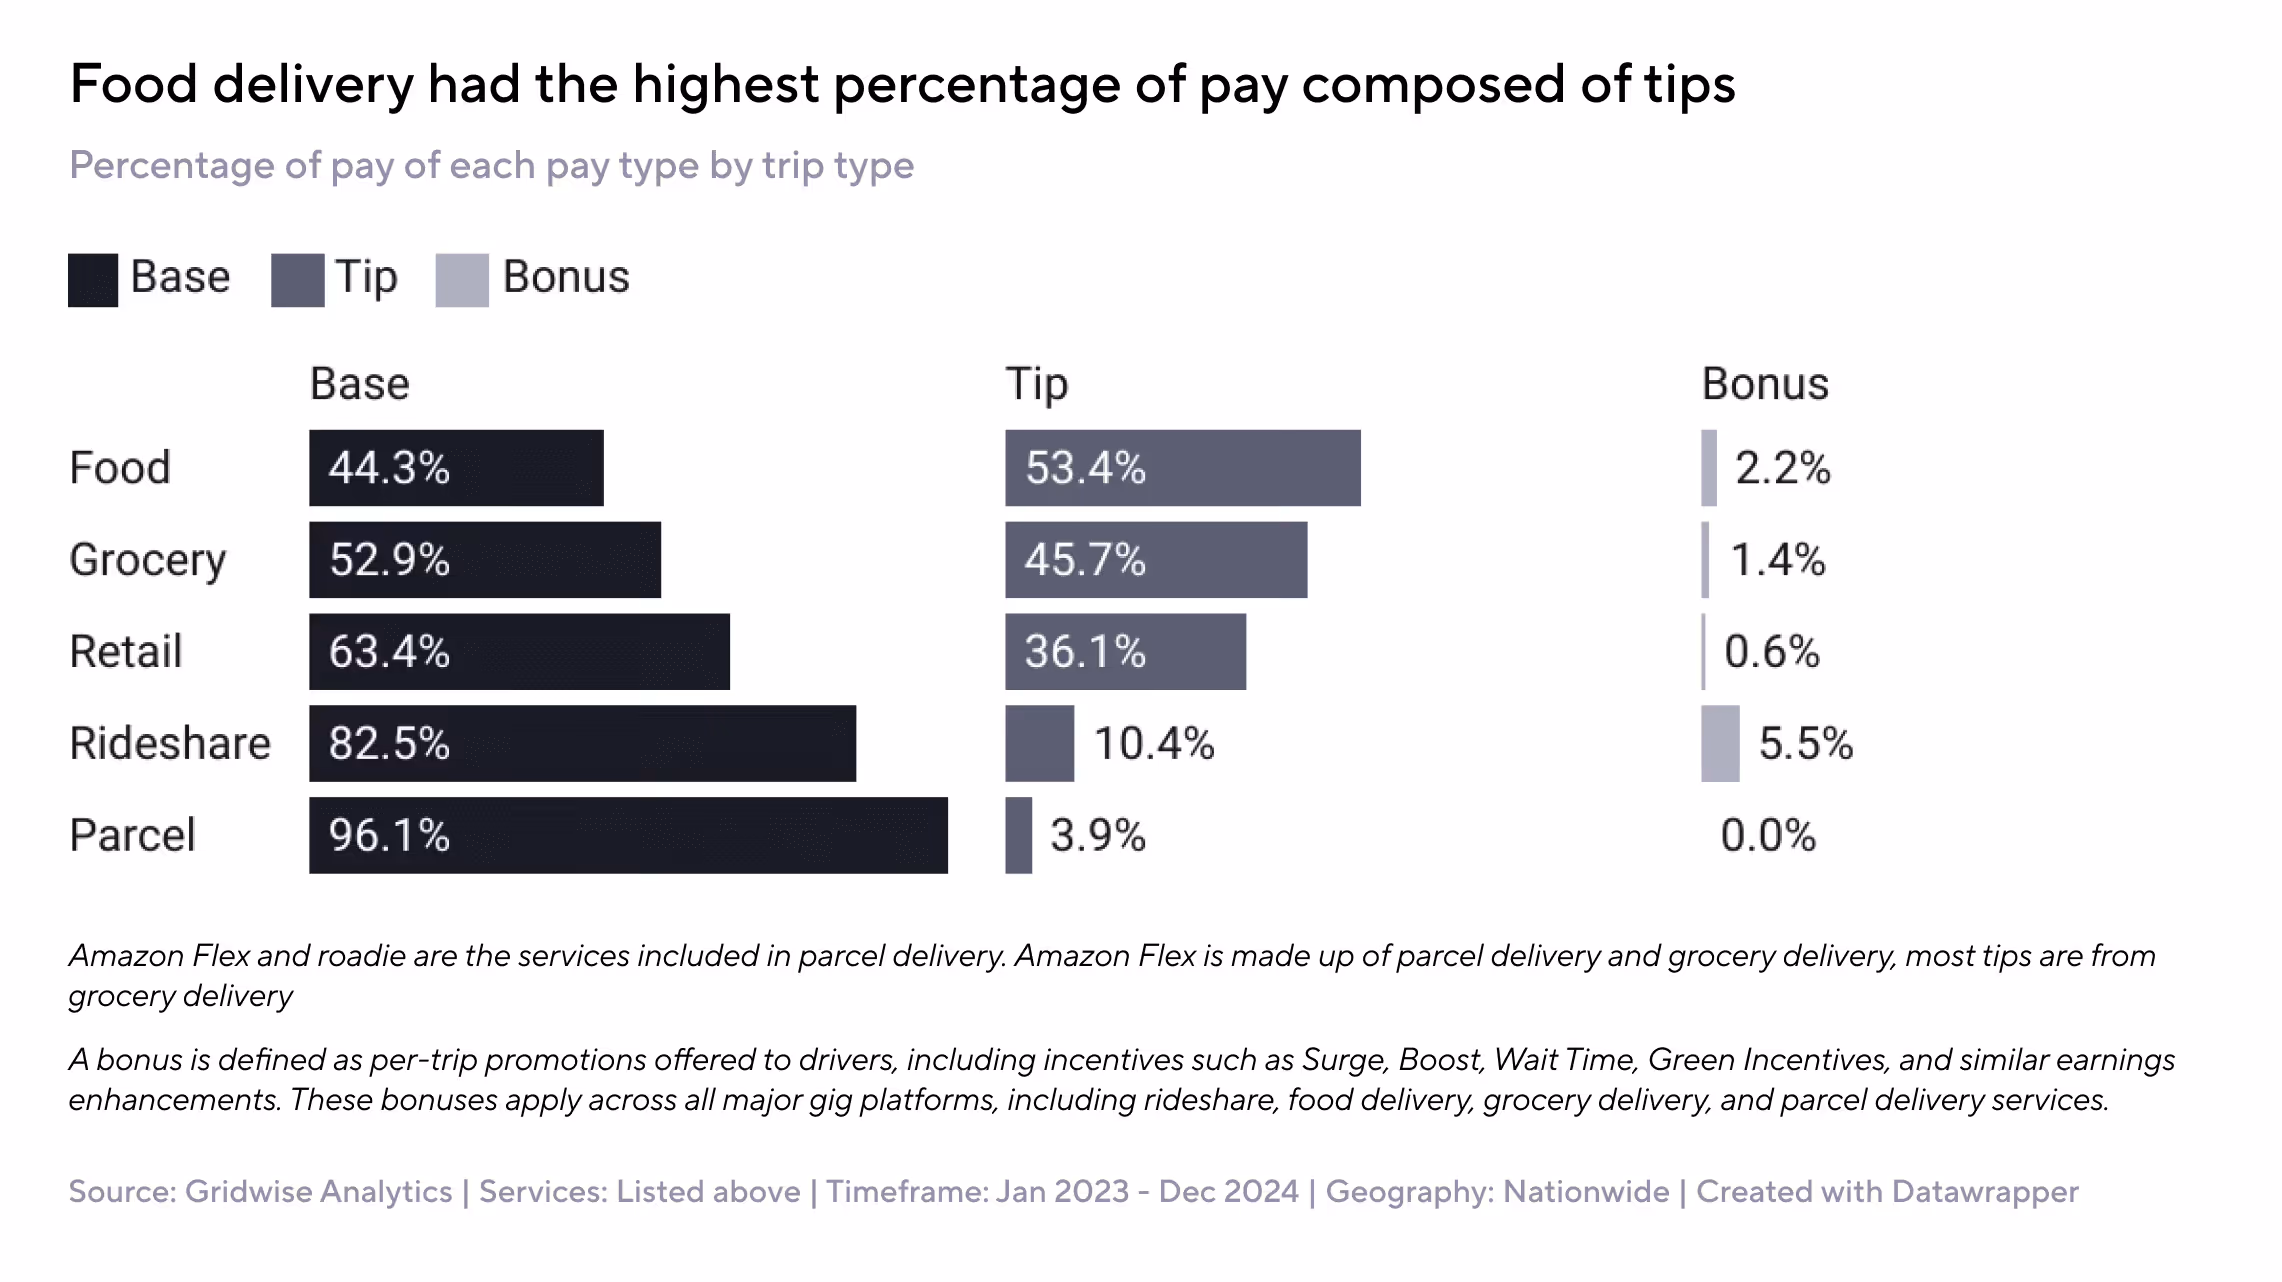
That means rideshare earnings are more sensitive to trip rates and demand levels than other gig types, where tips and bonuses cushion income. It also highlights the risk of relying too heavily on bonuses — a strategy that can work temporarily but isn’t a structural fix.
Only a trip-level dataset like Gridwise’s can uncover this mapping of how much drivers earn and what they’re earning it from.
Riders are loyal to price and pickup time — not app experience or branding
Gridwise’s 2025 rider survey showed that 55.8% of users chose their rideshare app based on lower prices, and 49.7% based on faster pickup times. Promotions and app features mattered far less.
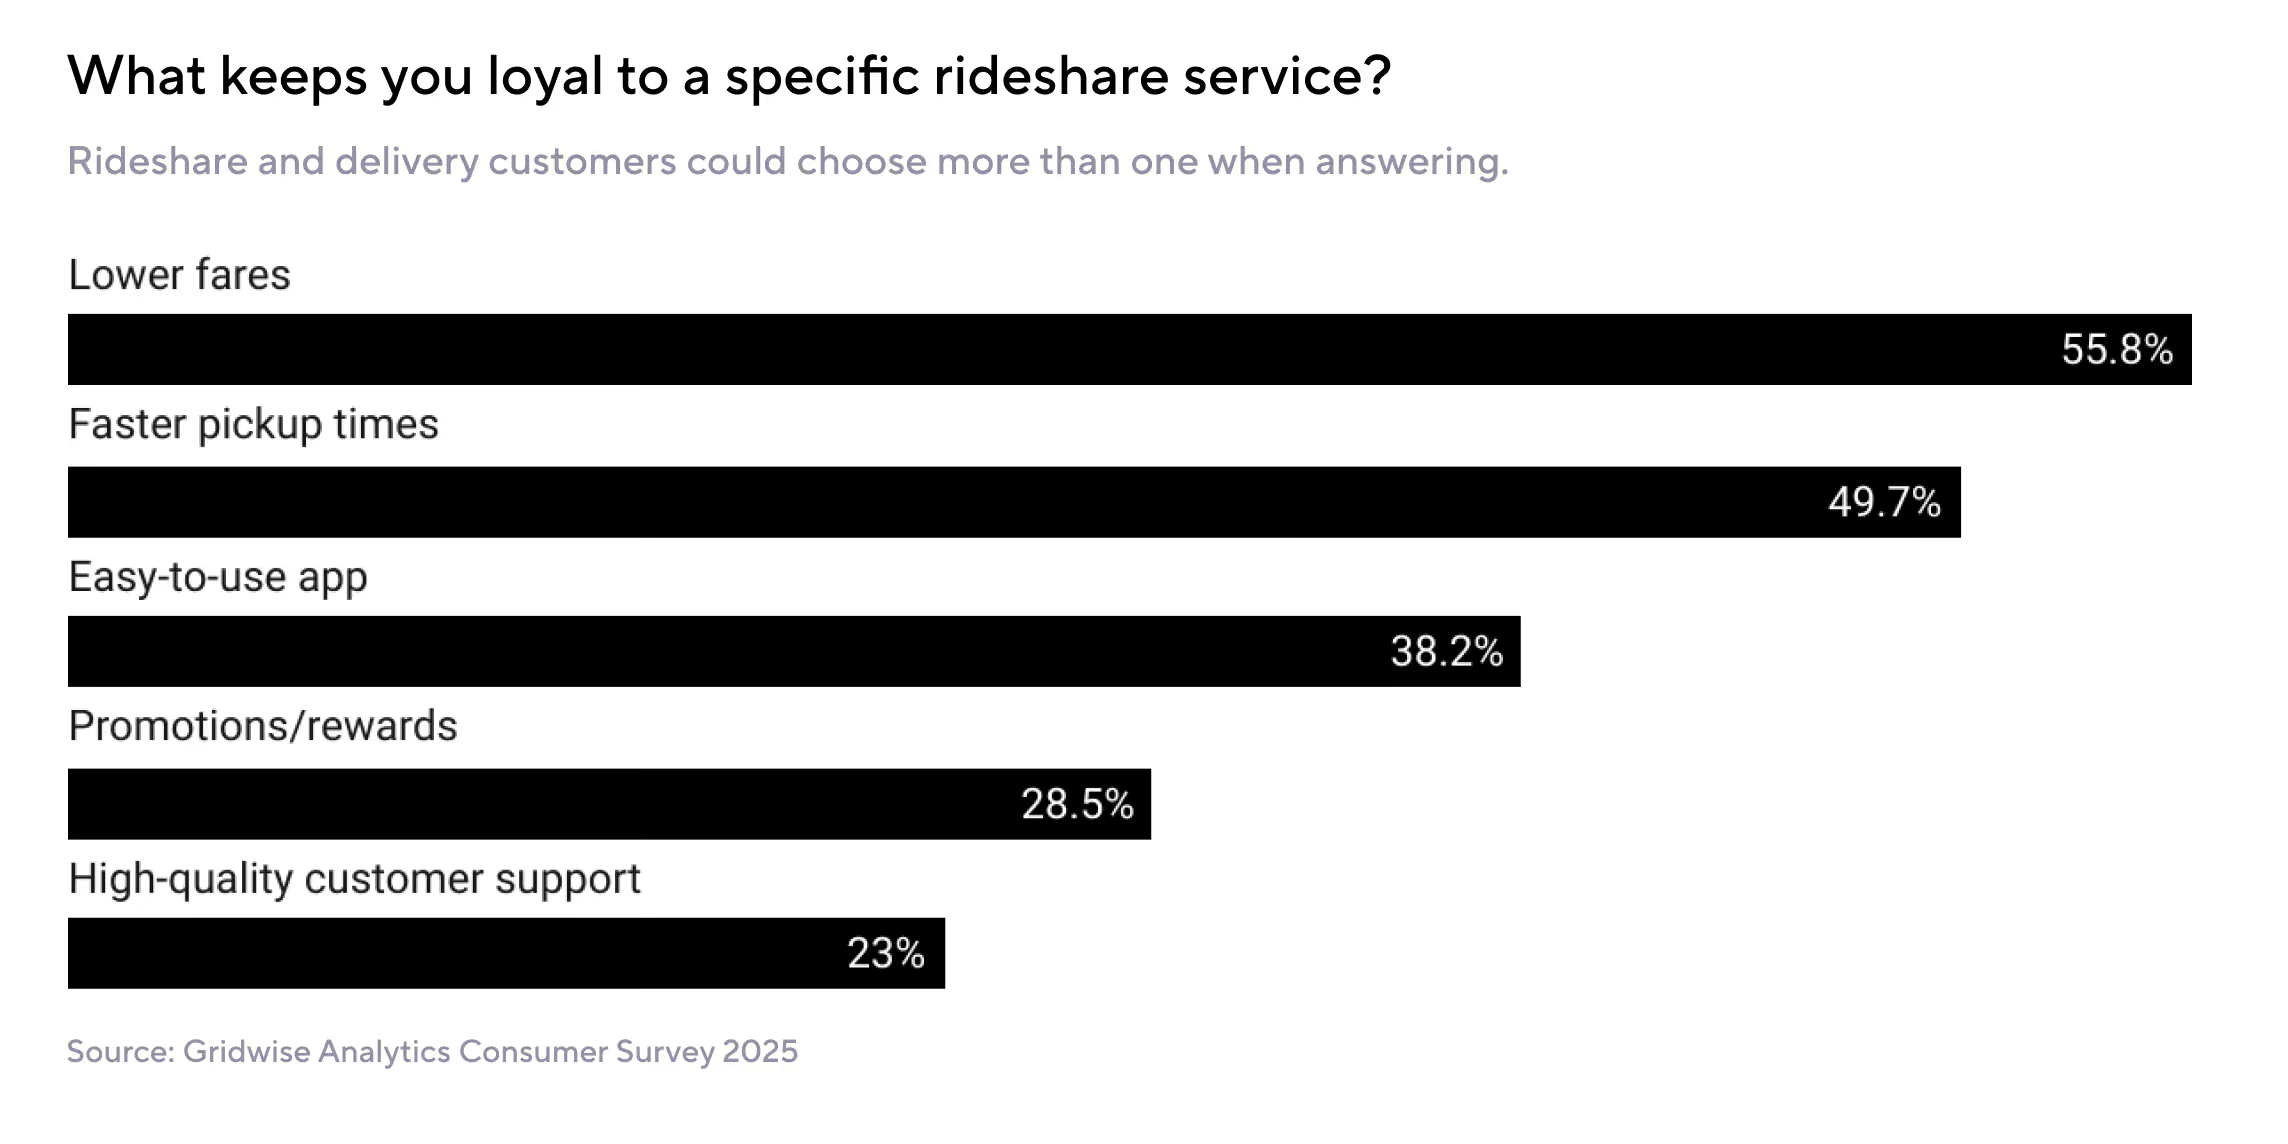
This underscores that performance, not perception, drives retention. It also creates a more straightforward path for automation: AV fleets that lower cost and reduce wait time can capture rider loyalty, even without deep consumer brand investment.
Riders are price-sensitive — and already adjusting behavior
Over 72% of riders said they would reduce or stop using rideshare if prices increased. More than half already used it less in 2024 due to cost.
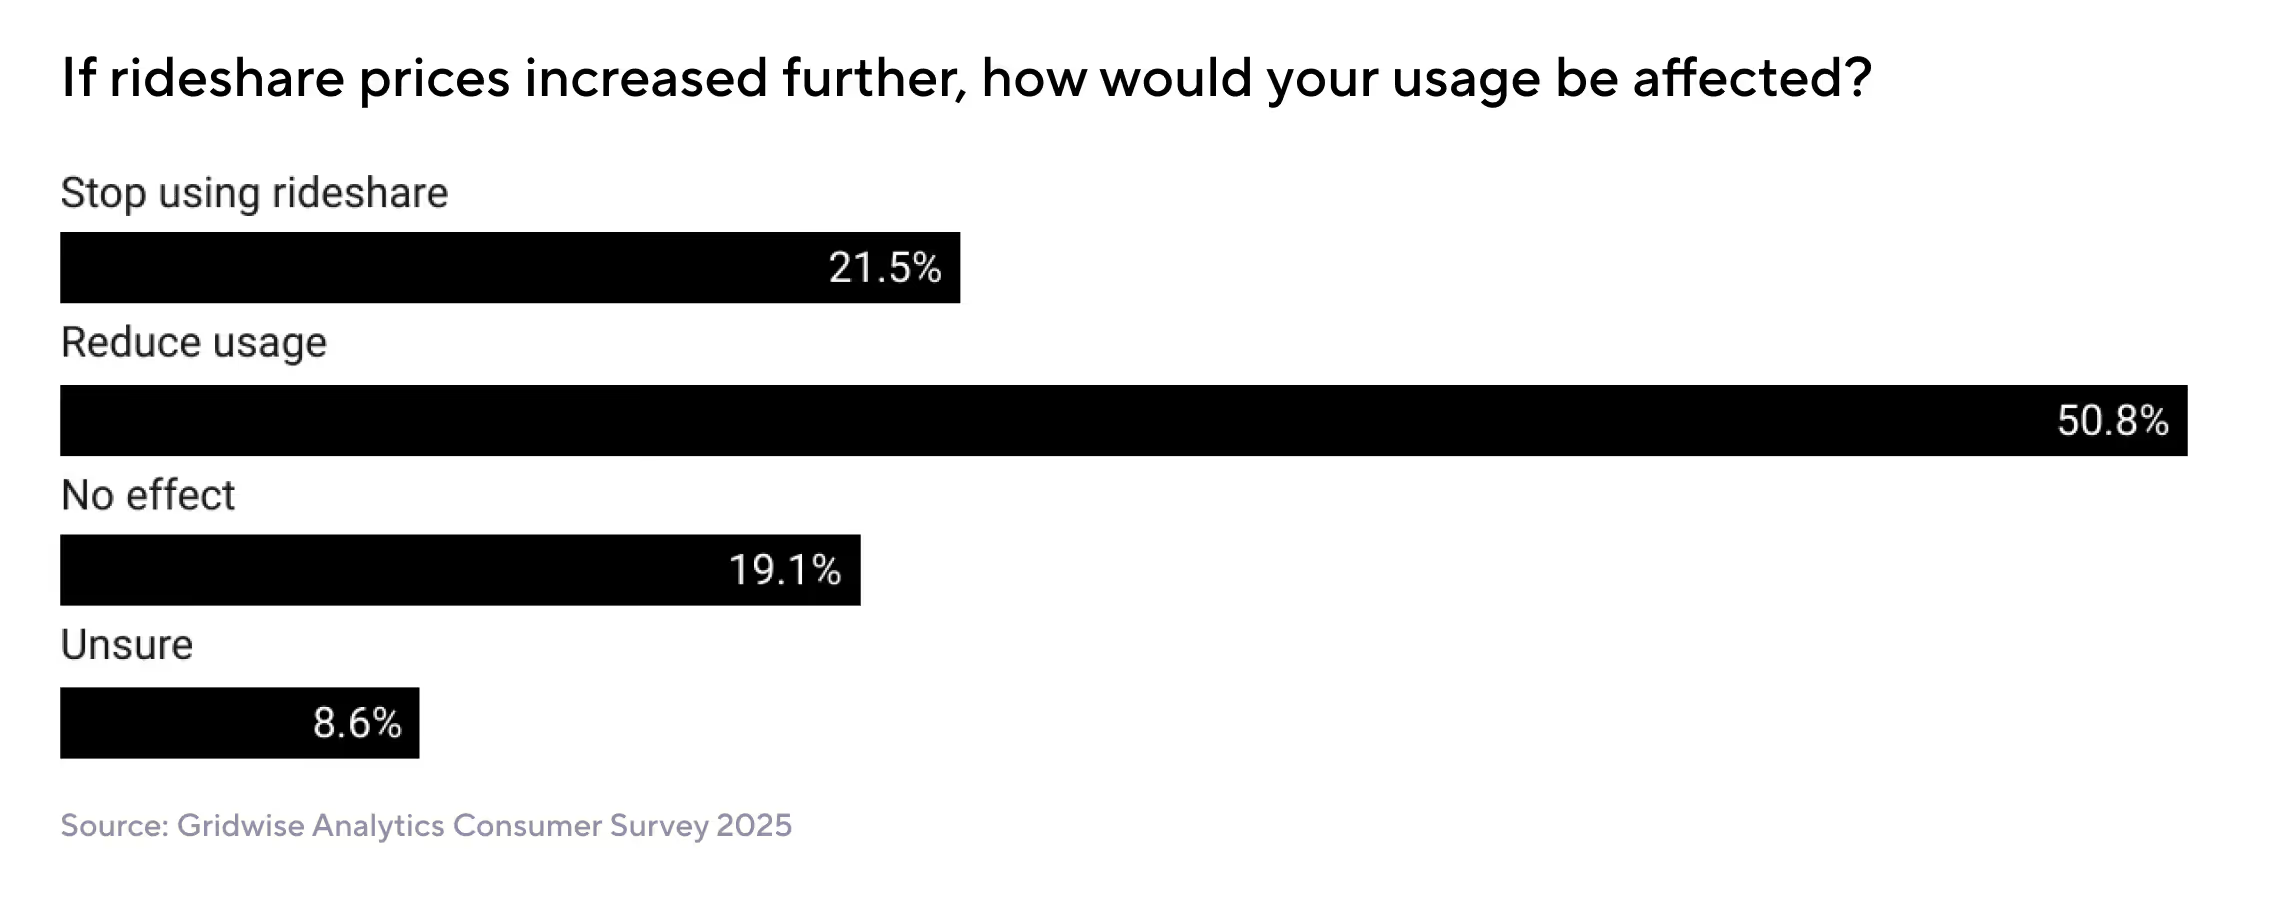
This is a clear signal: pricing power is limited.
Prices rose 7% in 2024 — despite rider sensitivity
According to Gridwise fare tracking, Lyft's average trip cost (including tips) rose from $19.88 to $21.28 — a 7% increase. Median fares (excluding tips) increased similarly.
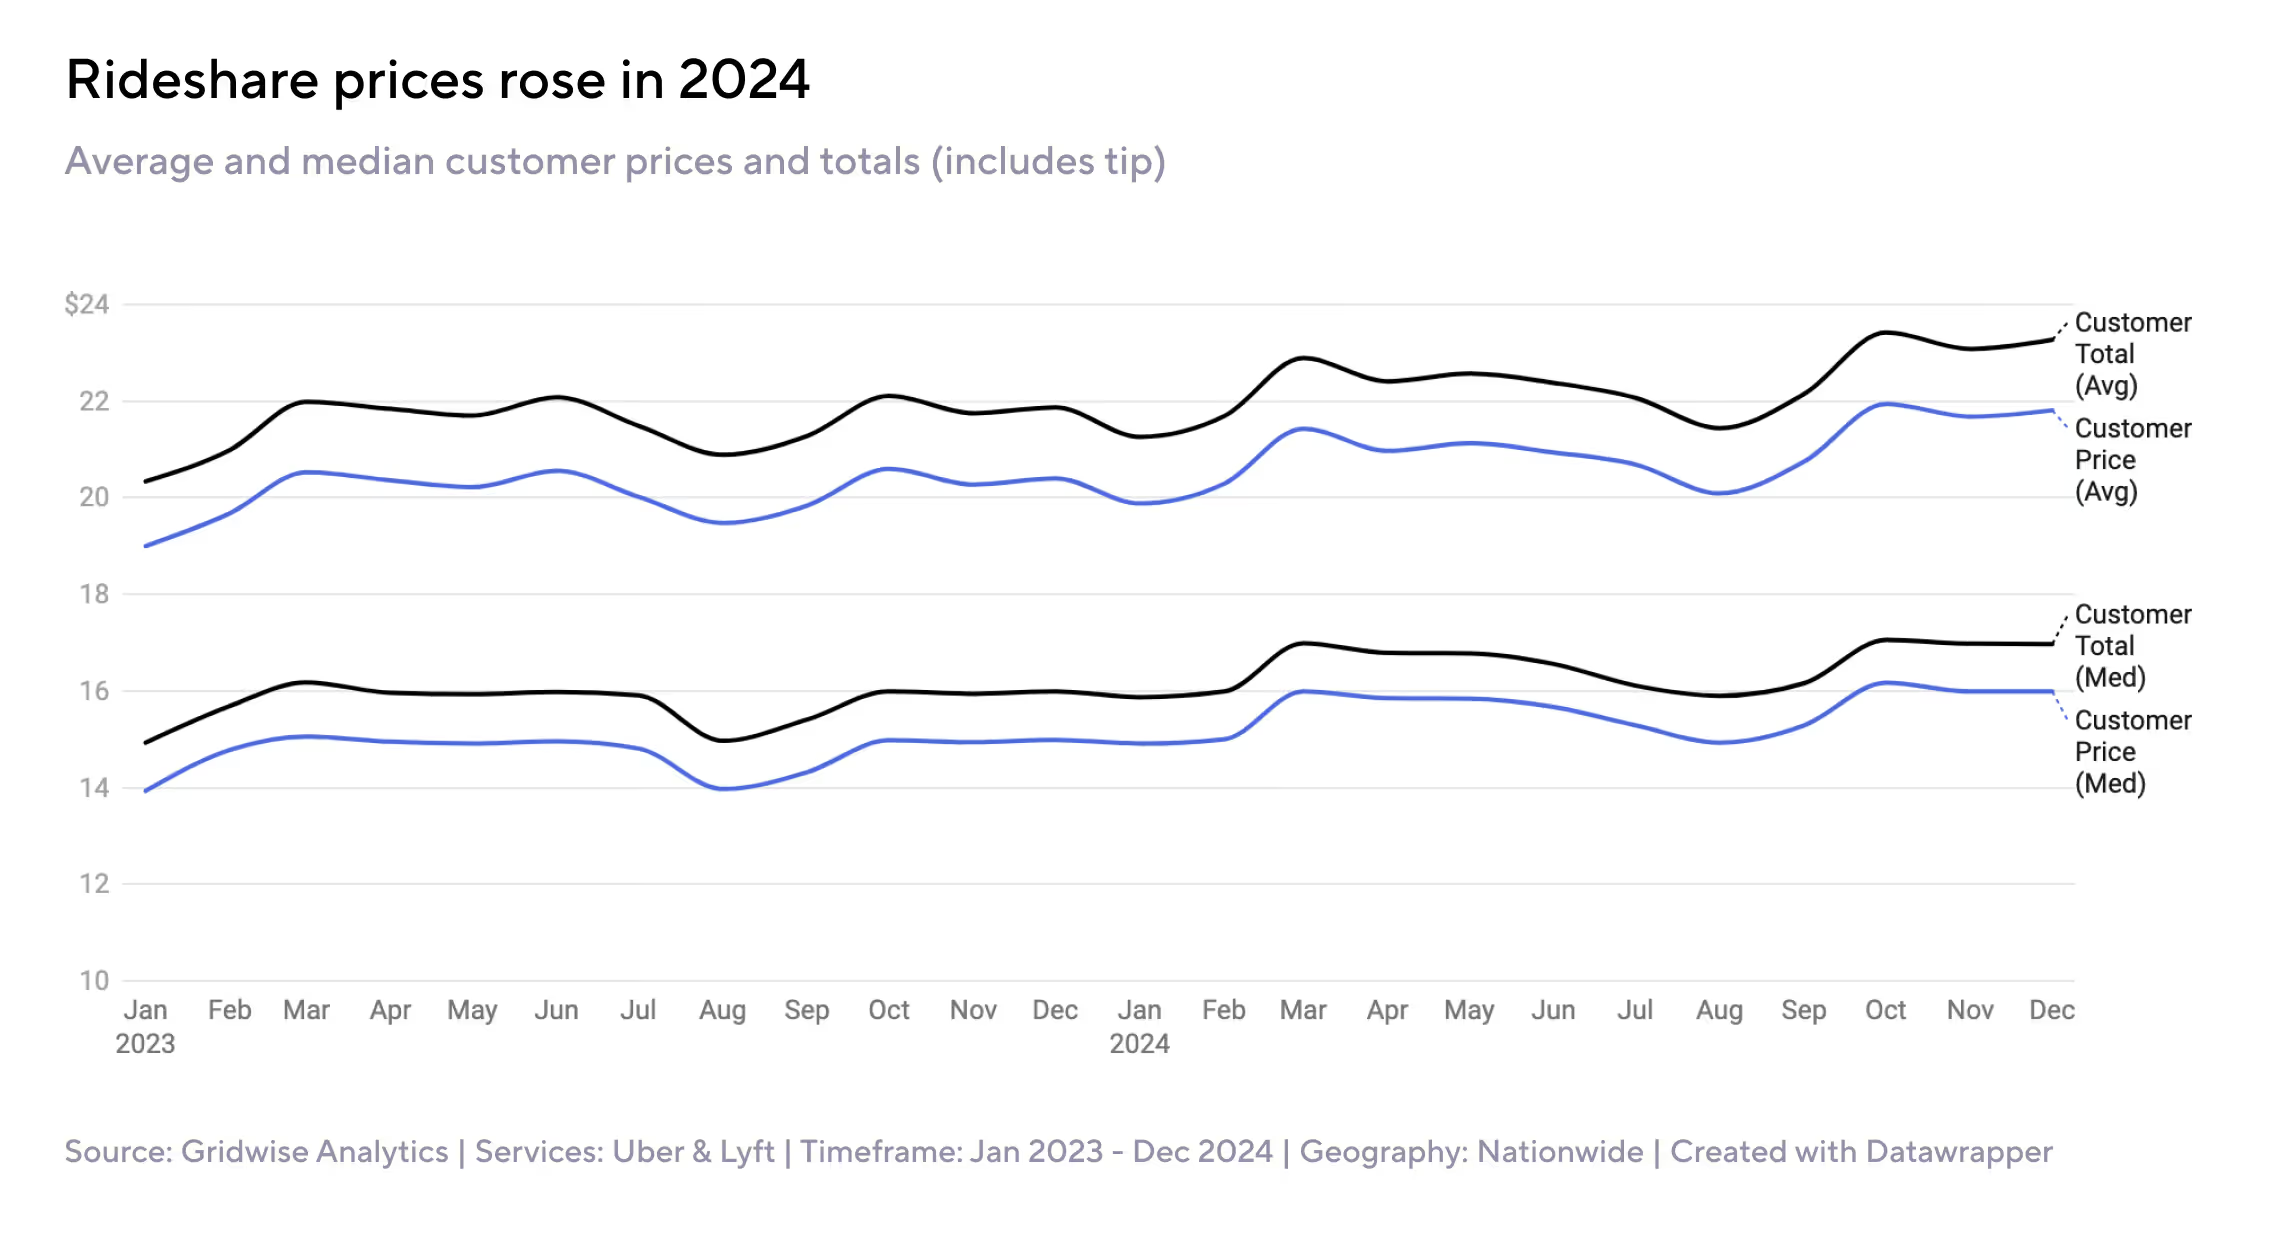
This kind of movement is modest but meaningful in a category with tight price ceilings. For fleet operators or AV entrants, it's a reminder that new models must deliver cost advantages, not just technology.
Driver engagement stayed stable — even with shifting pay
Rideshare drivers averaged 65.6 monthly hours in Q4 2024 — up slightly from 62.9 in Q1. That 4.4% increase stands out against other gig sectors like food or parcel delivery, where engagement dropped more significantly.

This suggests that despite lower weekly pay, Lyft maintained a core of active, committed drivers. It also reflects that the platform’s incentive structure — though more variable — kept the wheels turning.
That kind of insight helps assess not just what the platform pays, but how sustainable the network is.
Final Takeaway: Gridwise data reveals what platform-level reporting can’t
Lyft reported record revenue and its first full-year GAAP profit in 2024. But Gridwise data shows how those outcomes were achieved: concentrating demand among fewer drivers, lowering base pay, and increasing reliance on bonuses. At the same time, prices crept up, and riders grew more cost-sensitive.
For investors, that means Lyft is tightening — not scaling. For AV and mobility infrastructure companies, it shows a platform becoming more flexible in filling supply and potentially more open to new models that reduce idle time, lower cost, or expand fleet coverage.
Most importantly, this view wouldn’t be visible in company filings alone. Gridwise driver data shows what’s happening between the lines — how platform strategy plays out in shifts to earnings, engagement, and usage on the ground.
That kind of visibility is no longer optional — it’s essential for understanding the next phase of rideshare.
Share article:
Related posts
Thanksgiving Dilemma: Should Gig Drivers Hit the Road?
As Thanksgiving 2025 approaches, many gig drivers are asking a familiar question: Is it worth working during the holiday?
Last year’s discussions across Reddit and driver communities were divided. Some drivers described slow days and low pay, while others saw strong post-holiday surges that made the week worthwhile. The data from Gridwise’s 2024 reports paints a clearer picture — one that shows both the challenges and opportunities of the season.
Whether you drive for Uber, Lyft, DoorDash, or Instacart, understanding what happened in 2024 can help you make smarter choices this year.
[elementor-template id="20891"]
Initial Concerns and the Thanksgiving Dip
In the days leading up to Thanksgiving 2024, drivers across forums and social groups voiced familiar frustrations: long waits, slow evenings, and the sense that the holiday week wouldn’t be worth the time on the road. While those experiences were real, the nationwide averages from 2024 show a more steady picture.
Trip pay for both Uber and Lyft stayed almost unchanged during Thanksgiving week. Lyft held level, and Uber saw only a slight dip before returning to a similar range the following week.
Nationwide Average Trip Pay (All Trips)
(Rideshare Pulse – Trip Pay, Nationwide)
PlatformNov 11–17, 2024Nov 18–24, 2024 (Thanksgiving Week)Nov 25–Dec 1, 2024 (Post-Thanksgiving)% Change (11→18)% Change (18→25)Lyft$12.41$12.42$12.53+0.08%+0.89%Uber$14.49$14.43$14.56–0.41%+0.90%
Source: Gridwise
These small national shifts don’t always reflect what drivers feel on the ground. Any slowdown often comes from changes in routine—travel beginning earlier in the week, restaurants adjusting hours, and households planning meals at home. These patterns can make several days feel quieter even when nationwide averages remain stable.
Because markets behave differently, the most reliable way to understand Thanksgiving week in your area is by checking your own past trends inside the Gridwise App. Your November 2024 driving patterns—by app, by day, and by time of day—offer the clearest insight into how your city responds to the holiday.
The Post-Thanksgiving Surge
After a quieter Thanksgiving Day, many drivers hope for a strong rebound heading into the weekend. Nationwide averages from 2024 show a modest lift in trip pay the week after the holiday, with both Uber and Lyft increasing slightly from Thanksgiving week levels.
Lyft’s nationwide average rose by just under one percent, and Uber’s followed a similar pattern. While not dramatic at the national level, some cities experienced more noticeable shifts tied to return travel, shopping traffic, and people easing back into their routines.
Nationwide Average Trip Pay
(Rideshare Pulse – Trip Pay, Nationwide 2024)
PlatformThanksgiving Week (Nov 18–24)Post-Thanksgiving (Nov 25–Dec 1)% ChangeLyft$12.42$12.53+0.89%Uber$14.43$14.56+0.90%
Source: Gridwise
While these national changes were small, they don’t capture the differences drivers felt within their own cities. Markets with busy airports or active commercial districts often saw stronger post-holiday momentum than those with more subdued travel patterns.
Checking your own Thanksgiving weekend performance inside Gridwise—by app and by time of day—can help you determine whether the weekend after the holiday is typically worthwhile in your area.
[elementor-template id="20949"]
Why Thanksgiving Feels Different for rideshare drivers
Thanksgiving week often feels unpredictable, and rideshare drivers aren’t imagining it. Several factors explain why Thanksgiving week looks like a “valley” in gig earnings data:
- Travel and Family Gatherings: Many people leave town or stay home, reducing local demand.
- Home Cooking: Food Delivery Orders Dip as More Families Prepare Meals at Home
- Business Closures: Fewer rides to offices, bars, and events during the holiday itself.
Equally predictable trends drive the recovery:
- Black Friday and Cyber Monday shopping boost deliveries and trips.
- Return travel fills airport routes again.
- Post-holiday fatigue drives more food delivery orders.
What stands out is that Thanksgiving doesn’t dramatically reshape nationwide trip pay—it simply shifts demand throughout the week. Because each city behaves differently, looking at your own driving patterns in Gridwise is the best way to understand how Thanksgiving typically plays out in your specific market.
Platform-Specific Resilience
While many drivers felt the effects of a slower Thanksgiving week, the nationwide averages for Lyft and Uber showed only small changes. Lyft remained almost flat throughout the week, and Uber dipped slightly before returning to a similar range the following week. These minimal shifts suggest that the holiday’s impact varies more by city and driver behavior than by platform.
In some markets, rideshare demand held steady thanks to early-week airport traffic or weekend shopping activity. In others, Thanksgiving Day brought a more noticeable slowdown. Delivery services also varied from place to place, depending on local dining habits and how quickly households returned to normal routines.
Because these patterns aren’t consistent across regions, it’s helpful to look back at how each platform performed for you last year. Using Gridwise to compare your Lyft and Uber activity from Thanksgiving 2024 can offer clearer guidance on where to focus your time during the holiday week in 2025.
Thanksgiving 2023: A Tale of Resilience in the Gig Economy
Looking back at Thanksgiving 2023 helps put last year’s patterns into perspective. Driver conversations that year echoed many of the same concerns—slower days, uneven demand, and uncertainty about whether working through the holiday was worthwhile. Yet, just as we saw in 2024, the period surrounding Thanksgiving showed signs of stability and recovery once the holiday passed.
Rideshare drivers who approached the week with flexibility often found ways to make it work, whether by leaning into early-week travel demand, focusing on delivery in specific neighborhoods, or returning to the road once activity picked back up over the weekend. The broader lesson from both 2023 and 2024 is that Thanksgiving tends to reshape the rhythm of the week rather than dramatically shift earnings overall.
The rideshare drivers who benefited most were those who understood how their market behaved—recognizing when activity typically slowed, when it returned, and which services held up better in their area. That same approach remains useful heading into Thanksgiving 2025.
How to Plan Your Thanksgiving 2025 Strategy
Every driver’s experience during Thanksgiving week is different — what works in one city or on one platform may look completely different somewhere else. Still, looking at how Thanksgiving 2024 unfolded reveals a few consistent patterns that can help guide your approach this year. These can serve as a starting point for building a strategy that fits your habits, location, and preferred services.
StrategyWhy It Often WorksHow to Personalize ItWork Earlier in the Week (Mon–Wed)Travel activity often picks up before Thanksgiving as people head out of town.Check Gridwise trends for your local airport to see when outbound traffic is strongest.Take Thanksgiving Day Easy — or Stay FlexibleMany markets see reduced ride and delivery volume on the holiday itself.If you stay online, use Gridwise’s real-time demand view to identify areas with bonuses or steady activity.Prioritize the Weekend (Fri–Sun)Return travel and holiday shopping can create more consistent opportunities.Review your past Thanksgiving weekend in Gridwise to see which platforms performed best in your area.Use More Than One AppFlexibility can help you adjust as demand shifts across services.Compare how each app behaves in your city throughout the week using your Gridwise history.Know Your Own PatternsUnderstanding your typical earnings and trip rhythm gives you better expectations.Use your Gridwise reports to see how your Thanksgiving 2024 results compared with your normal weeks.
Source: Gridwise
While these patterns offer helpful context, the best strategy will always depend on your driving style and your city. Some markets tend to favor rideshare early in the week, while others rely more on delivery or return-travel demand after the holiday. By combining national context with your personal insights, you can design a Thanksgiving plan that’s informed and realistic for how you drive.
Key Takeaways
- Thanksgiving week can feel slower, but nationwide trip pay stayed fairly steady last year.
- The days following the holiday often bring more activity, especially in markets with strong return travel or shopping patterns.
- Using more than one app can help you adjust when demand shifts across services.
- Reviewing your own trends in Gridwise is the best way to understand how your city typically behaves during the holiday week.
[elementor-template id="20936"]

Uber vs Lyft Pay in 2026: Which Pays More for Premium Rides?
If you drive a vehicle that qualifies for Comfort or Black rides, you’ve probably wondered which platform, Uber or Lyft, will help you earn the most. These higher-end ride options come with premium fares and a more selective passenger base, which can significantly impact your overall earnings.
Recent Gridwise insights show a clear pattern: Uber drivers tend to earn more on Comfort and Black rides than Lyft drivers do. The gap is particularly high in the higher-tier ride categories, where Uber’s pricing structure and rider demand provide drivers with more consistent access to profitable trips.
For those with eligible vehicles, these findings suggest that Uber’s premium ride tiers may currently offer greater earning potential and steadier demand than Lyft’s.
[elementor-template id="20891"]
Why Compare Uber and Lyft Comfort/Black Payouts?
Comfort and Black rides pay more than standard trips, but they also attract a different type of passenger and require vehicles that meet specific standards. Many drivers buy or lease higher-end cars with these premium categories in mind, knowing they can open the door to better earnings opportunities.
If you’ve made that kind of investment, it makes sense to understand where your time brings the best return. Comparing Uber and Lyft payouts helps you decide which app deserves more of your focus, especially since both companies regularly adjust pricing, incentives, and market strategies.
When you understand how these payouts differ, you can make informed decisions about which trips fit your goals and how to get the most from the vehicle you’ve worked hard to qualify.
Vehicle Requirements: Are They the Same?
For Comfort and Black rides, Uber and Lyft set very similar standards for the vehicles that qualify. Both platforms prioritize newer cars with high-quality interiors and extra passenger comforts, such as additional legroom, smooth rides, and premium finishes.
Comfort rides usually include mid-sized sedans or SUVs that are only a few model years old and consistently receive high passenger ratings. These cars are meant to offer a quieter, more comfortable ride without being full luxury vehicles.
Black rides are in a different class. They require luxury models with black exteriors and interiors, as well as drivers who maintain a professional appearance and provide a higher level of service. These trips often appeal to business travelers and passengers who expect a top-tier experience.
If your car qualifies for Uber Comfort or Black, it almost always meets Lyft’s requirements for the same categories. In other words, the type of vehicle you drive probably won’t limit your earning potential on either platform. The real difference comes down to how each company structures its pay and how demand for premium rides varies in your market.
4. Uber vs Lyft: 2024 vs 2025 Earnings Comparison
The table below shows what we found after analyzing pay from both platforms. These averages represent total gross earnings per trip, including all rider payments, for Uber and Lyft Comfort and Black rides throughout 2024 and into 2025.
While both platforms saw fluctuations throughout the year, the overall trend is clear: Uber drivers consistently earned more per trip than Lyft drivers across the Comfort and Black tiers. The gap is especially noticeable in the higher-end ride types, where Uber’s pricing model and passenger demand helped boost payouts.
Lyft drivers still performed well in some areas, particularly during seasonal peaks, but Uber’s stronger, more consistent earnings suggest it has an edge in the premium market right now.
For drivers who already qualify for these higher-tier categories, this can be an essential factor when deciding where to focus their time.
Average gross pay per ride in Q3, 2024 vs 2025 (Uber vs Lyft).
Ride TypeQ3 2024 LyftQ3 2024 UberQ3 2025 LyftQ3 2025 UberStandard$12.09$12.75$11.95$13.01Comfort$20.00$21.61$20.48$21.30Black$31.75$39.47$28.96$39.08
Driver Observations and Feedback
Many drivers have shared consistent observations about Uber’s premium ride tiers. Their firsthand insights help explain how Comfort and Black influence ride volume, fare consistency, and overall earning potential.
Uber Comfort: Higher Fares, Lower Volume
Uber Comfort offers riders newer vehicles with extra legroom and quieter experiences. For drivers, the category introduces a modest pay premium but often less consistent demand. As The Rideshare Guy notes:
“Per trip, you’ll earn more doing Uber Comfort but there is not enough demand for you to do only Uber Comfort rides.” — The Rideshare Guy
Drivers echo this trade-off in various discussions. While Comfort trips typically pay about 20 percent more than UberX rides, that higher fare is offset by fewer requests — particularly outside major metro centers.
Similarly, Ridester underscores the need for a newer vehicle and a high driver rating to qualify, both of which raise the cost of entry:
“Comfort pays higher fares than standard Uber rides, but you’ll need a newer car, a 4.85 rating or higher, and excellent passenger reviews.” — Ridester
Key takeaway: Comfort can yield better per-trip earnings, but drivers often maintain UberX access to fill downtime and stabilize income.
Uber Black: Premium Pay, Premium Costs
At the top of Uber’s service tiers, Uber Black continues to attract experienced drivers seeking higher fares and professional clientele. Yet drivers consistently highlight the steep costs and fluctuating demand that accompany this category.
“I’ve been driving for Uber Black for about two years now. On a good week, I can make upwards of $1,500. However, I also spend more on maintenance and gas for my SUV.” — Michael, Los Angeles (Apps UK)
“The tips are definitely better with Uber Black. I’ve had passengers tip me as much as $50 for a single ride. But there are also slow days where I barely make anything.” — Sophia, Chicago (Apps UK)
Driver income reports show a broad range: $60,000 to $120,000 in gross annual revenue, depending on market size and vehicle type (TinyGrab). However, Ridesharing Driver emphasizes that operating expenses — from insurance and licensing to downtime between premium rides — can sharply reduce net profits (Ridesharing Driver).
Key takeaway: Uber Black can deliver strong earnings and generous tips, but the higher overhead means profitability hinges on efficient scheduling, location strategy, and cost control.
Strategic Insights for Drivers Considering Premium Categories
Across both Comfort and Black, consistent themes emerge from driver experiences and Gridwise performance data.
1. Understand your market dynamics. Premium ride categories perform best in areas with strong business travel, active airports, and event-driven demand. Recognizing these patterns allows drivers to plan hours more strategically.
2. Measure true profitability. Higher gross fares don’t always translate to higher take-home pay. Premium vehicles and commercial insurance raise expenses, widening the gap between gross and net income.
3. Maintain a flexible mix of ride types. Many drivers find that combining Comfort or Black rides with standard requests helps stabilize revenue during slower premium periods.
4. Prioritize service quality. Professionalism, vehicle presentation, and passenger comfort often lead to stronger tips and repeat riders.
5. Rely on local performance insights. Gridwise data pinpoints when and where premium categories generate the highest returns, enabling smarter driving schedules and market targeting.
Success in premium tiers depends not just on earning potential but also on strategic planning that understands when, where, and how to make those higher fares truly pay off.
How Gridwise Helps You Earn More on Comfort and Black Rides
Driving a high-end vehicle gives you access to premium rides—but knowing when and where to drive can make an even bigger difference in your bottom line. That’s where Gridwise comes in.
[elementor-template id="20949"]
Here’s how Gridwise helps you drive smarter:
- Know exactly when and where to work. Get personalized insights that pinpoint your city’s busiest hours and neighborhoods so you can plan shifts around real demand.
- See which app pays better right now. Compare your Uber and Lyft earnings side by side to understand which platform gives you more substantial returns in your specific market.
- Track your actual performance. Monitor your hourly and per-ride averages to spot trends, adjust your schedule, and make each shift more efficient.
- Understand your real profit. Log mileage and expenses automatically so you always know what you’re actually taking home after costs.
These data-driven insights take the guesswork out of driving, helping you plan smarter routes, reduce downtime, and increase your overall earnings efficiency.
Gridwise shows your Uber vs. Lyft averages side by side, so you can see whether your own results match national trends.
Pro tip: Drivers who regularly use Gridwise’s data insights tend to earn significantly more per hour than those who rely on trial and error.
The Point?
For drivers with vehicles that qualify for Comfort or Black rides, Uber currently provides the stronger earning potential. The gap between Uber and Lyft widened slightly from 2024 to 2025, showing that Uber’s premium ride categories continue to deliver better returns for most drivers.
Still, the platform you choose is only part of the equation. What really determines your results is how you work. Understanding when demand peaks, where high-value trips start, and how your city’s ride patterns change over time can make all the difference in your weekly totals.
[elementor-template id="20936"]
More resources for drivers

The Halloween Gig Driving Guide
The gig driving guide that all drivers need for halloween!
Halloween gig driving can be lots of fun, and it’s also a great time for gig drivers to make more money. With haunting going on for several days at a stretch, parties, parades, and other events will attract lots of business for rideshare and delivery drivers alike. You can probably go out as usual and still make a little more than you normally do, but why settle for that?
In this post, we’ll tell you how to make Halloween gig driving as rewarding as it is fun. We’ll talk safety, strategy, and how to earn bigger tips.
Rideshare earnings over Halloween
Last year, when Halloween landed on a Thursday (2024), rideshare drivers saw a strong jump in earnings.
Compared with typical October weeks, earnings were 3.5% higher the week before Halloween and 7% higher during Halloween week.
On Halloween night itself (Thursday, Oct 31, 2024), hourly pay surged +14% compared to a typical Thursday in October, as riders traveled to and from parties and events.
This year’s Friday Halloween means those same surges could extend through Friday night, Saturday, and even Sunday morning, potentially boosting weekend earnings by 10–15%.
Source: Gridwise
2024’s Halloween fell on a Thursday, creating a perfect setup for extended weekend activity — giving drivers more opportunity to earn from October 31 through November 3. The data shows that rideshare drivers benefited significantly from party and event-related travel, with a strong +7% week-over-week gain.
Rideshare earnings over Halloween
Delivery drivers also saw solid seasonal growth last year — +3.5% the week before Halloween and +6.8% overall during Halloween week.
On Halloween night (Thursday, Oct 31, 2024), delivery earnings per hour jumped +12% compared to a typical Thursday, as customers ordered food and supplies for parties and gatherings.
With the holiday on a Friday this year, deliveries may peak later into the evening and continue through the weekend.
Getting in on the fun–and money–with Lyft or Uber on Halloween
From parents who want to keep their small ones dry and safe on the way to school events to hardcore party people who dive into the Halloween holiday spirit headfirst, you’ll come across many passengers during this super busy week.
Since so many will be super excited about this spooky season, the way you approach your halloween gig driving could make your customers extra generous and appreciative. Here are a few pieces of sound Lyft and Uber driver advice:
- Remain professional. Always greet your passengers as you would at any other time, and stay away from getting overly dramatic about acting like a scary zombie, axe murderer, or vampire, especially with young kids in the car.
- Offer treats. Even jaded business travelers on the way to the airport might enjoy a sweet Halloween treat. Put a smile on passengers’ faces by ensuring your offerings are in their original wrappings so they can feel safe eating them. You might want to offer bottled water, too. Super-high doses of sugar can make all goblins, big and small, mighty thirsty.
- Present your Halloween playlist. You’ll want to do this carefully, of course, but a subtly crafted sequence of songs appropriate to the season will make you stand out with your passengers, who’ll just have to tip you for your great musical taste.
- Decorate your car. A temporary Halloween wrap for the exterior or some subtle orange and white lights on the interior could make yours the car they all want to be in when they celebrate their Lyft or Uber Halloween holiday.
- Brush up on customer service skills and keep them in mind no matter what Halloween horrors you might encounter. This post from Gridwise will help.
- Check in with your company for further tips, tricks, and features you can use to make Halloween safe and profitable. Uber offers Halloween tips for drivers here, and you’ll find advice from Lyft for Halloween driving in this article on their website.
Costume and car safety tips on Halloween
Halloween costumes can be a fun way to get into the holiday spirit, but as a gig driver, safety must come first—both for you and your passengers.
- Dress up with discernment. If you decide to dress up, keep it to common-sense costume choices. Make sure your face is recognizable, and avoid makeup, clothing, or props that make seeing clearly or moving freely while driving difficult. If you don’t want to get too wildly creative, you can always assemble a Halloween costume for a Lyft or Uber driver! Slap a sign on your chest that says “Scary good driver,” and you’ll be good to go. (More tips below!)
- Costume Considerations for Safety: Avoid masks or large headpieces that block your view, and make sure your costume doesn’t interfere with the operation of your vehicle. Simple, easy-to-wear costumes like themed hats or shirts are great options. And don’t forget—your costume should still allow you to present yourself professionally to customers.
- Car Safety and Decorations: Decorating your car can add to the fun, but it’s important not to overdo it. If you’re putting up Halloween lights or adding decor inside your vehicle, ensure that none of it obstructs your mirrors, windows, or the operation of the vehicle. Opt for subtle touches like small orange lights or temporary window decals that you can remove easily after Halloween.
Delivery tricks to earn you treats
Is DoorDash busy on Halloween? You bet! People have to eat something besides candy at all those parties and parade pregaming sessions, right? This Reddit thread speaks to opportunities waiting for Halloween delivery drivers.
There’s every reason to expect delivery drivers to have their own kind of Halloween fun, and to profit from it, too. Here are some moves DoorDash, Uber Eats, Instacart, Shipt, and Grubhub drivers can make to share in this fun-filled holiday’s eerie, magical spirit.
- Carry treats for restaurant workers. You might see these people more than once a week, or you might have only one encounter with them ever. In either case, offering them a little something will keep them cheerier and get you better ratings from the restaurant.
- Follow the call of the Halloween spirit. If restaurant workers or customers seem to be celebrating, it’s fine to chime in with a spooky comment or quirky quip. But if it looks like the people you’re dealing with have no idea there’s anything special about this time of year, act like you always do, with friendliness, grace, and professionalism. Read more about how to be a 5-star delivery driver in this Gridwise blog post.
- Tread lightly through backyard Halloween displays. So many people get extremely serious about decorating their yards with blow-up ghosts, gravestones, skeletons, and witches. What’s fun the rest of the day can be downright treacherous for delivery drivers. A headlamp or other means of shining light on what’s underfoot might be called for, so you don’t hurt yourself or destroy a well-thought-out ghoulish (and garish) display. Keep your DoorDash Halloween safe and fun.
Halloween-Specific Customer Service Tips
Halloween gives drivers a unique opportunity to stand out and create a memorable experience for passengers and customers. Excellent customer service is key to higher ratings and bigger tips.
- Boosting Your Ratings: Go the extra mile this Halloween by getting into the spirit with friendly, light conversation about the holiday or complimenting customers on their costumes. Passengers appreciate a driver who engages with them, especially during festive times like Halloween. However, be mindful of your passenger’s mood—if they’re not in the Halloween spirit, it’s best to keep the conversation professional.
- Seasonal Treats for Tips: Offering candy or small, sealed treats to your passengers can earn you great reviews and bigger tips. Just be sure to offer items that are pre-packaged and safe to consume. A thoughtful, themed gesture like this can leave a lasting impression and increase your chances of positive feedback.
By focusing on seasonal customer service, you can turn Halloween into an opportunity for higher earnings through great ratings and tips.
Top Halloween Events in Major Cities for Gig Drivers
Halloween is all about knowing where the action is happening, and as a gig driver, you can position yourself to take full advantage of these high-traffic zones.
- Know the Hotspots: Major cities like New York, Los Angeles, and Chicago host some of the biggest Halloween events. Parades, block parties, and haunted houses all draw large crowds and create high demand for rides. Use Gridwise’s event calendar to track these events and plan your route accordingly. By focusing on areas with heavy foot traffic and event venues, you’ll maximize your earnings from both rideshare and delivery gigs.
- Balancing the Right Zones: Don’t put all your eggs in one basket by sticking solely to high-demand areas. Popular areas will attract a lot of drivers, which could lead to oversaturation. Use Gridwise to analyze traffic patterns and mix it up by also covering nearby neighborhoods where competition is lighter but demand is still solid.
By knowing where the top Halloween events are happening, you can make sure you’re always in the right place at the right time to get the best fares.
Know where to drive and when
Keeping track of events when you’re doing Halloween driving can be tricky. That’s why you’re so lucky to have Gridwise. It’s not just the best mileage tracking app out there. Use the Gridwise events calendar to see where the parades, shows, scare houses, and public parties are happening. Having this info at your fingertips will make it easy to put together a winning Lyft or Uber driving strategy—but Gridwise has even more to offer.
Gridwise features Where to Drive and When to Drive give you real-time data on where drivers are making the most in your neighborhood. Studying the patterns in these features will tip you off as to when the peak passenger and delivery traffic is humming and where to find the most business. With Gridwise, you get all this and a free mileage tracker, too!
Stay safe and keep clean
The truth about Halloween is that it can be fun, but there are hidden dangers and inconveniences you’ll want to beware of. Consider these tips for keeping yourself and your passengers safe, and for preventing damage to your vehicle:
- Identify your passengers and delivery customers. Dress some people in a costume, and they can get downright silly and, sometimes, even dangerous. Don’t be shy about asking a passenger who appears somewhat sketchy to remove their mask, so you can make sure you’re picking up the right person. Same goes for delivery. The word “trick” is very popular this time of year, and there could be a masked imposter hoping to pilfer that awesome spread of wings, burgers, and fries you’re carrying.
- Use in-app phone safety features. In case someone is acting out a Halloween stalker movie, you don’t want to become their prey. Your app most likely includes features that let a friend or family member follow your trips and know your whereabouts, and will let you contact emergency services with one swipe or tap. Get familiar with these features, and use them. It’s better to be overcautious than to find yourself in some real trouble.
- Demand full visibility. The chowderhead in your back seat dressed in a giant lobster costume might be cute and creative, but if the oversized claws are blocking your view, you’ll need to ask that they come off till the ride is over.
- Stay alert. Halloween is a very exciting time, particularly for children. Drive slowly and carefully, looking in as many directions as possible for people who might walk right in front of or behind your car. Make sure your lights are on at all times, even in the daytime, which really does help people notice there’s a car in their vicinity.
- Try a tarp. This sounds somewhat extreme, but if you’re creative, you can turn a protective seat cover into an enticing Halloween decoration for your car. You’ll want this for more than just the messes mentioned above. Glitter, face paint, green slime, and other costume components might look fabulous on your customers, but it’s not such a great look when they get ground into your upholstery. (More tips on keeping your car clean below!)
- Choose parking spots carefully. This one is mainly for you 5-star delivery drivers, but even rideshare drivers stopping for a quick bevvy or a bio break have to park somewhere. Remember that people still use Halloween as an excuse to soap windows and smash pumpkins. Avoid parking where they might be able to make this mischief with your car.
- Read more about safety for drivers in this Gridwise article, and additional safety tips for female drivers in this Gridwise blog post.
- Keep your cool. Even if you see a clan of kids TP-ing your pine trees when you come in from a long night, try to remember Halloween is all about the fun of being just a little bit naughty. That thing about everybody being “nice” all the time is for a totally different holiday.
How to Prep Your Car for Halloween Cleanups
With the excitement of Halloween, there’s always a chance for messes—whether it’s glitter from a costume or candy wrappers left behind by passengers.
- Halloween-Specific Car Prep: Equip your vehicle with essential cleaning supplies to handle any spills or messes quickly. Paper towels, disinfectant spray, air freshener, and trash bags are a must. These items will allow you to clean up any small accidents on the go without losing valuable driving time.
- Protecting Your Upholstery: To prevent costume glitter, face paint, or other Halloween accessories from damaging your seats, consider using temporary seat covers or a tarp (mentioned above). You can even turn this practical solution into a fun Halloween decoration by choosing themed covers that fit the spooky spirit.
- Carry daycare equipment for drunks. For many of the party-prone among us, Halloween is a huge opportunity to tie on more than a costume. Carry sick bags, a roll or two of paper towels, cleaning solution, and plastic garbage bags to take care of any spills or “upheavals” that might occur. Sparkling bottled water could be convenient to have on hand at times like this, too. And remember, if they make a mess, your passengers have to pay to clean it up. Claim with your company to cover detailing costs. Read this post about how to deal with drivers who are, er, “under the influence” for further helpful hints.
By prepping your car ahead of time, you can ensure that it stays clean and presentable throughout the busy Halloween season.
Managing Drunk Passengers During Halloween
As Halloween brings out the partygoers, it’s inevitable that rideshare drivers will encounter intoxicated passengers. Handling these situations properly is key to staying safe and ensuring a smooth ride.
- How to Handle Intoxicated Passengers: If you notice your passenger is drunk, stay calm and professional. Avoid engaging in arguments or encouraging excessive conversation. If the passenger is disruptive or potentially unsafe, don’t hesitate to end the ride early or pull over to a safe location. Politely ask them to leave the vehicle if necessary, and report any concerning behavior to the rideshare platform.
- Safety Features and Claims: Most rideshare apps come equipped with safety features, such as the ability to share your trip with family or friends. Be sure to activate these when you feel uneasy. Also, keep in mind that if an intoxicated passenger makes a mess in your vehicle, you can submit a cleaning fee claim through Uber or Lyft. Keep your vehicle equipped with cleaning supplies like paper towels, disinfectant, and air freshener to handle any accidents.
Managing drunk passengers safely will help you avoid potential problems and ensure a smooth Halloween shift.
Enjoy your Halloween driving, and may you avoid tricks and get many treats, especially tips! Be sure to bring Gridwise along for the ride to track your awesome earnings during this spooky holiday time!
[elementor-template id="21599"]
Work smarter. Earn more.
Whether you drive, deliver, or pick up shifts — Gridwise helps you track earnings, mileage, and performance so you stay in control of your work. Download the app and take charge today.
