The 2026 Insurance Fees Report: Inside the Cost Structure of Rideshare
This report breaks down the insurance fees built into each trip, and what they reveal about platform economics, regional markets, and who absorbs cost shifts.
.jpg)


What insurance fees reveal
Insurance fees do more than add cost to a ride. They show how fare economics shift between riders, drivers, platforms, and local markets.
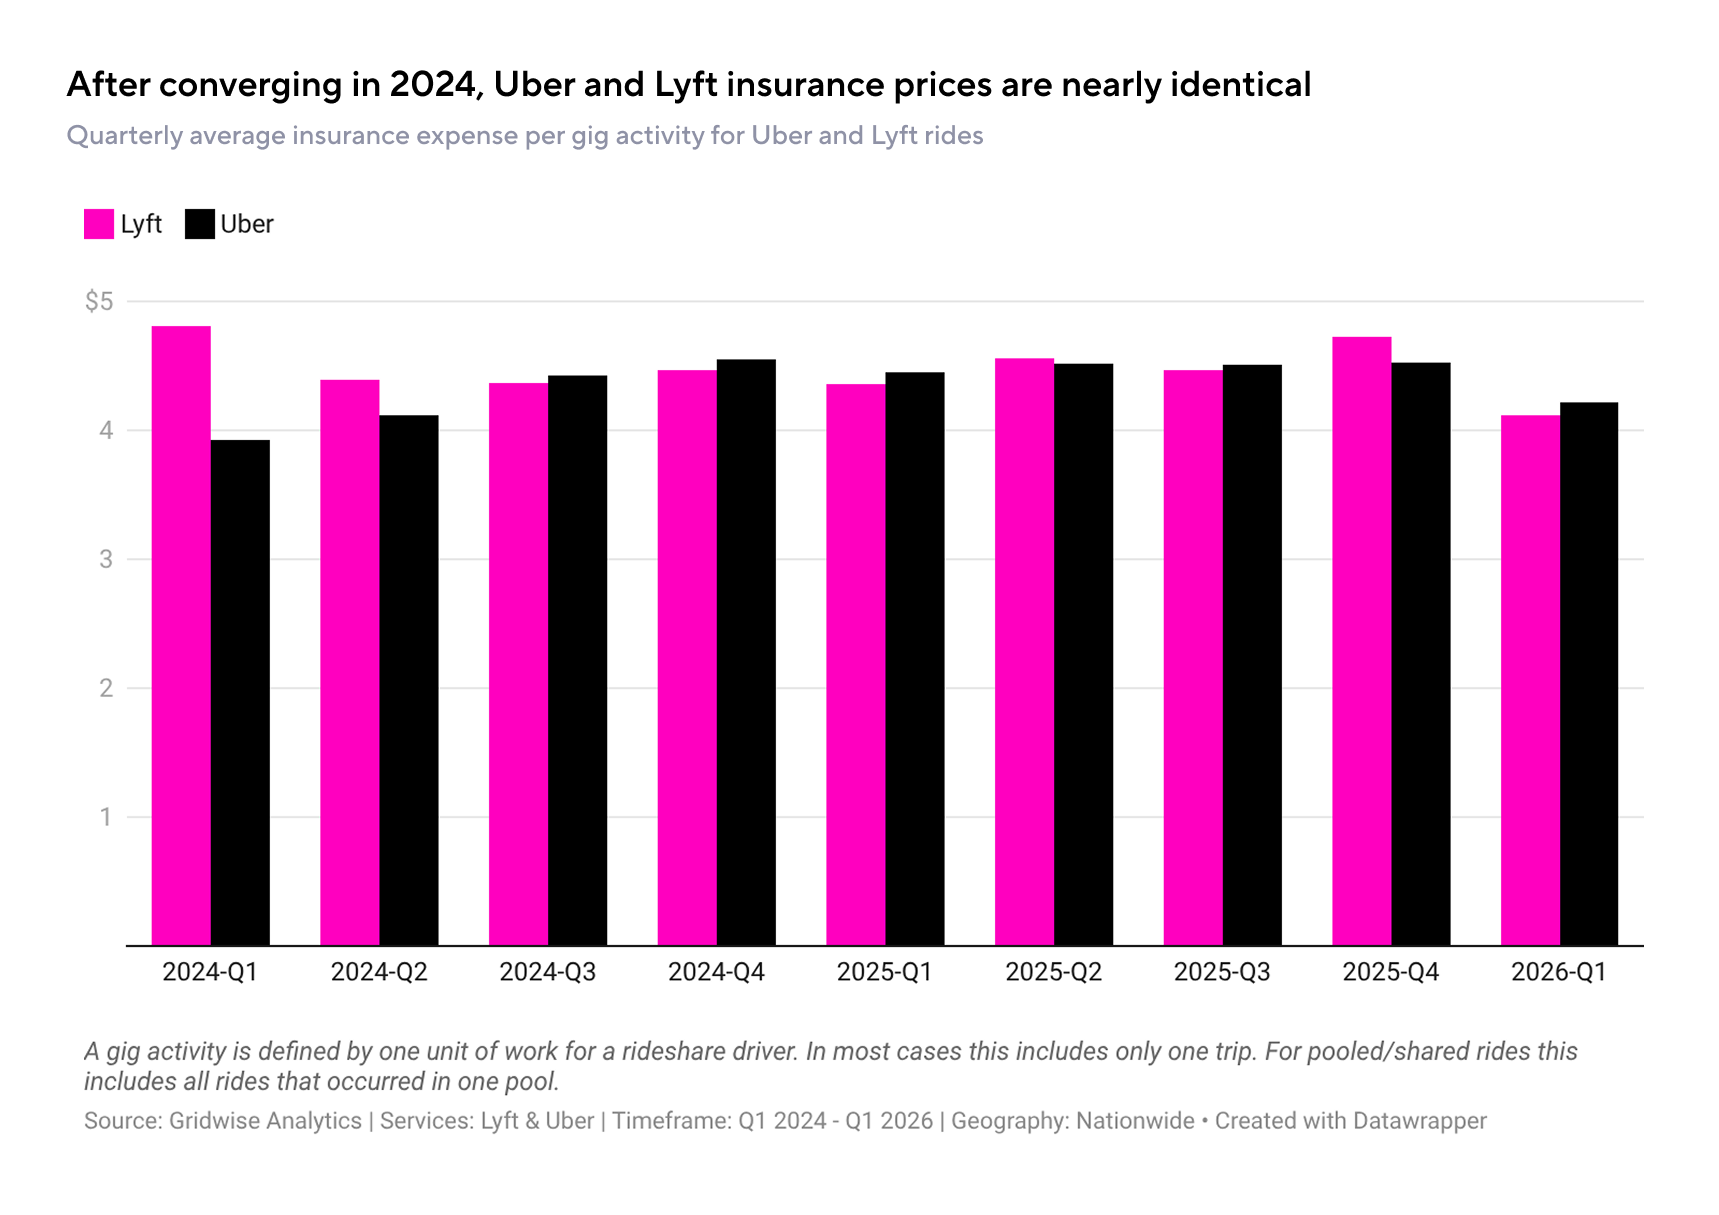
Rideshare insurance expenses have declined
Insurance fees now make up 21% of what riders pay, making insurance one of the largest costs inside a rideshare fare. It is a bigger share of the fare than platform fees or bonus pay.
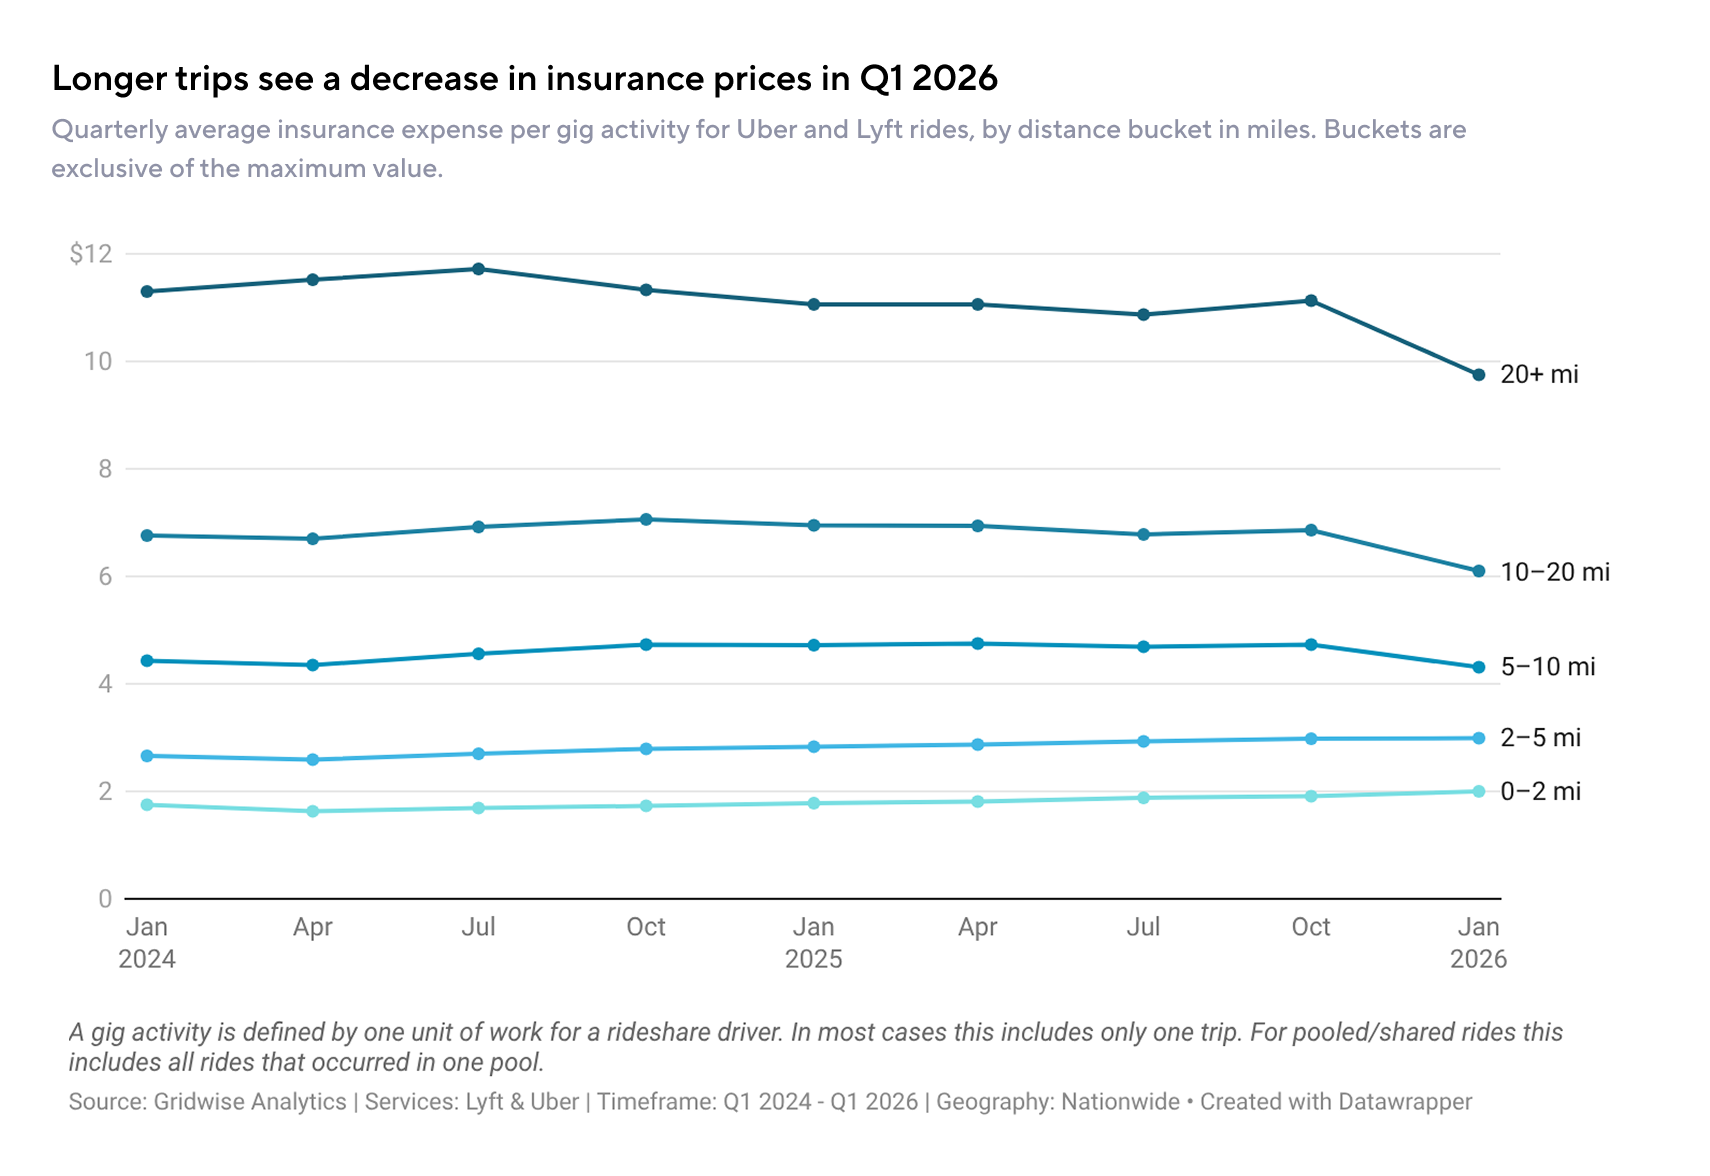
Short-trip insurance expense rose while long-trip expense fell
Insurance expense moved against trip length. From Q1 2025 to Q1 2026, shorter trips became more expensive to insure, while longer trips became less expensive.
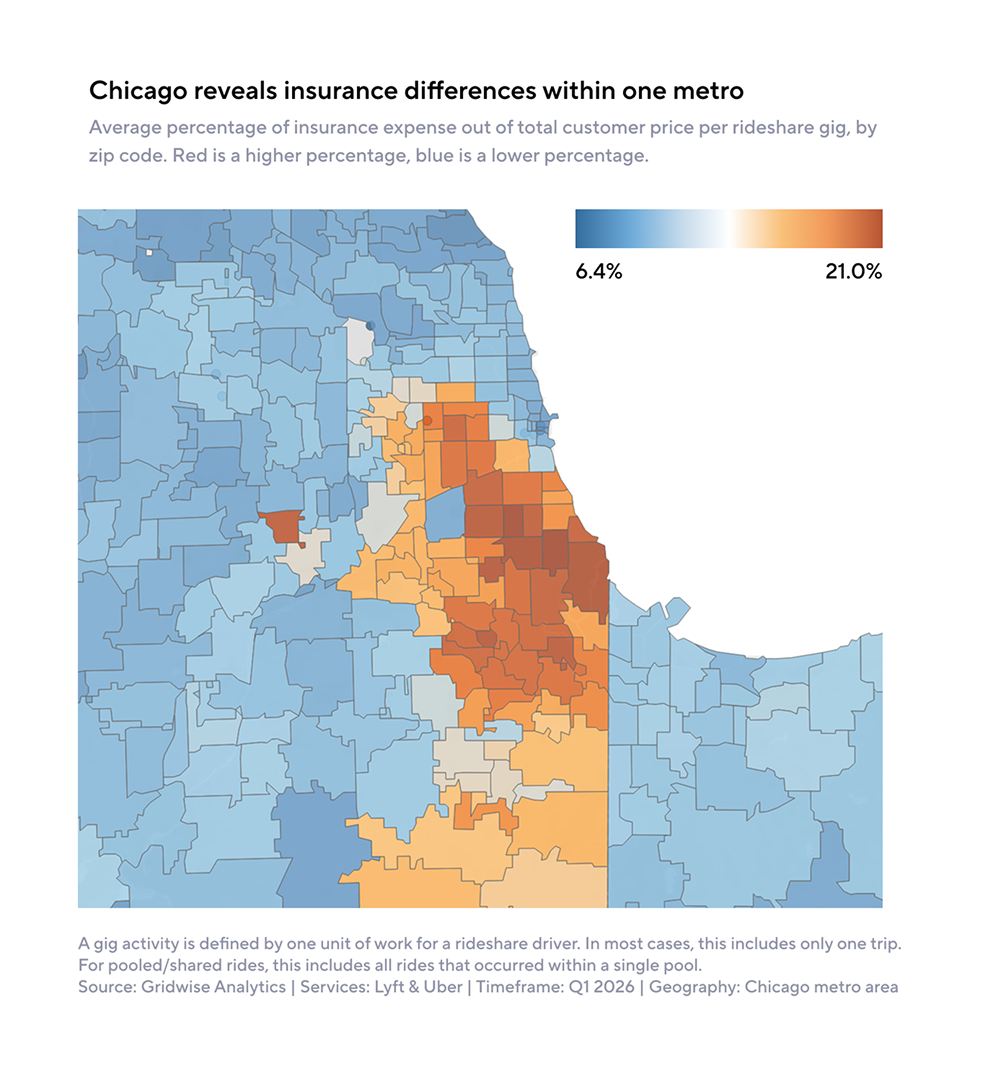
Chicago’s poorset zip codes pay the most in insurance expenses
In Chicago's 20 lowest-income zip codes, insurance expenses per gig were 37.6% higher than the rest of the metro area, despite similar trip distances. Insurance also took up 18.3% of customer price in those zip codes, compared with 12.5% elsewhere.
Explore the full insurance cost breakdown
This report analyzes rideshare and delivery insurance fees from Q1 2024 to Q1 2026, covering fare components, regional cost shifts, driver base pay, Chicago zip code variation, and Uber Eats trends.
Download the full report today and see where insurance costs are shifting
In this report, you’ll discover:
- How insurance compares with driver pay, platform fees, and bonus pay
- Which regions saw insurance costs fall while other fee components rose
- How insurance costs vary across Chicago zip codes and Uber Eats markets