Optimize retail delivery operations with actionable insights from Gridwise
See how you stack up against competitors, improve site selection, and optimize your marketing campaigns for delivery success.


The most comprehensive and representative gig mobility dataset in the U.S.
Every month, we ingest and process millions of anonymized location, trip, and earnings records from ride-hail and delivery drivers that work on platforms like Uber, Lyft, DoorDash, Grubhub, Instacart, Amazon Flex, and countless others.
Gridwise Analytics’ driver panel is highly representative of market dynamics when compared with quarterly reported gig platform metrics.
0
Merchants
0
KPIs
0
Tickers
0
Gig Platforms
0
MAPE
0
KPI YoY Accuracy for Top Tickers
Gridwise Analytics transforms workforce data into actionable insights that help retail firms make better marketing and site selection decisions.
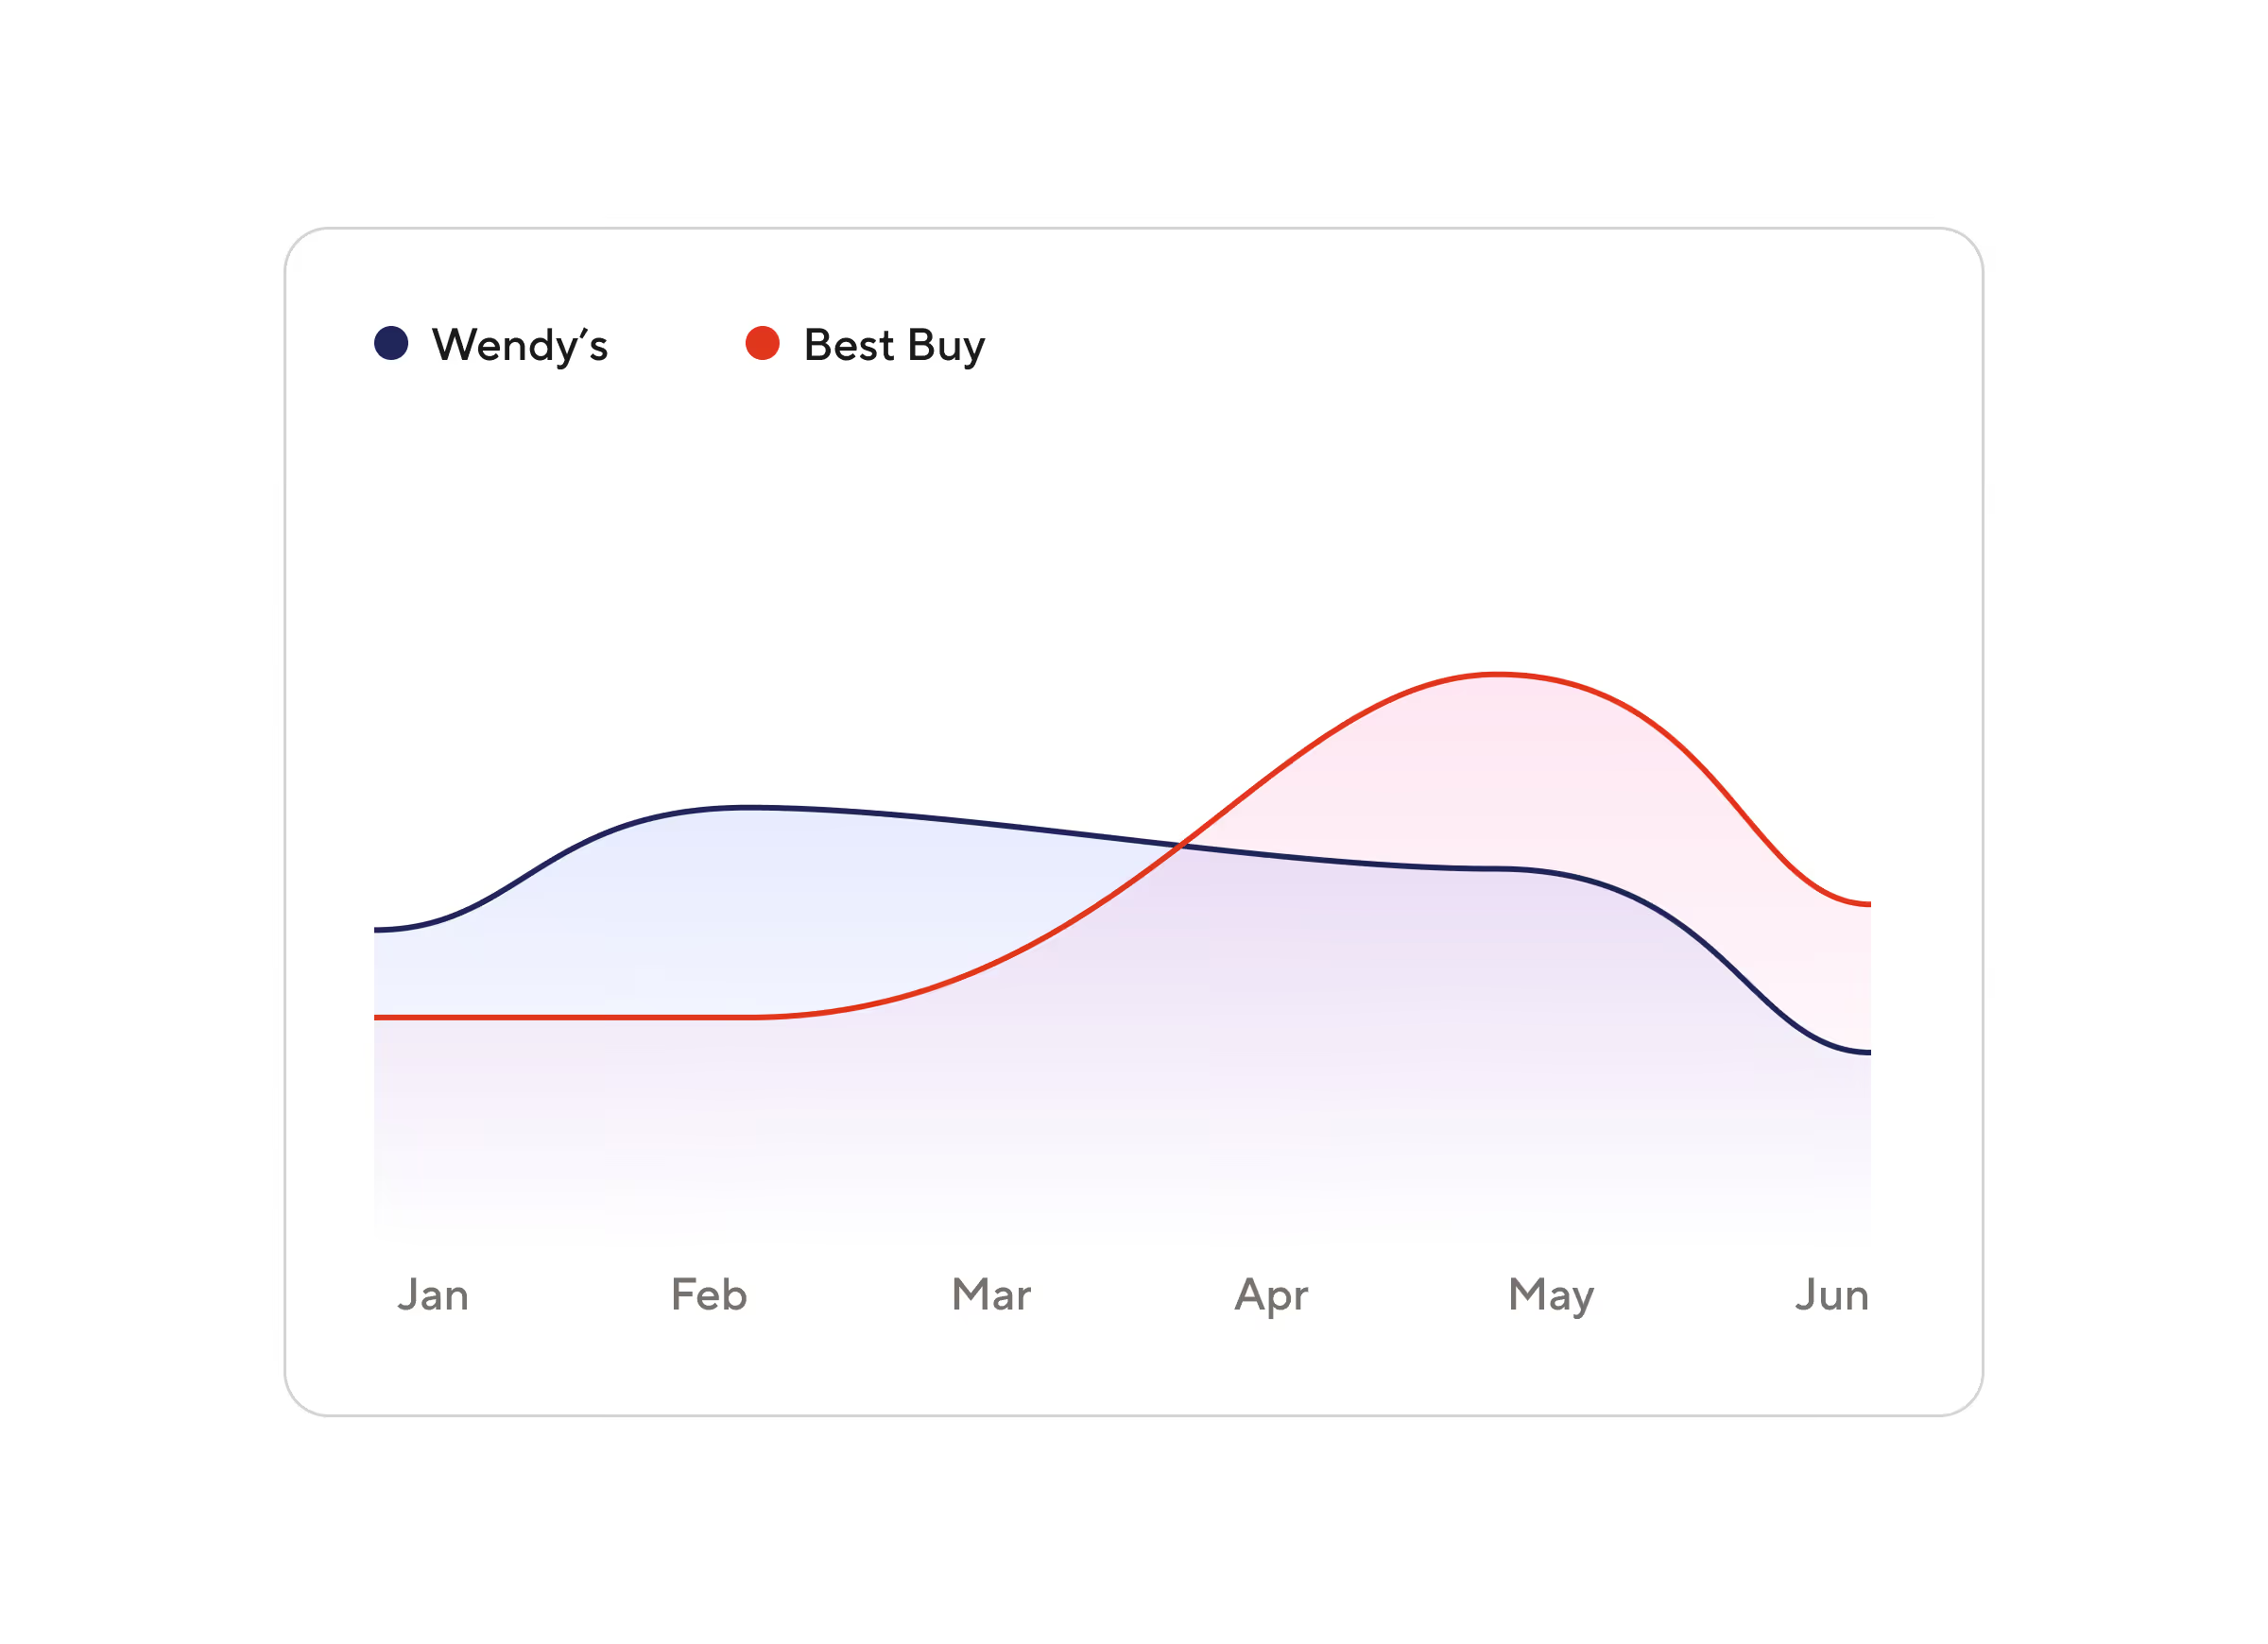
Benchmark your performance
Gain insights into your competitors’ on-demand delivery performance at the nationwide local level so you know where you stand.

Optimize site selection for delivery
Maximize on-demand delivery revenue and grow your customer base by using gig mobility data to pinpoint where customers order from and strategically placing your locations to ensure efficient delivery.
Understand and optimize marketing campaigns
Understand the impact of your marketing campaigns on your delivery revenue and refine your strategies to maximize growth using gig mobility data.

The data you need to master operational performance
Leverage over 100 metrics on work, wages, trips, and deliveries to make smarter operational decisions.
Merchant performance
Identify to performance of individual merchants on each gig platform.
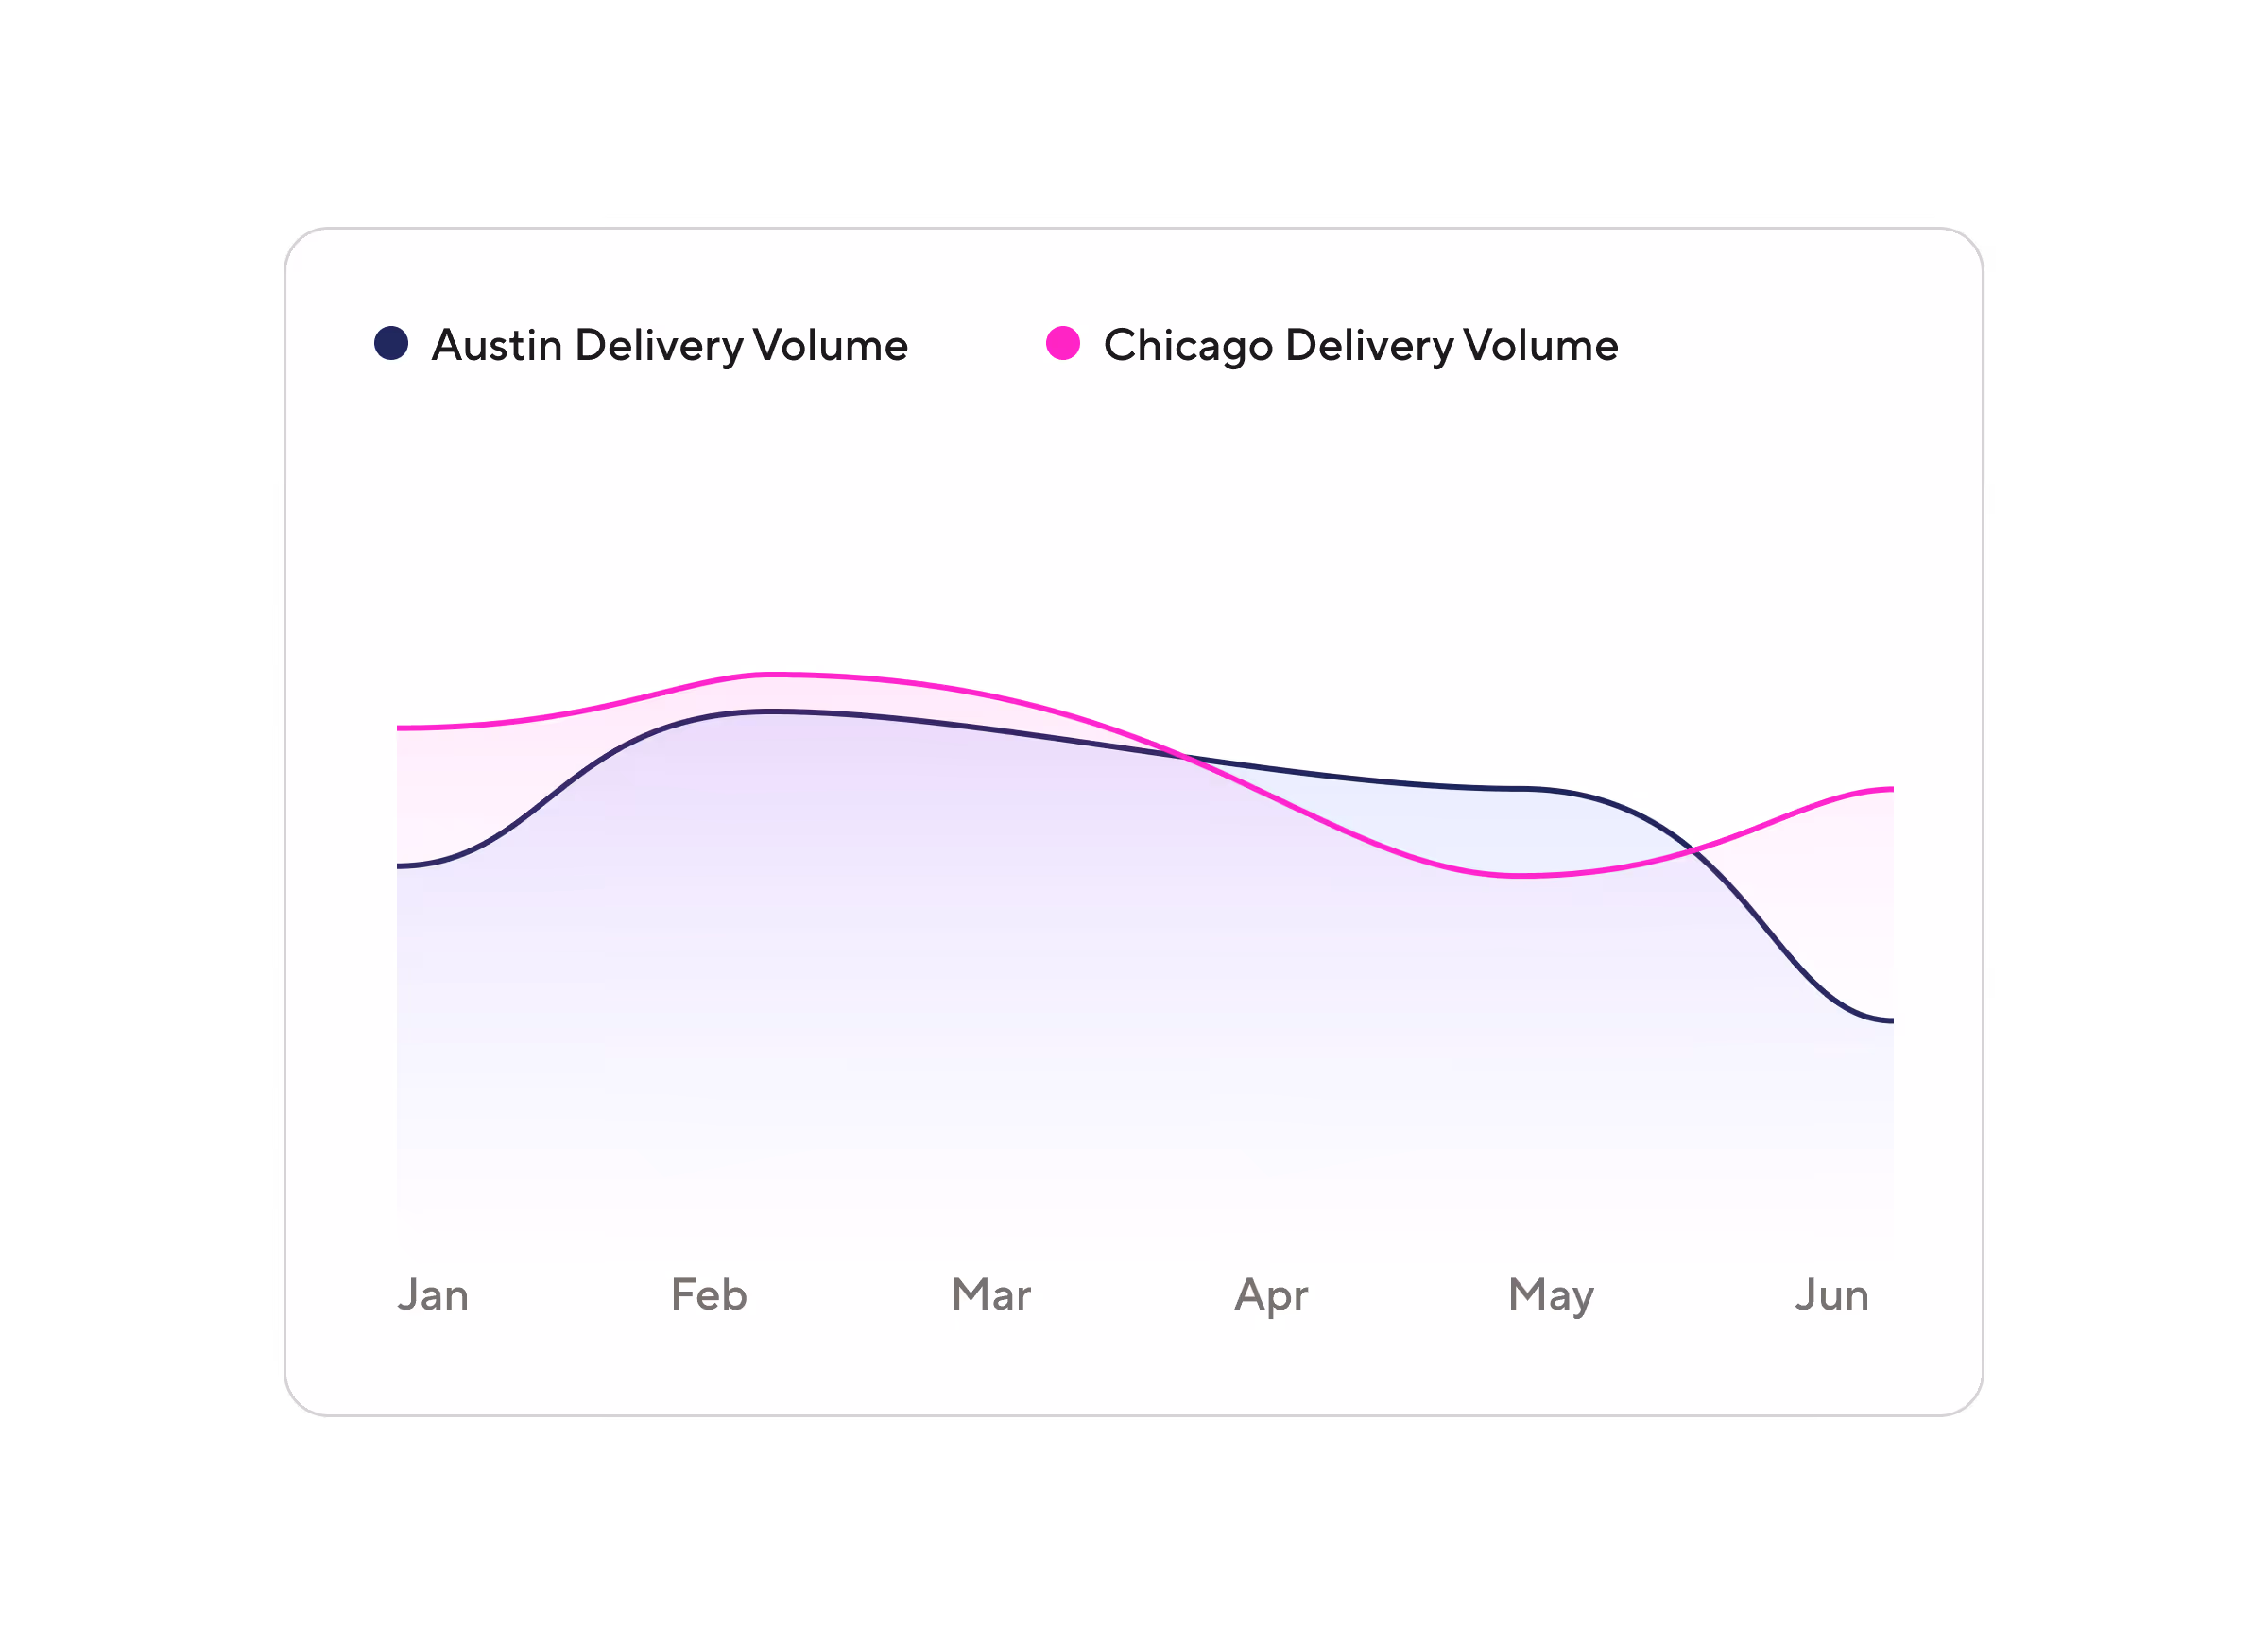
Supply and demand insights & patterns
Know where and when ride-hail and delivery services are being used most.
Market share
Identify the most and least used gig mobility services by region.
Fleet efficiency
Understand how efficiently gig mobility services are leveraging their fleets.
Platform profitability
Leverage insights into customer demand and worker wages to understand platform take rate.
Worker earnings data
See how much drivers make per hour, per mile, and per service.
Unit economics
Understand the unit economics of each trip based on driver earnings, incentives, and passenger tips.
Vehicle trends and popularity
Find out what vehicles are driven most by gig drivers.
Customer demand
Find out how much customers are paying per trip, delivery, and job.
Data-driven reports


Get started with analytics
Let’s talk about how Gridwise Analytics can fit into your operations and goals.