Make Better Pay, Supply, and Pricing Decisions
Use first-party workforce and pricing intelligence to strengthen driver retention, balance supply and demand, and improve platform margins across markets.


The most comprehensive and representative gig mobility dataset in the U.S.
Every month, we ingest and process millions of anonymized location, trip, and earnings records from ride-hail and delivery drivers that work on platforms like Uber, Lyft, DoorDash, Grubhub, Instacart, Amazon Flex, and countless others.
Gridwise Analytics’ driver panel is highly representative of market dynamics when compared with quarterly reported gig platform metrics.
0
Merchants
0
KPIs
0
Tickers
0
Gig Platforms
0
MAPE
0
KPI YoY Accuracy for Top Tickers
Gridwise Analytics transforms workforce data into actionable insights that help mobility firms improve pay strategy, balance supply and demand, and strengthen unit economics across national and metro markets.
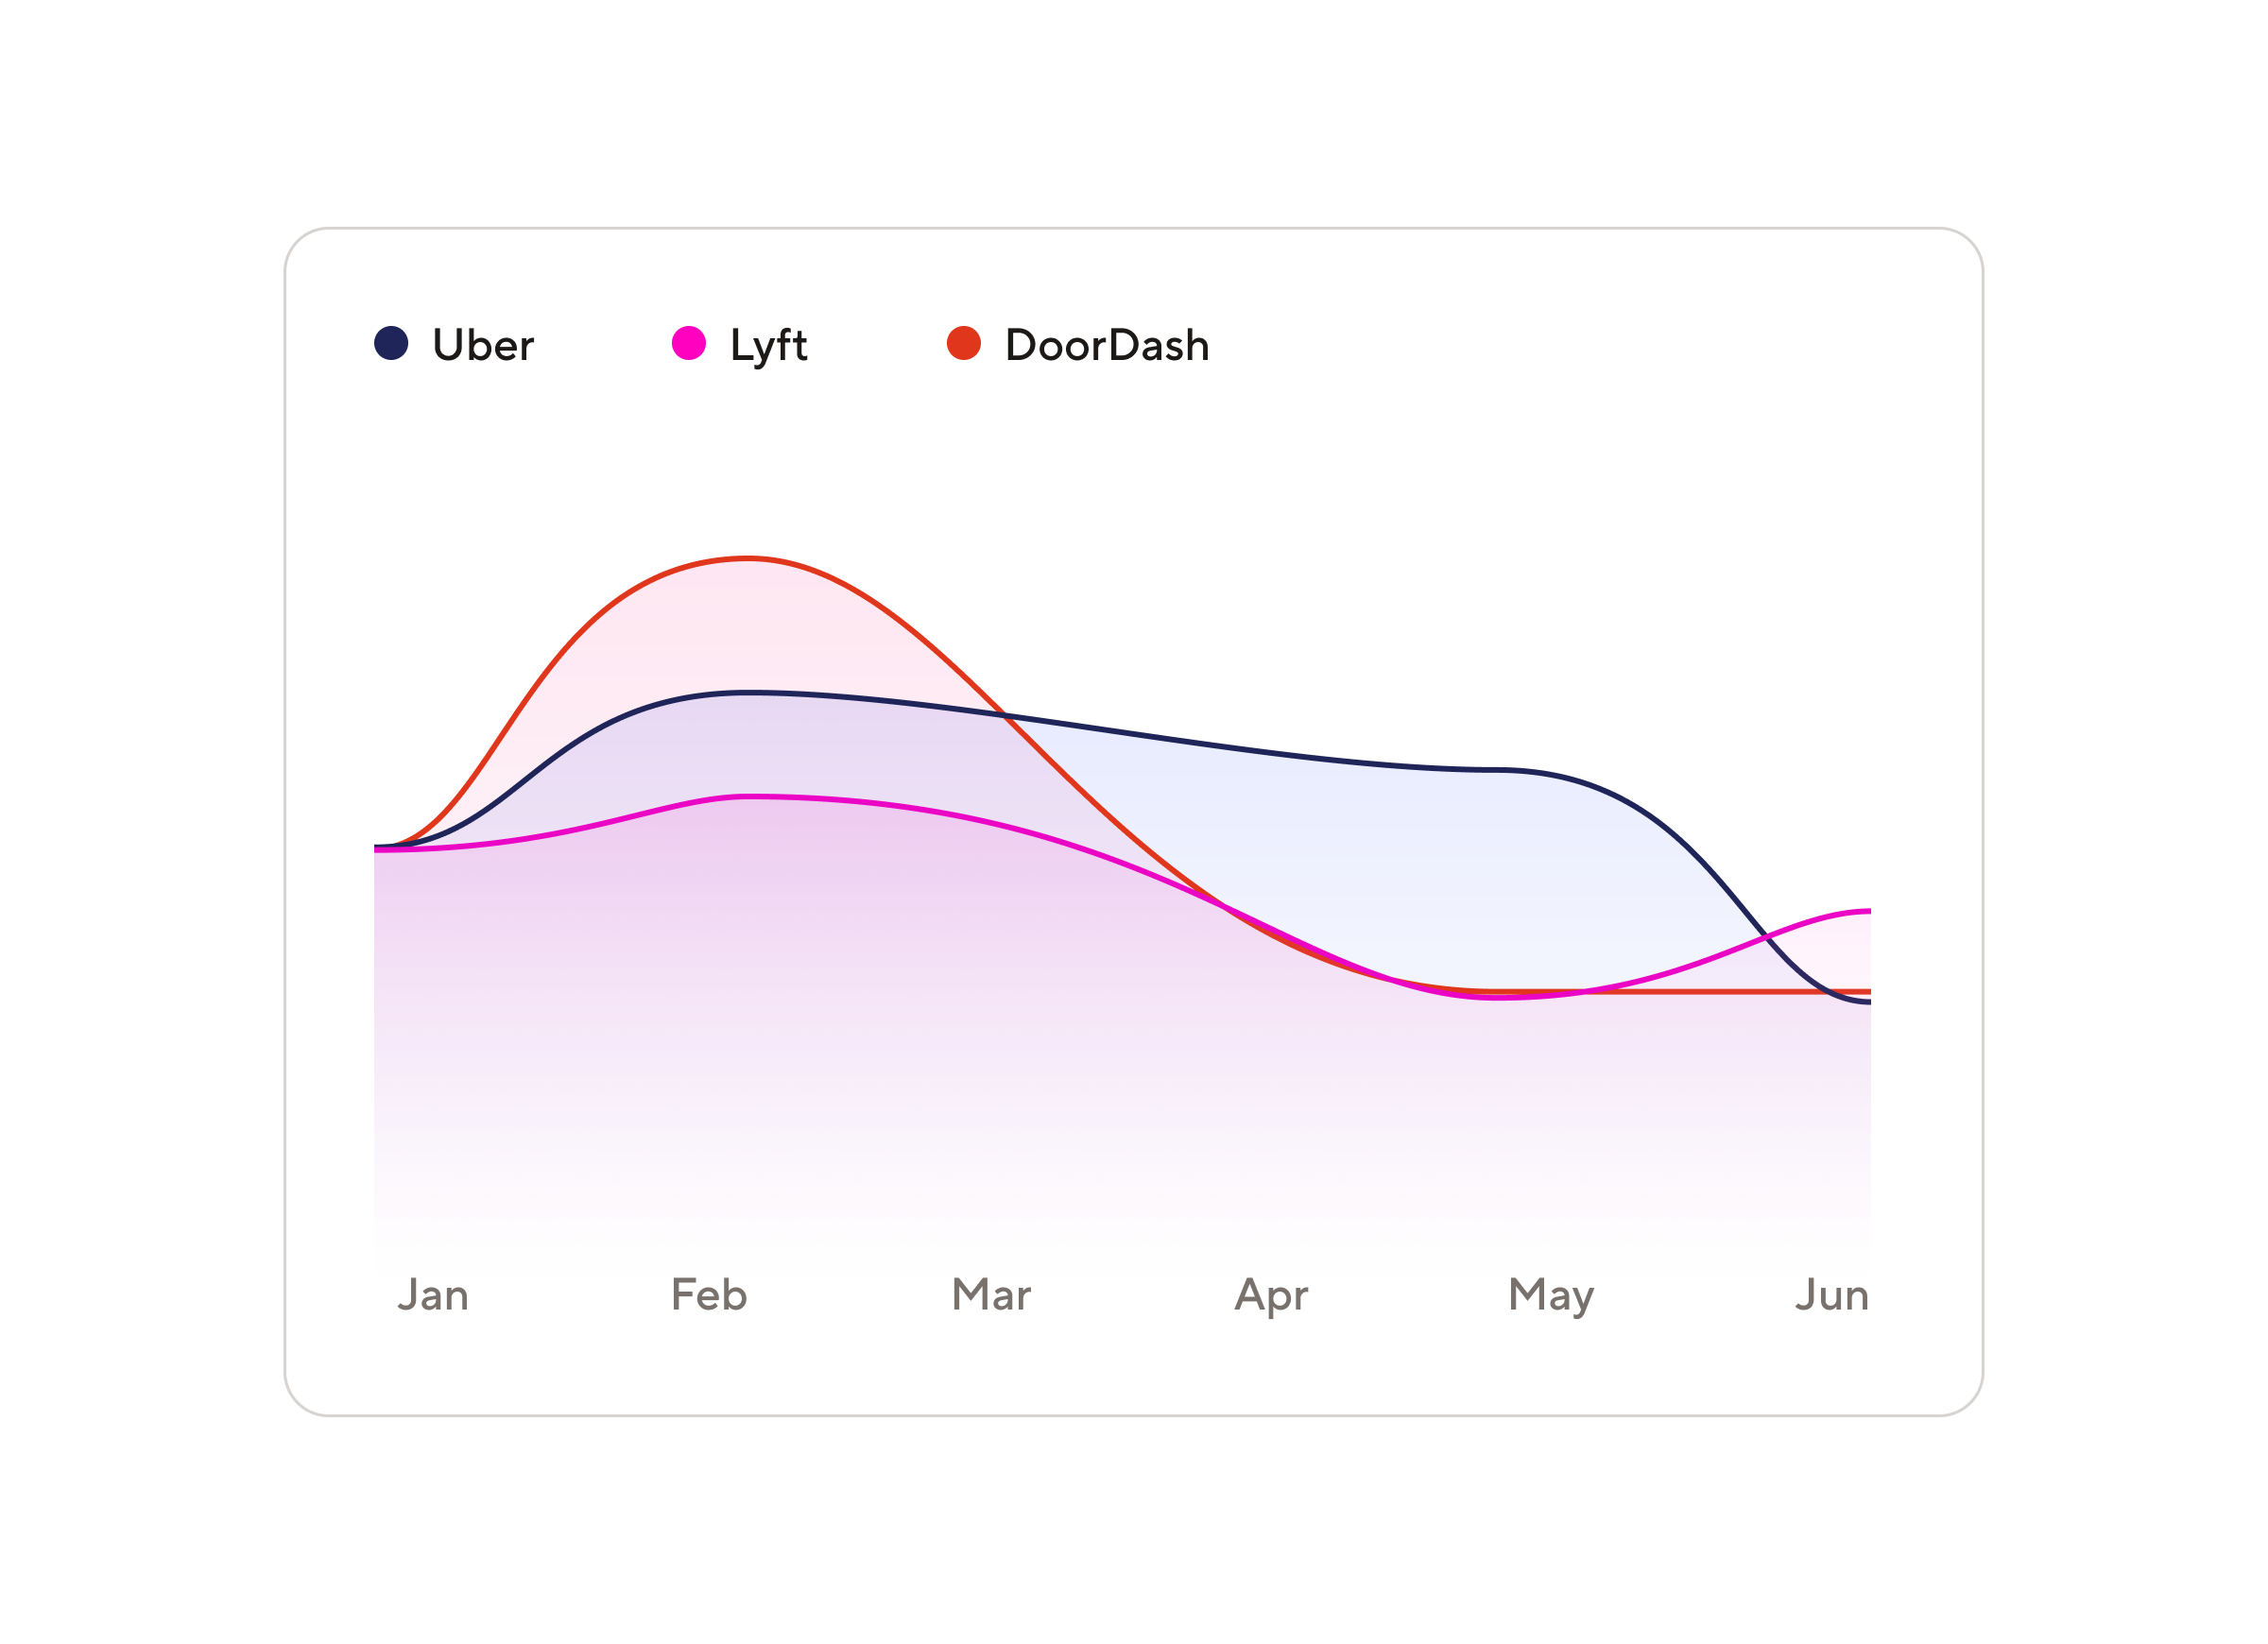
Benchmark Driver Pay
Compare driver earnings per hour, per trip, and per mile across platforms and markets to ensure competitive compensation and optimize pay strategy at the metro and national level.
Analyze Gig Worker Behavior
Understand participation trends, multi-platform activity, supply elasticity, and retention patterns to better anticipate workforce shifts and improve platform stability.
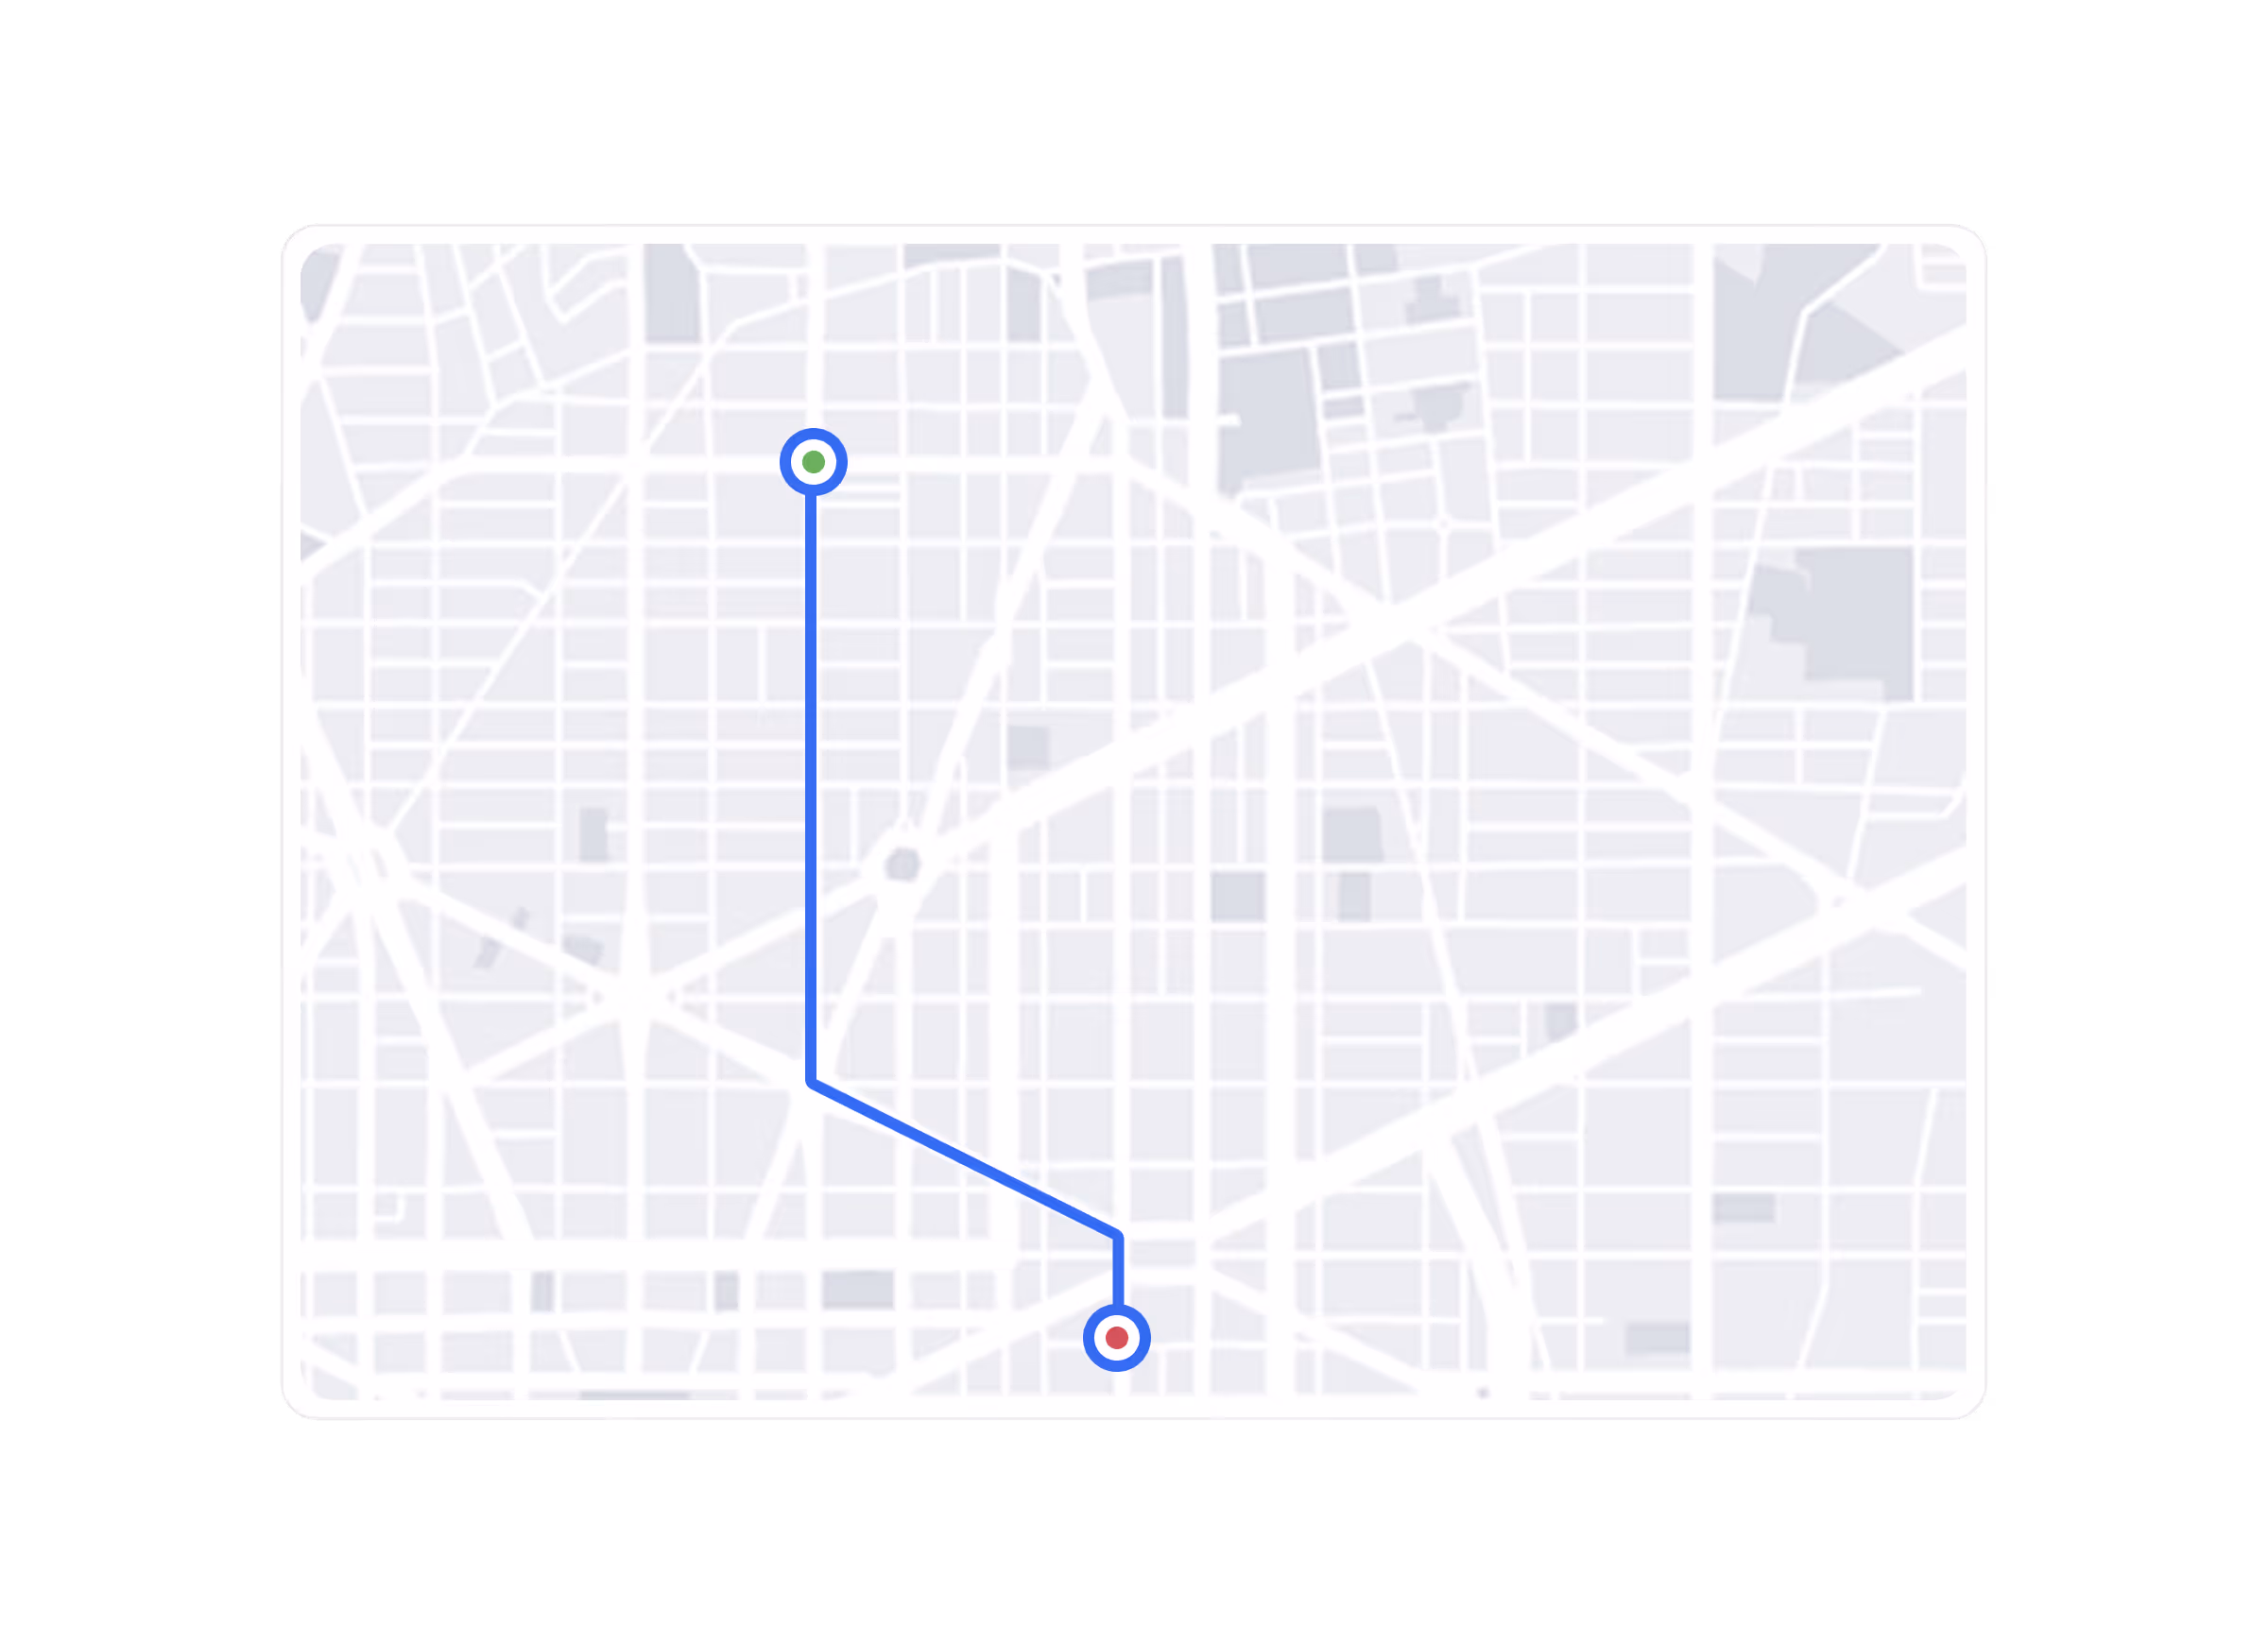
Optimize Service Coverage
Identify where and when demand peaks, uncover underserved zones, and balance supply and demand to improve utilization and operational efficiency.

Strengthen Incentive Strategy
Design and evaluate incentive structures that improve driver acquisition, boost engagement, and increase long-term retention while protecting margins.
The data you need to master operational performance
Leverage over 100 metrics on work, wages, trips, and deliveries to make smarter operational decisions.
Worker earnings data
Understand true driver profitability across platforms.
Unit economics
Measure efficiency and utilization per mile, trip, or hour.
Fleet efficiency
Track utilization, idle time, and route optimization.
Vehicle trends and popularity
Analyze EV adoption, model popularity, and usage.
Platform profitability
Quantify impact of pricing, bonuses, and incentives.
Merchant performance
Track partnerships driving the highest engagement.
Supply and demand insights
Visualize where and when activity peaks.
Customer demand
Identify key locations and time-based demand shifts.
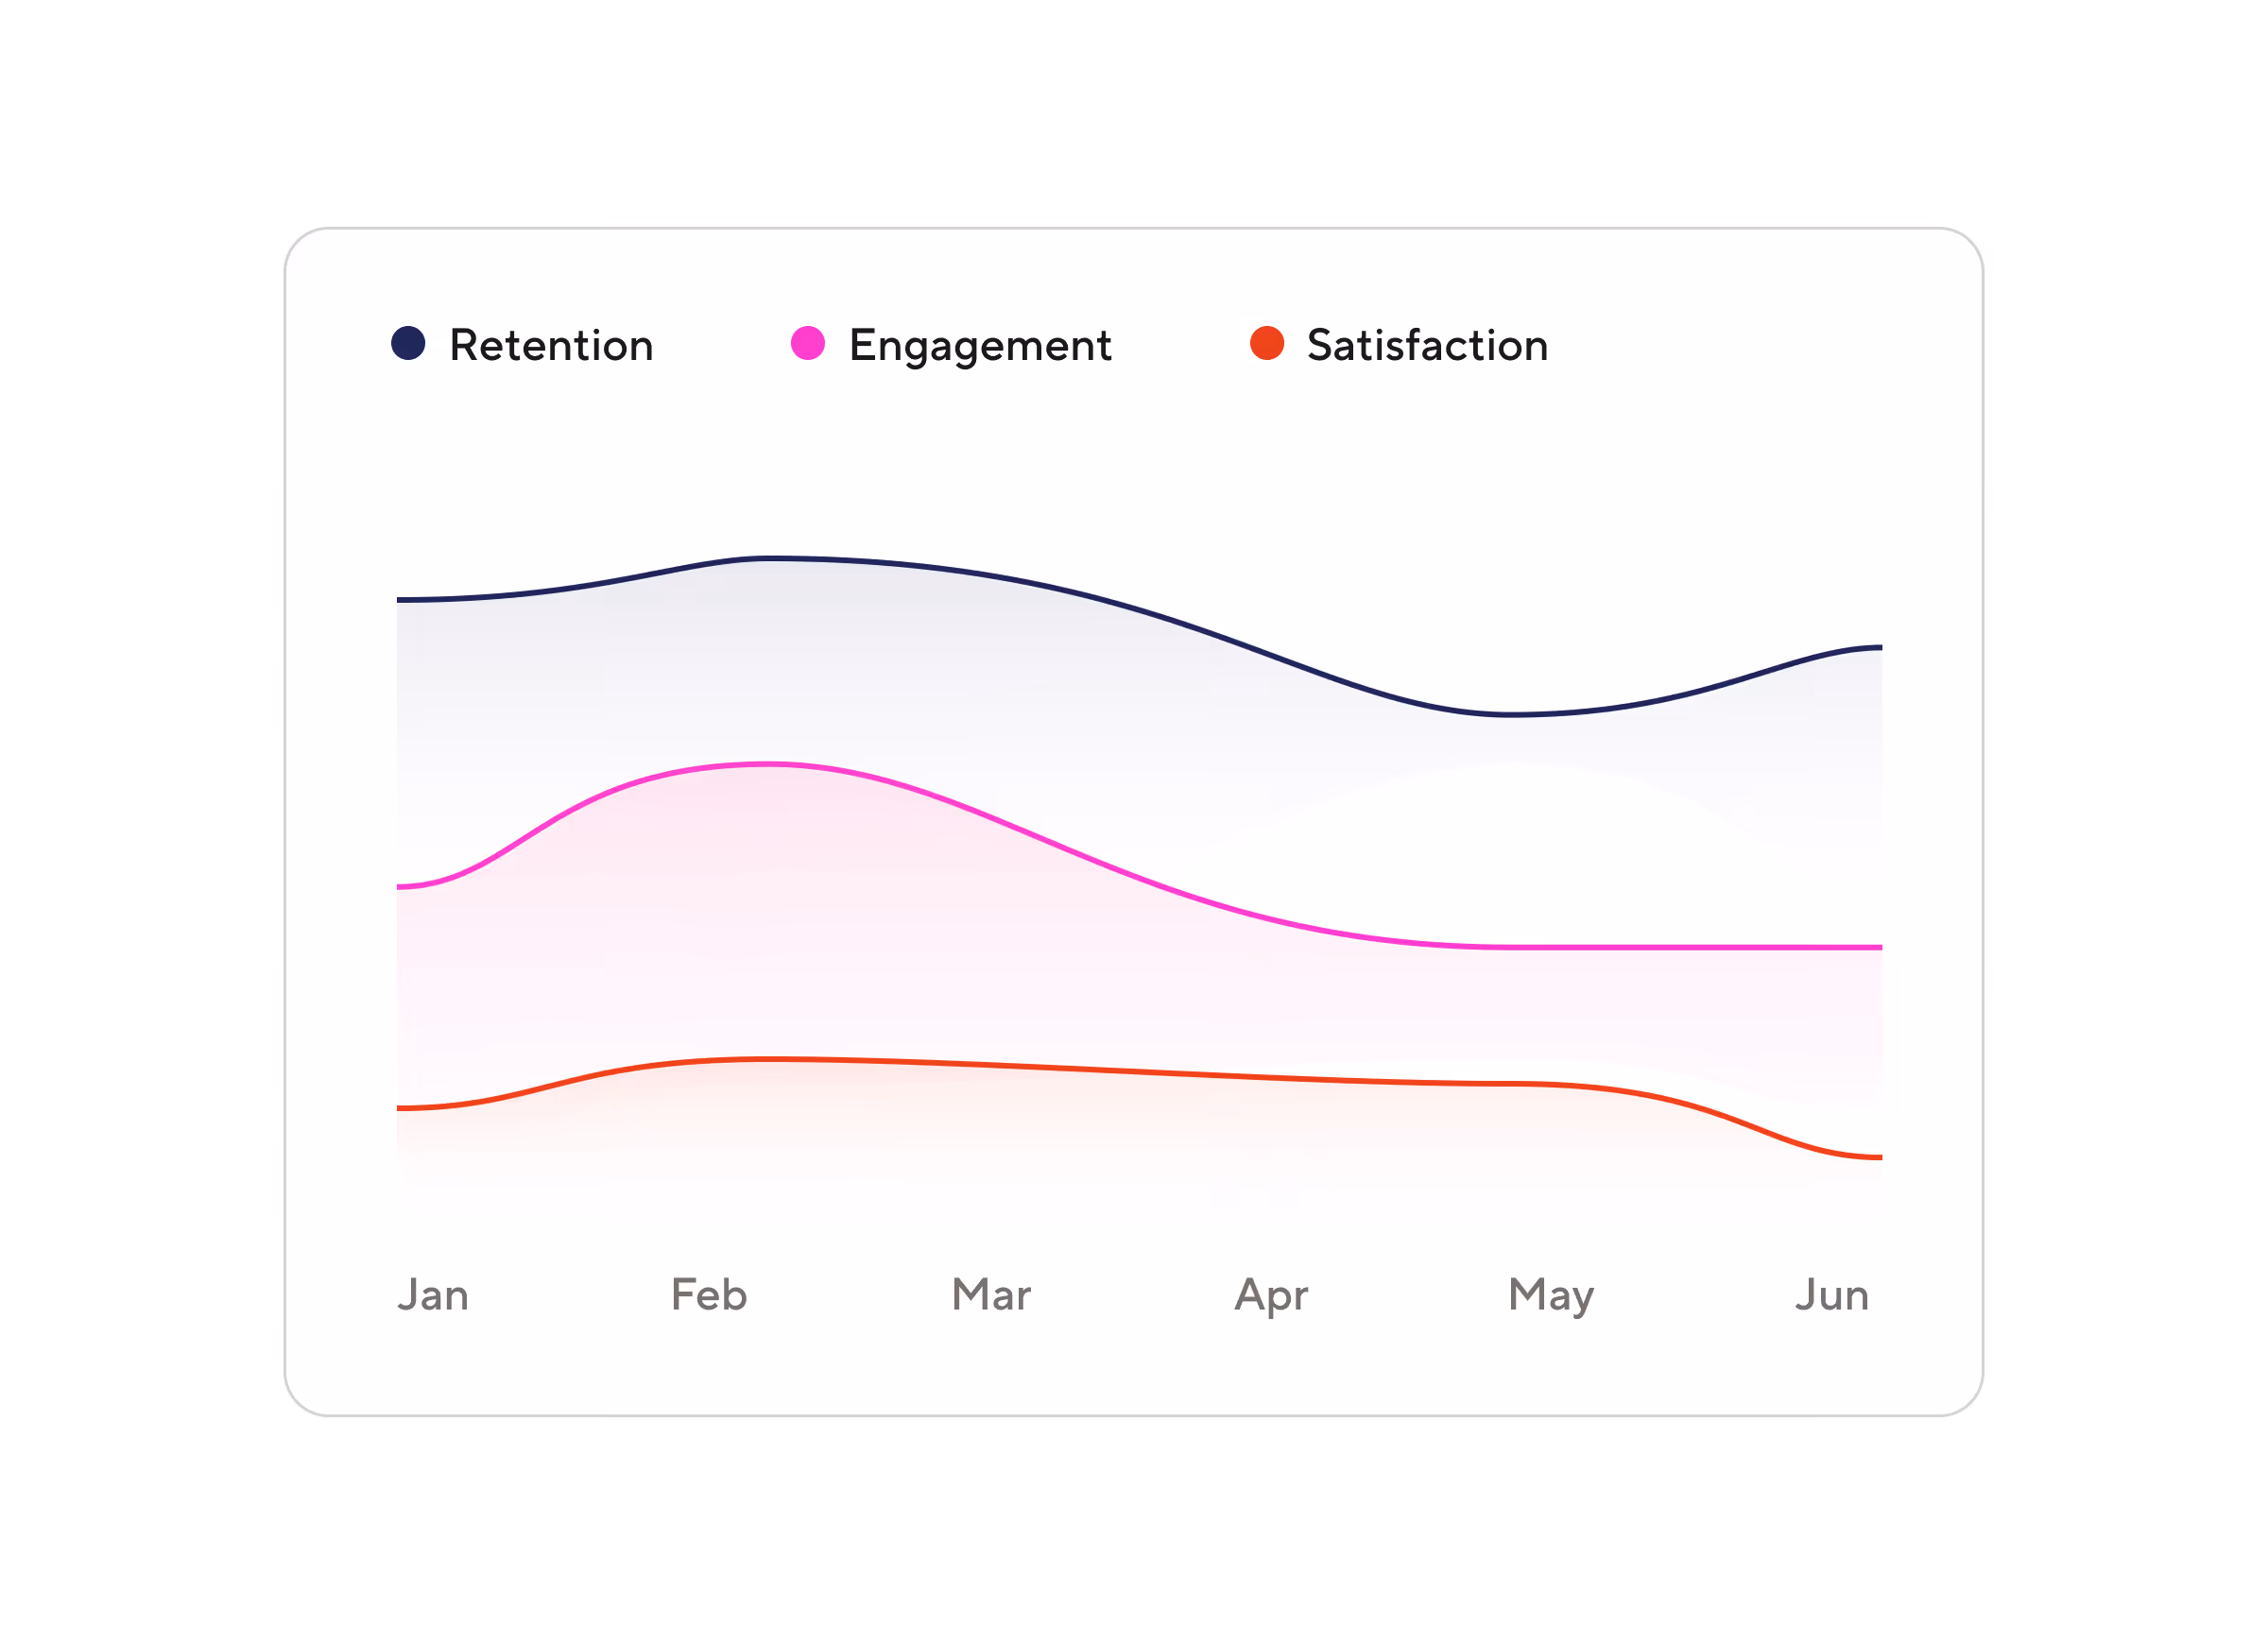
Worker retention
Track churn, tenure, and engagement trends to improve workforce stability.
Data-driven reports


Get started with analytics
Let’s talk about how Gridwise Analytics can fit into your operations and goals.