Make better investment decisions with gig mobility data from Gridwise
Get an early read on the key KPIs of major gig platforms like Uber, Lyft, DoorDash, and Instacart, along with their merchant partners.


The most comprehensive and representative gig mobility dataset in the U.S.
Every month, we ingest and process millions of anonymized location, trip, and earnings records from ride-hail and delivery drivers that work on platforms like Uber, Lyft, DoorDash, Grubhub, Instacart, Amazon Flex, and countless others.
Gridwise Analytics’ driver panel is highly representative of market dynamics when compared with quarterly reported gig platform metrics.
0
Merchants
0
KPIs
0
Tickers
0
Gig Platforms
0
MAPE
0
KPI YoY Accuracy for Top Tickers
Gridwise Analytics transforms workforce data into actionable insights that help financial services firms improve forecasting and make better investment decisions.
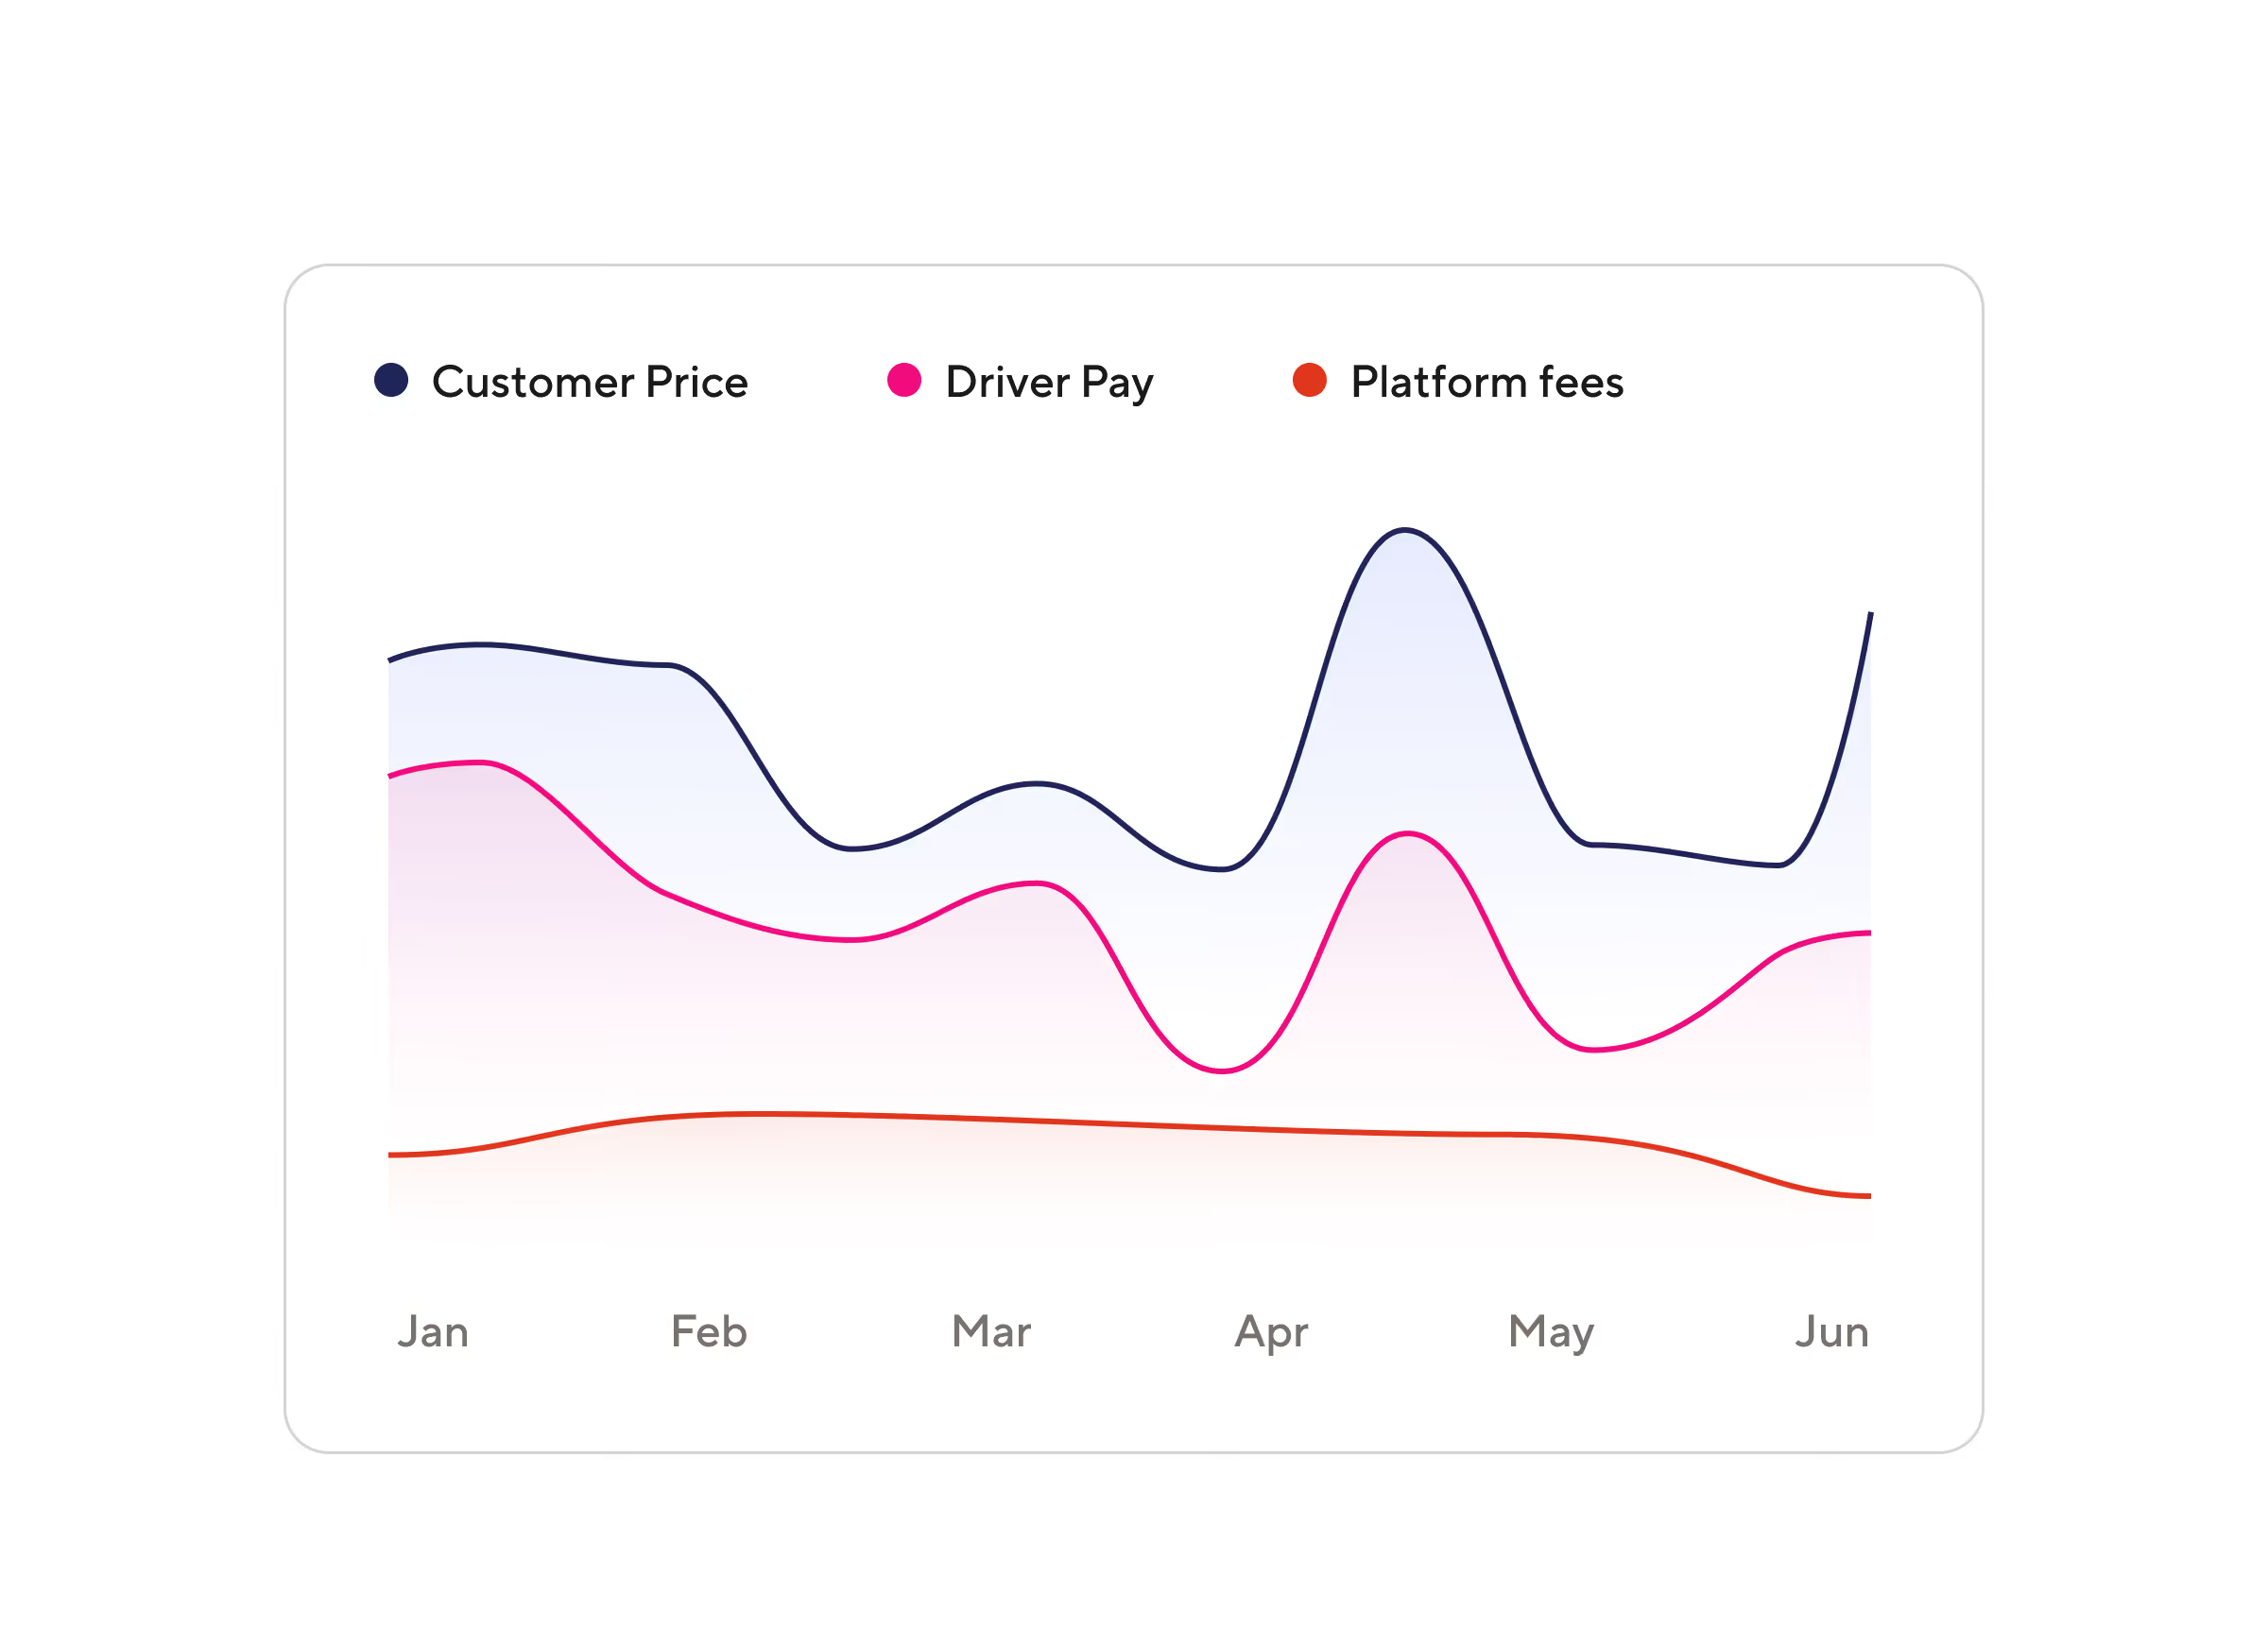
Accurately unit economics
Obtain early insights into fluctuations in customer charge and driver pay to more accurately assess the revenue margin of major ride-hail platforms.
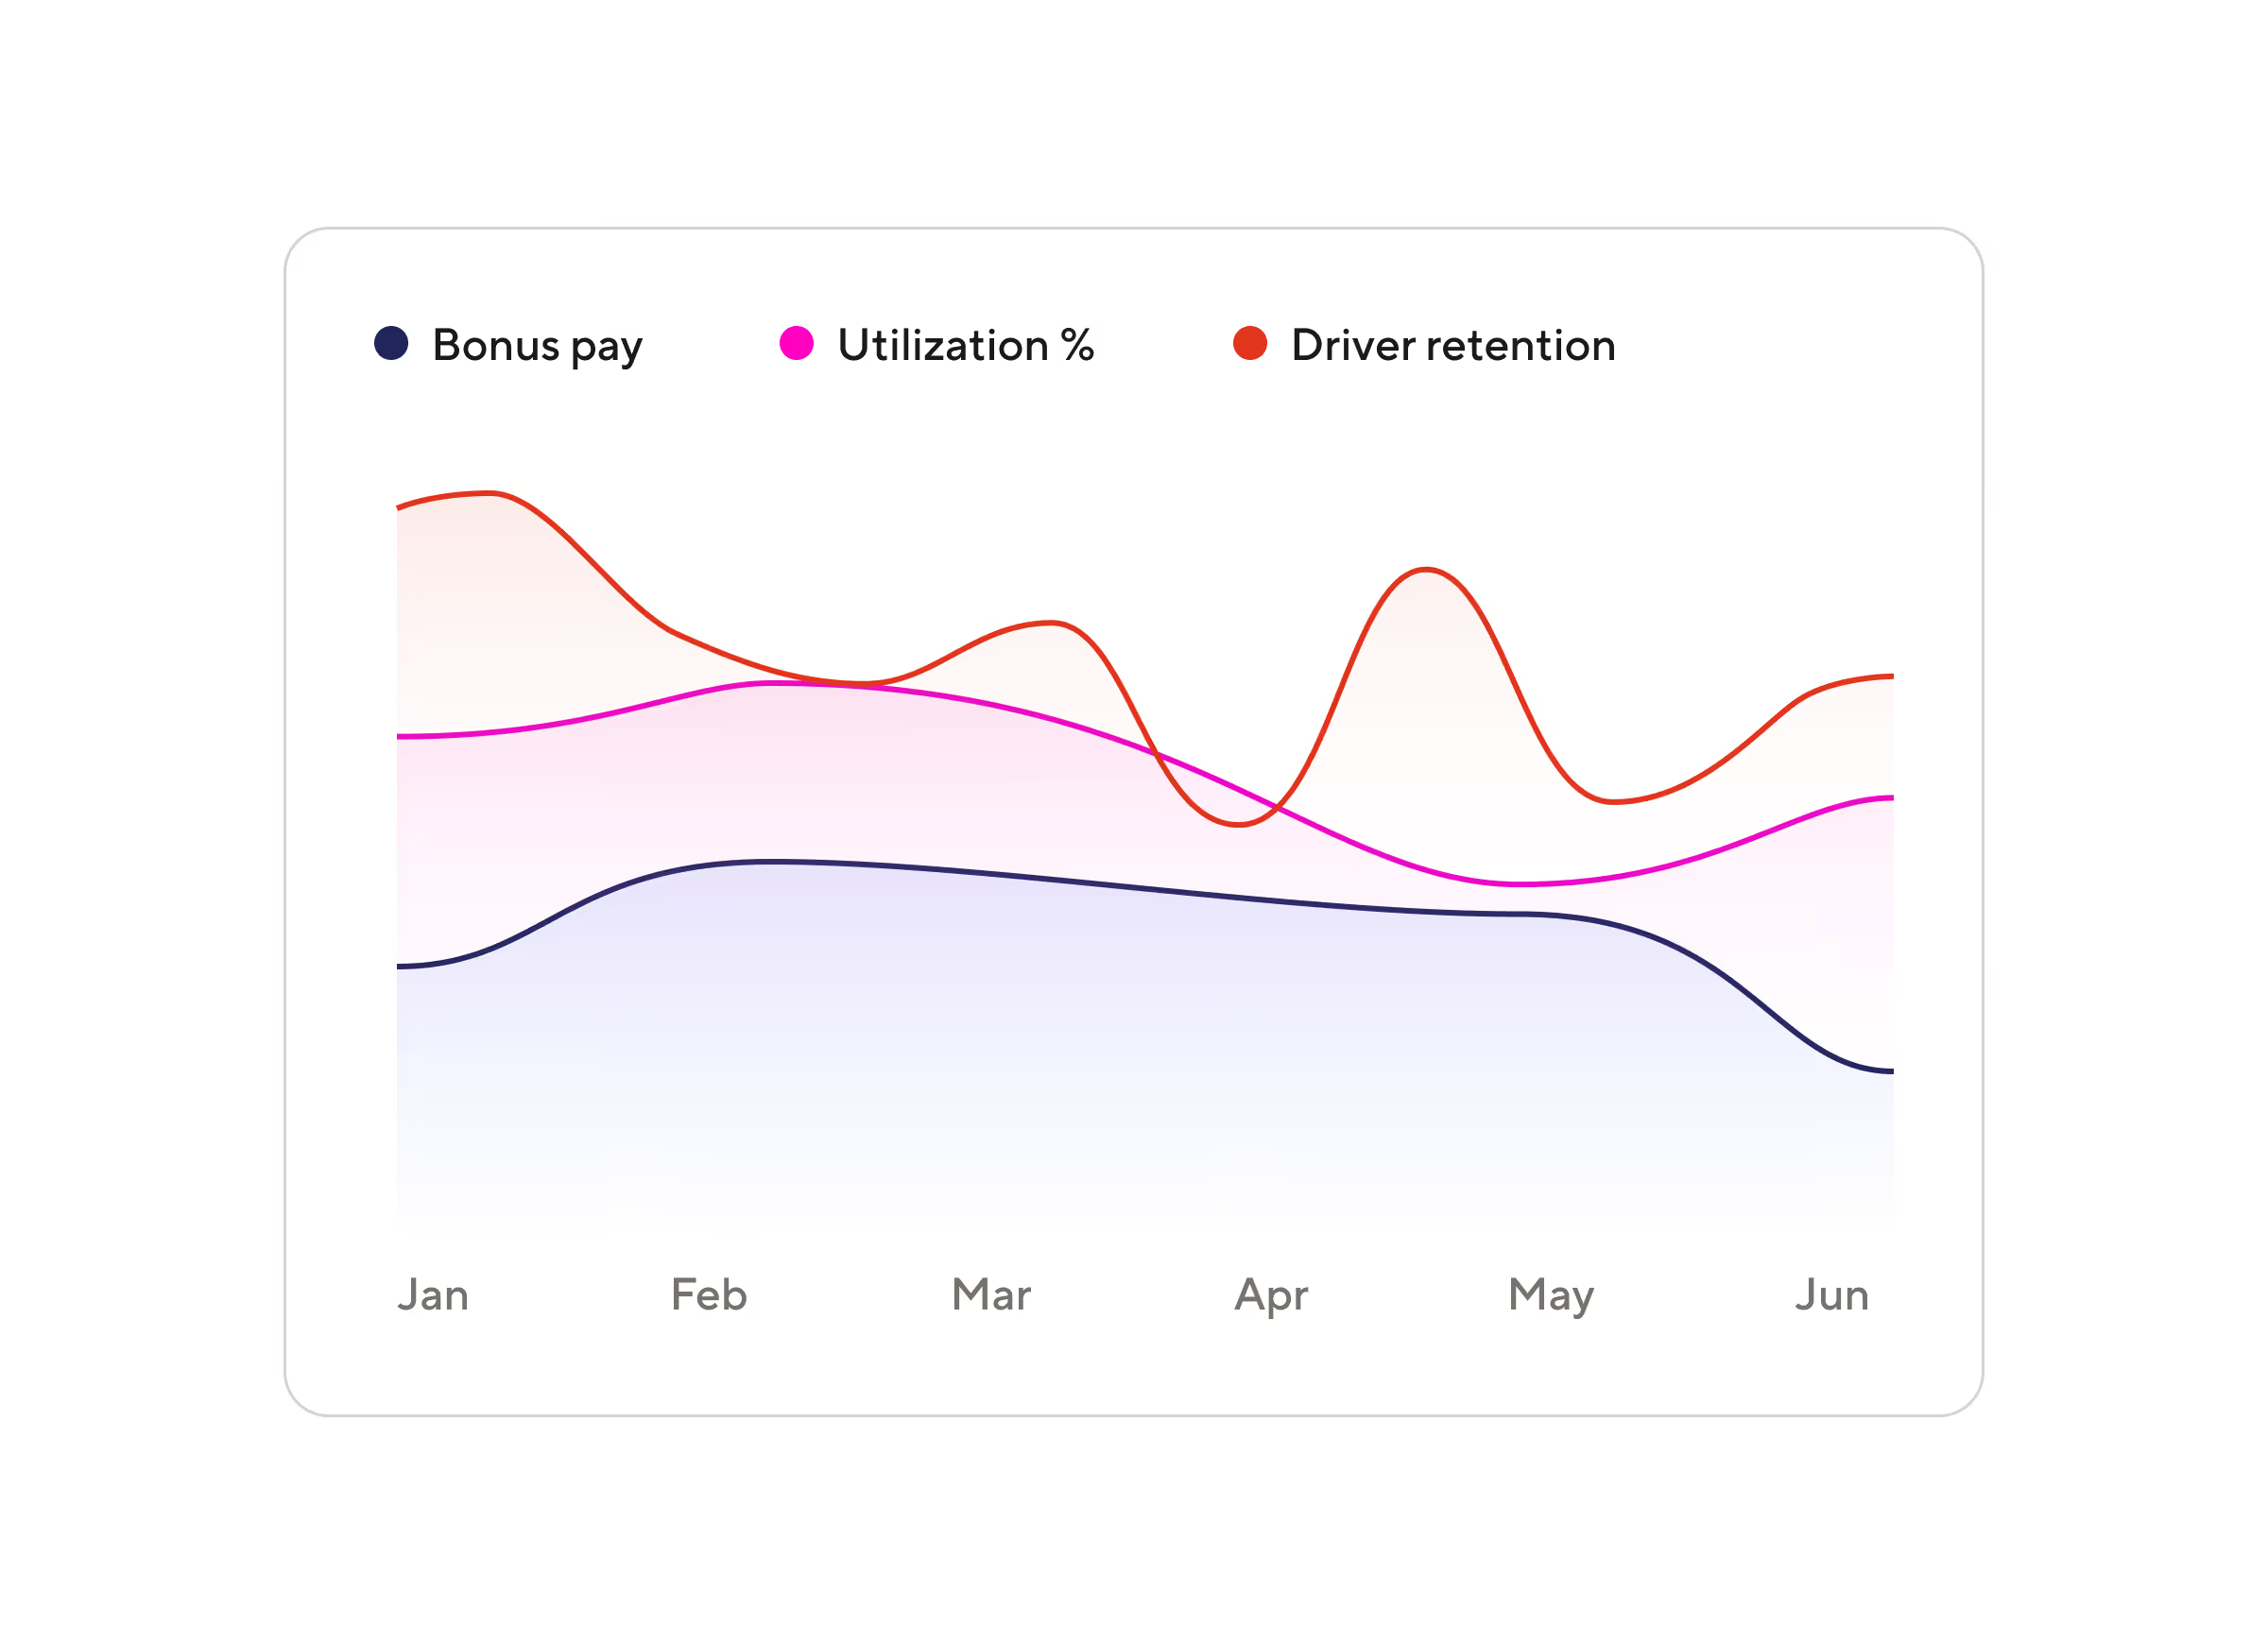
Assess worker utilization and loyalty
Gain deeper insights into gig worker pay, multi-apping behavior, utilization, and retention trends to better understand operational and worker recruitment related costs.
Evaluate expansion and new initiative success
Evaluate the performance of expansions into new sectors, geographies, and partnerships for ride-hailing and delivery companies to gain early insight into the growth of gig platforms and their merchant partners.

Access the performance of major brands
Gain a deeper understanding of the growth and market share of over 110 publicly traded brands and 3,000 merchants utilizing on-demand delivery platforms.
The data you need to master operational performance
Leverage over 100 metrics on work, wages, trips, and deliveries to make smarter operational decisions.
Supply and demand insights & patterns
Know where and when ride-hail and delivery services are being used most.
Worker earnings data
See how much drivers make per hour, per mile, and per service.
Unit economics
Understand the unit economics of each trip based on driver earnings, incentives, and passenger tips.
Fleet efficiency
Understand how efficiently gig mobility services are leveraging their fleets.
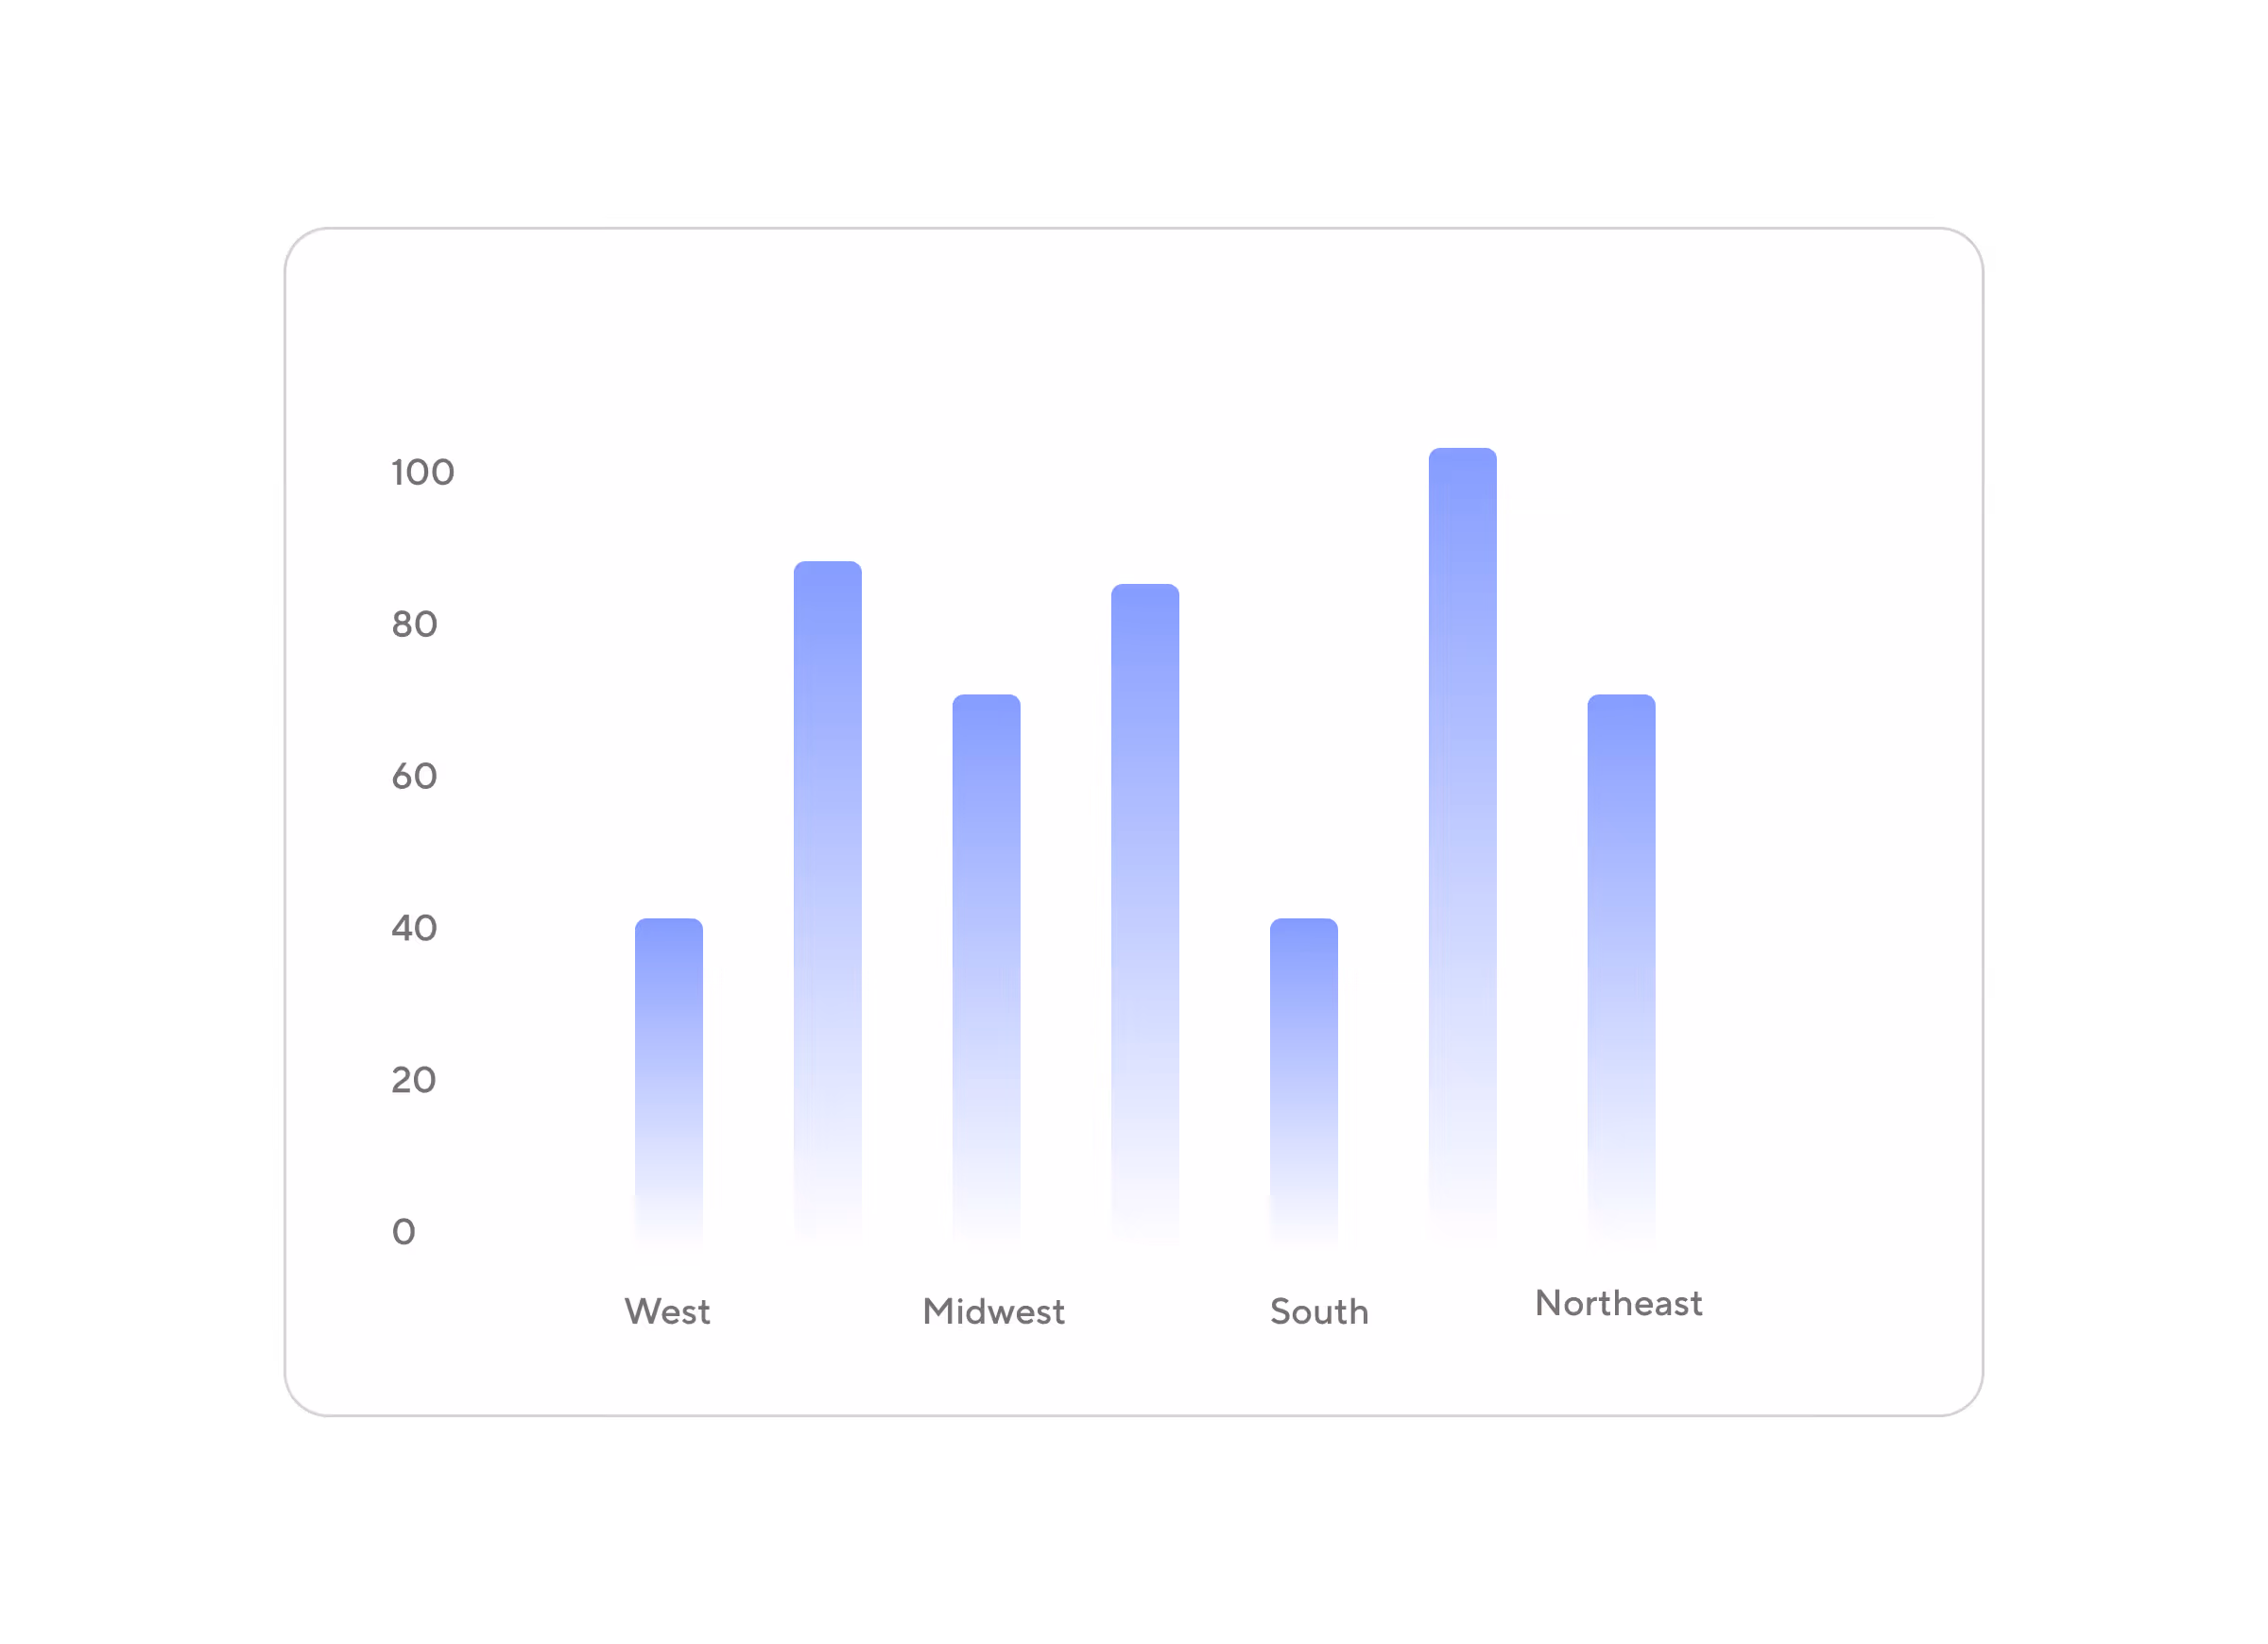
Market share
Identify the most and least used gig mobility services by region.
Vehicle trends and popularity
Find out what vehicles are driven most by gig drivers.
Customer demand
Find out how much customers are paying per trip, delivery, and job.
Platform profitability
Leverage insights into customer demand and worker wages to understand platform take rate.
Merchant performance
Identify to performance of individual merchants on each gig platform.
Data-driven reports


Get started with analytics
Let’s talk about how Gridwise Analytics can fit into your operations and goals.