Premium rides are boosting Uber and Lyft, but rising driver costs threaten the gains.
The share of trips booked in premium tiers grew more than 42% for both Uber and Lyft over the past two years, while platform fees rose 14.0% and 26.4% year over year, respectively. But driver pay also hit a seven-year high, threatening those gains and pressuring margins.













The premium shift is raising prices. Driver pay is rising right behind it.
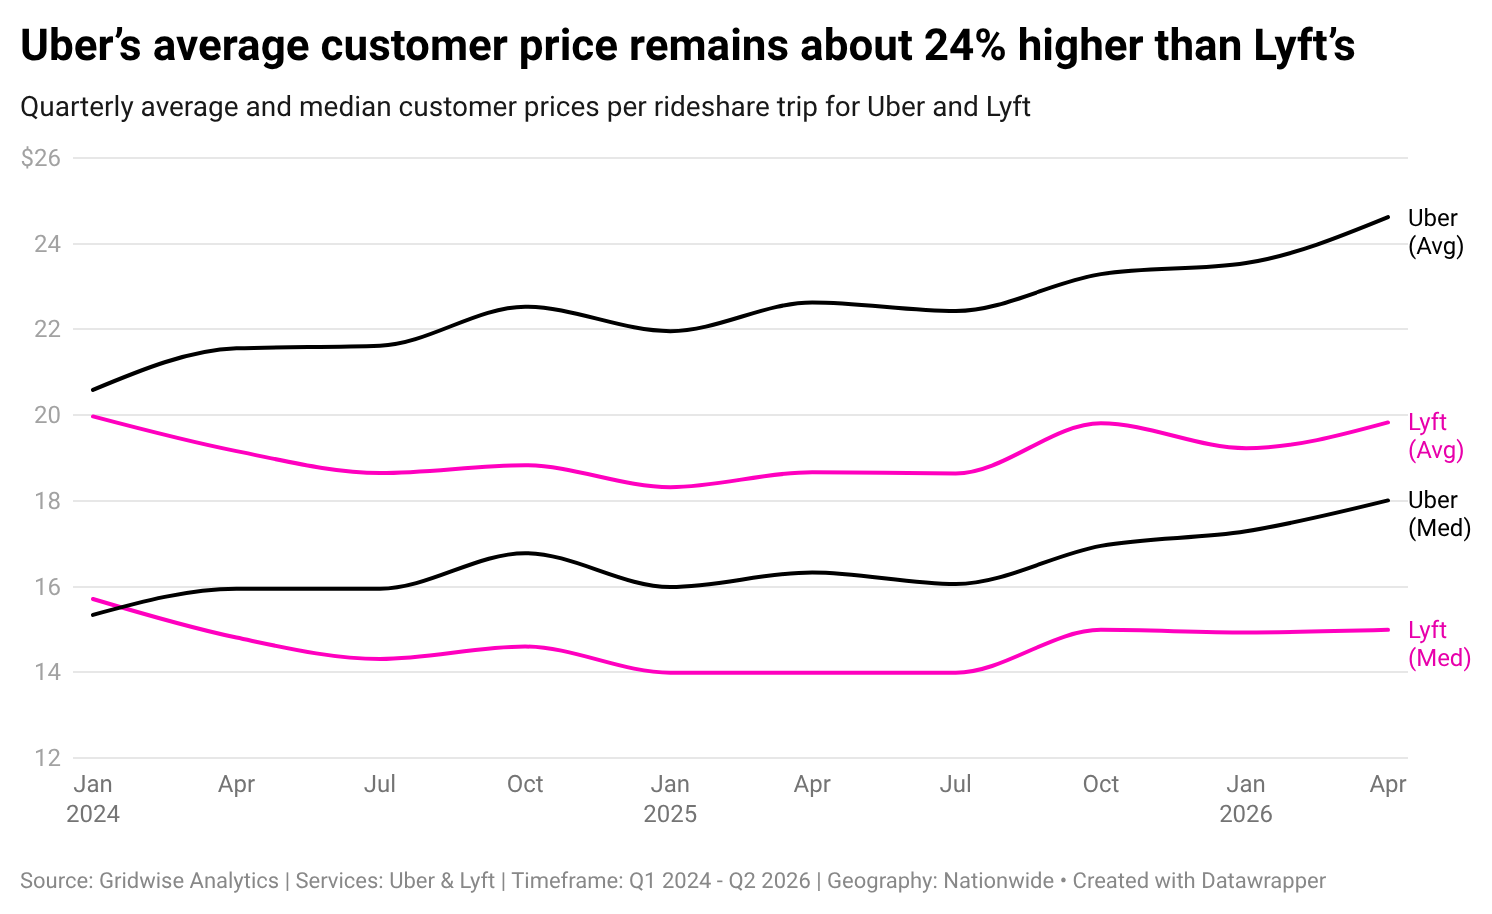
As riders shift toward premium tiers, prices are climbing. Uber’s average customer price rose 8.8% year over year to $24.62 per trip, while Lyft’s rose 6.2% to $19.83. Driver gross pay per working hour also increased 7.3% to $24.41, with bonus and incentive spending rising even faster and pressuring those gains.
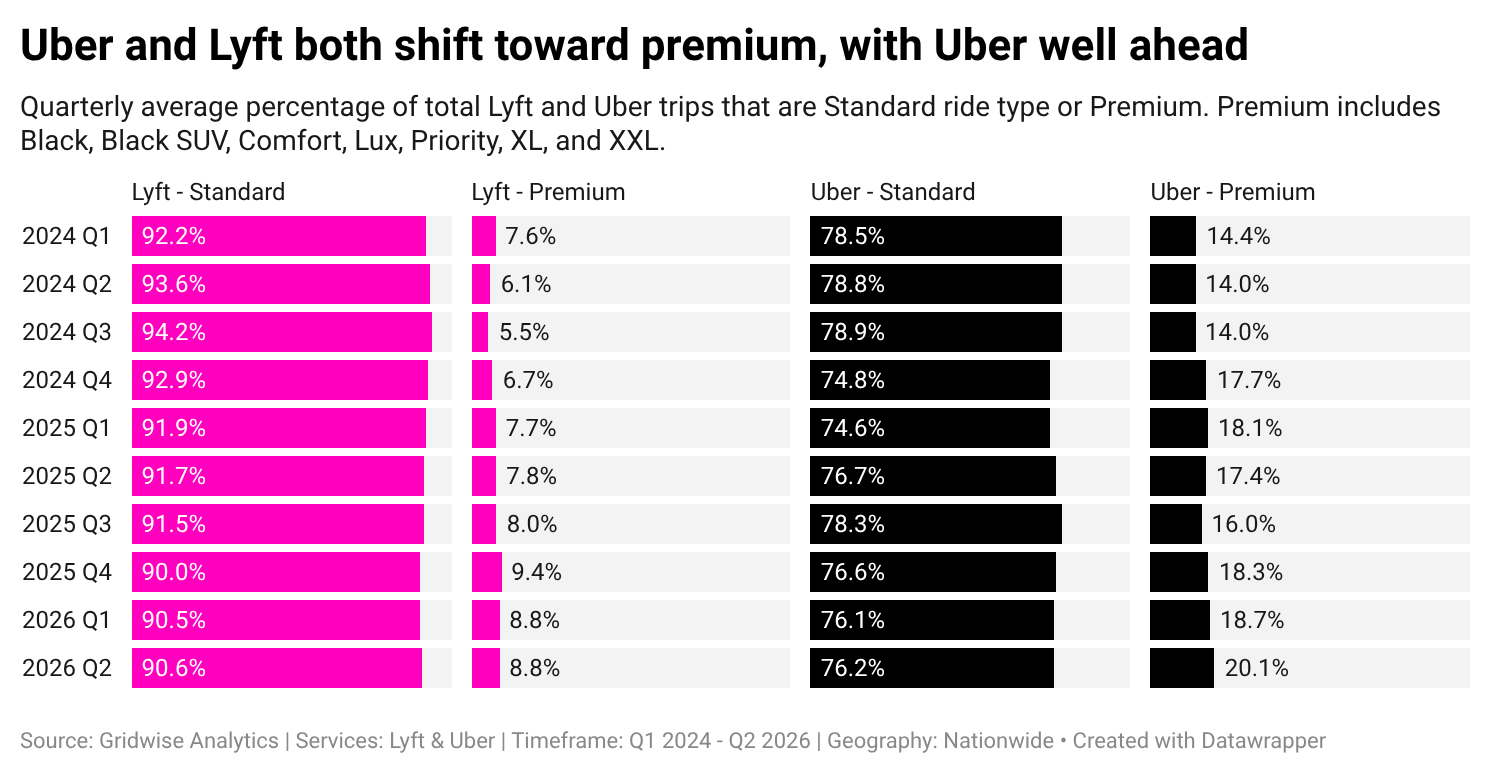
Premium ride share has grown more than 42% on both platforms in two years
Premium rides have gained share for two straight years. From Q2 2024 to Q2 2026, Uber's premium share grew 43.5%, from 14.0% of observed trips to 20.1%, while Lyft's grew 44.9%, from 6.1% to 8.8%.
The typical ride keeps getting more expensive
Median customer prices continued to climb in Q2 2026, rising 10.3% year over year to $18.01 for Uber and 7.1% to $14.99 for Lyft. Uber’s average price is now up 14.2% over two years, due in part to premium tiers’ growing share of trips across both platforms.
Platform fees grew even faster than fares
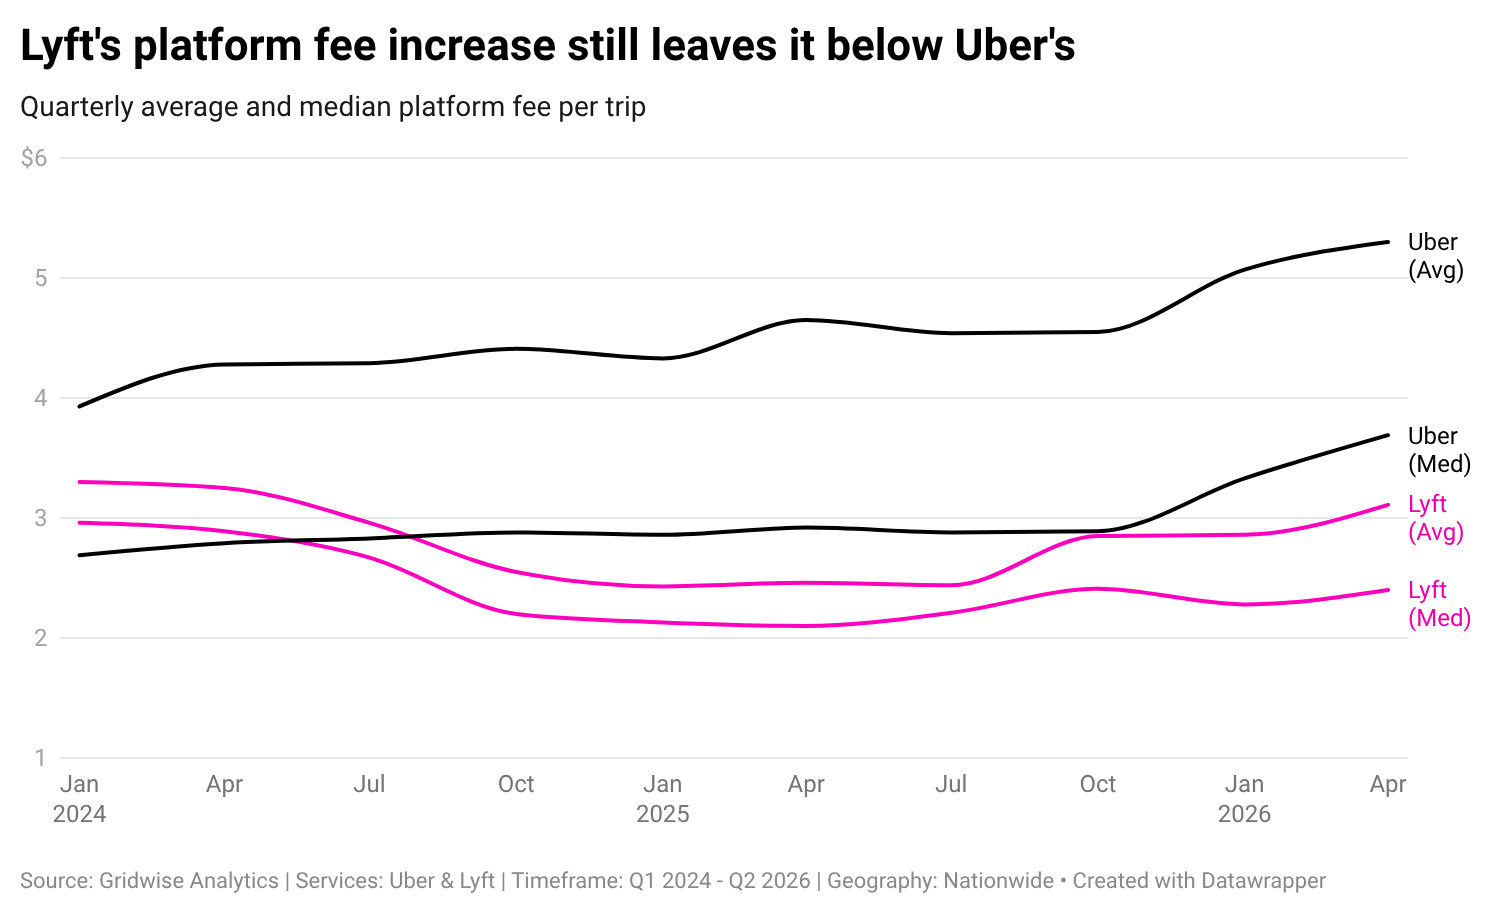
Average platform fees per trip rose 14.0% year over year to $5.30 for Uber and 26.4% to $3.11 for Lyft, outpacing fare growth on both platforms. The shift toward premium rides likely contributed to this increase, along with insurance expenses falling more than 5% per trip YoY in Q1 2026.
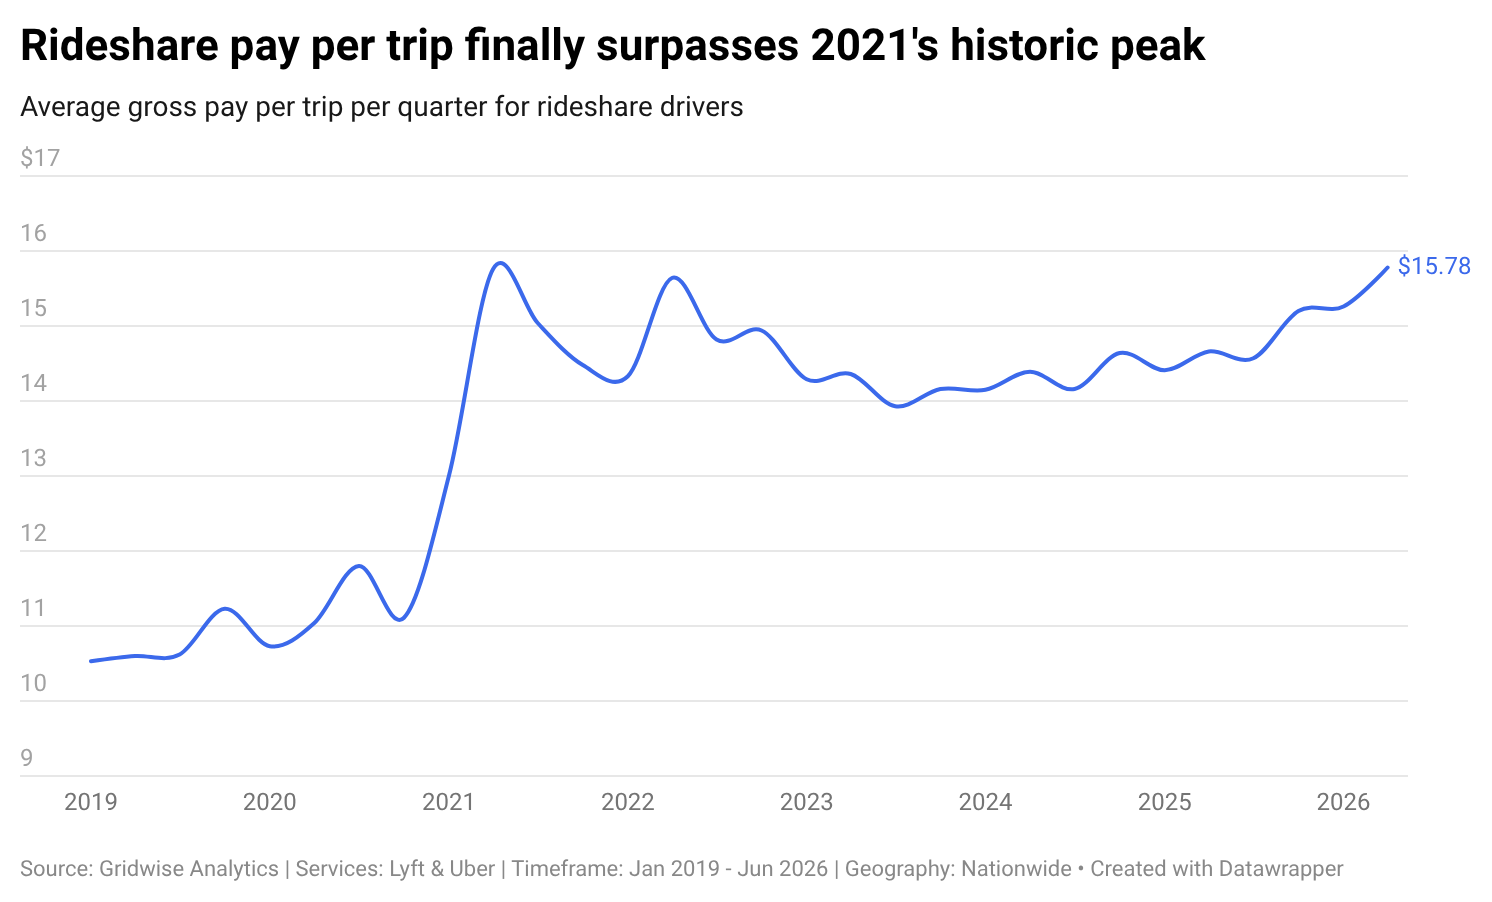
Driver pay set records in Q2, with incentive spending climbing fastest
Average gross pay per trip reached $15.78 in Q2 2026, up 7.6% year over year and past the 2021 peak for the first time in the series. Incentive pay is growing even faster withbonus pay rising 18.2% and non-trip incentives jumping 56.2%, from $53.90 to $84.20.
Estimates based on Gridwise data beat Wall Street consensus
Over the past four quarters, estimates based on Gridwise data beat Wall Street consensus on all six Uber KPIs featured in the report, including a 25% lower median error on gross profit, 0.97% versus 1.30%. On DoorDash, they beat consensus in seven of the last eight quarters across GOV excluding Wolt, monthly active consumers, and average order value.
Understand how rideshare pricing, pay, and platform fees are trending.
Download the full report for an independent view of customer prices, platform fees, premium ride share, driver earnings, productivity, insurance estimates, AV-active markets, and Uber KPI estimates.
In the full report, you’ll uncover:
- Quarterly customer price and platform fee trends for Uber and Lyft, Q1 2024 through Q2 2026
- Premium ride share trends by platform
- Driver pay trends since 2019: base pay, bonus pay, and non-trip incentives
- Working hours, trips per working hour, and utilization
- Insurance fee fluctations across the United States
- The impact of autonomous vehicle fleets in AV-active markets (Los Angeles, San Francisco, Atlanta, Austin)