Gridwise blog
Tips, insights, and advice to help you earn more and work smarter, whether you do gig work, hourly, or shift work.
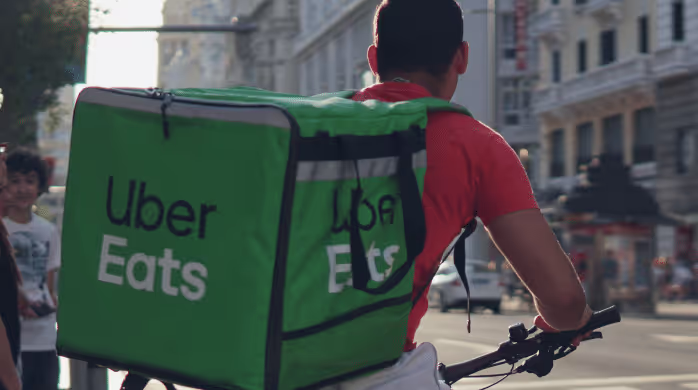
How to Make $1,000 a Week With Uber Eats in 2026 (Tips + Hourly Data)
In this blog, we'll explore the strategies and techniques that can show you how to earn $1000 per week as an Uber Eats delivery driver. We'll cover everything from optimizing your delivery zones and schedules to maximizing your tips and customer satisfaction. Whether you're a seasoned Uber Eats driver or just starting out, this guide will provide you with the insights and actionable steps to take your Uber Eats driver earnings to the next level.
Becoming an Uber Eats delivery partner can be a lucrative opportunity, especially if you're able to consistently earn $1000 a week. By understanding the platform, optimizing your delivery strategies, and focusing on customer satisfaction, you can maximize your earnings and turn Uber Eats into a reliable source of income.
We’ll cover the following topics to provide coaching and ideas to help you push your earnings up to that $1000 per week level:
What do Uber Eats drivers do?
Uber Eats drivers deliver prepared food most of the time, but they also might shop for and deliver goods from convenience outlets and grocery stores. The job is pretty simple. You get a request for an order, you drive to the restaurant or store to pick it up, and then you deliver it to the customer. If you already drive for Uber, you can choose to take orders for Uber Eats delivery any time.
If you’re not an Uber Eats driver yet, it’s pretty easy to become one. This Gridwise post tells you what you need to do if you want to sign up and start making money Uber Eats style. Many rideshare drivers welcome the chance to deliver food rather than people. This article from Nerdwallet covers the Uber Eats gig from that angle.
There are some sweet advantages to working with Uber Eats. In lots of cities you don’t even need to have a car. You can use a bike or a scooter, or even walk, to make your rounds. If you do use a car, Uber Eats’ requirements are a lot easier to meet than they are for Uber rideshare driving.
You also have a lot of flexibility. You can shop and deliver convenience items and groceries, but you don’t have to. And, like most driving gigs, you can choose your own hours, and map out the locations where you want to work.
Use Gridwise features When to Drive and Where to Drive to help you figure out what work hours and which specific areas will be the most profitable for you. Real data from real delivery people will show you earning patterns for drivers in your town.
How much can you earn doing Uber Eats?
The honest answer to this question is: basically, as much as you want! It all depends on how many hours you put in and how strategic you are about your gig. Earnings vary from one area to another, as this article from Entrepreneur points out. To give you a baseline, let’s look at the earnings of Uber Eats drivers who tracked their earnings with Gridwise.
Remember that these numbers show us only average earnings. To make $1,000 a week with Uber Eats, you’re going to have to be better than average, and we’ll show you how. For now, though, it’s good to have these figures so you get a ballpark number of where to start.
How much do Uber Eats drivers make?
Gridwise data tell us the following:
- Monthly earnings average around $444.00 per month.
- Gross earnings per trip are between $9.00 and $10.00.
- Tips make up about 50% of most Uber Eats drivers’ income, which amounts to about $225.00 per month.
Is Uber Eats good money? It can be. While there are other gigs that pay more per trip, if you drive for Uber Eats, you’ll always be pretty busy.
https://datawrapper.dwcdn.net/HPAz8/3
You can also see that, unlike many other gigs, tips play a huge role in Uber Eats earnings.

With these numbers as a baseline, what can we say about how to earn $1,000 a week with Uber Eats? As we said in the introduction, it’s going to be a hustle, but it’s really possible. To figure out how to make the most money with Uber Eats, let’s start by looking at how many trips these “average” drivers made each month.
We know that average gross earnings were $444.00 per month, and drivers got around $10.00 per trip. That means they took 44 or 45 trips per month, which breaks down to 11 trips per week. That’s not a lot of Uber Eats delivery, is it?
The fact that Uber Eats drivers averaged so few trips shows us that many drivers use more than one app at the same time. This is called multi-apping, and you can learn more about it in this Gridwise post. If you want to answer the question of how much you can make with Uber Eats, then you need to stick with the app and keep plugging away at those orders. You also need solid strategies, as well as some inside tips and tricks.
How to make the most money on Uber Eats: Delivery driving tactics
Getting to that $1,000 a week with Uber Eats isn’t so hard when you remember that the drivers we saw making about $111 a week were only taking around 11 trips in the same time period. That’s not much at all! If you work the Uber Eats app like a boss, you’ll soon have many more trips than that, easily reaching the number needed to get you to $1,000 a week. Now, let’s get to some tactics you’ll need to make that kind of bank.
- Stay with the Uber Eats app, and track your earnings. Gridwise can easily do that for you. Simply sync your Uber Eats app with Gridwise, and you’ll be able to see how much you’ve earned with Uber Eats, what times were most profitable, and your average hourly pay. Racking up trips with Uber Eats has other benefits, including perks and bonuses that are awarded to top drivers.
- Leverage surge pricing and promotions. Surge pricing is applied when there is a lot of demand. When surge pricing is in effect, many of the trips you make will pay more than usual. Promotions are offered to drivers who complete a given number of trips in a certain time period. High traffic volume days, nights, and times give you these chances to get extra earnings. Challenging yourself to complete the right number of trips for promotions will add to the number of trips you can count on for big bucks, too. Learn more about Uber Eats surge pay, boosts, and promotions in this Gridwise blog post.
- Say yes to doubling up on orders. With Uber Eats, you can get back-to-back orders or receive batched orders. Back-to-back orders happen when you receive a new request while you’re on the way to deliver an original order. The Uber Eats app routes these trips automatically, so you won’t be sent out of your way.
Batched orders are Uber Eats’ way of bundling together orders from either the same restaurant, or two nearby eating establishments. You get money, and trip count credit, for all the orders you complete, plus customer tips, without having to make a bunch of separate trips.
- Turn on the charm and get bigger tips. Being nice really is part of the Uber Eats driver’s job, and getting tips is one way people who drive for Uber Eats make money beyond their basic pay.. Bring along those extra napkins and condiments, use equipment that keeps food and drinks at the right temperatures and prevents spilling, and consider your customers’ needs. If you deliver groceries, be extra careful with delicate items such as bread and eggs.
And, most important, follow your customers’ directions, and stay in communication with them if you are going to be delayed, or if you have questions about their order. This Gridwise post will tell how to get bigger tips as a delivery driver.
- Use even more charm to keep your ratings high. As an Uber Eats driver, you will be rated by the restaurant or store where you pick up the orders as well as the customers who are waiting for the deliveries. This two-way rating system is designed to keep you on your toes, so Uber can keep people satisfied with your service. Don’t worry, you get to rate them, too.
There’s another reason why your rating as a driver is important. It not only keeps you in good standing with Uber; it helps you to qualify for the Uber Eats Pro incentive program. To learn more about Uber Eats Pro, and what it takes to earn perks such as preferred services, discounts, and deals, check out this Gridwise blog post.
Smart business moves that seal the deal
Now that you know how to gobble up the deliveries you need to make $1,000 a week with Uber Eats, it’s going to be a breeze to get there. Let’s make it even easier, with business moves that boost your earnings and shrink your expenses. If you use these, it will also be easy to say yes when people ask, “Can you make good money with Uber Eats?”
Minimize expenses. Avoid racking up big fast-food bills by bringing your own food and beverages. You might not think you’re hungry when you first start your Uber Eats run, but once the aroma of pepperoni pizza, premium cheeseburgers, and piping hot fries start wafting through your car, that might change. Bring a sandwich or other healthy food from home, and buy bottled water in bulk to save tons of cash compared to what it costs to buy single servings.
Maximize tax deductions. Another way to minimize your expenses is to maximize your tax deductions. Start by tracking mileage with Gridwise.
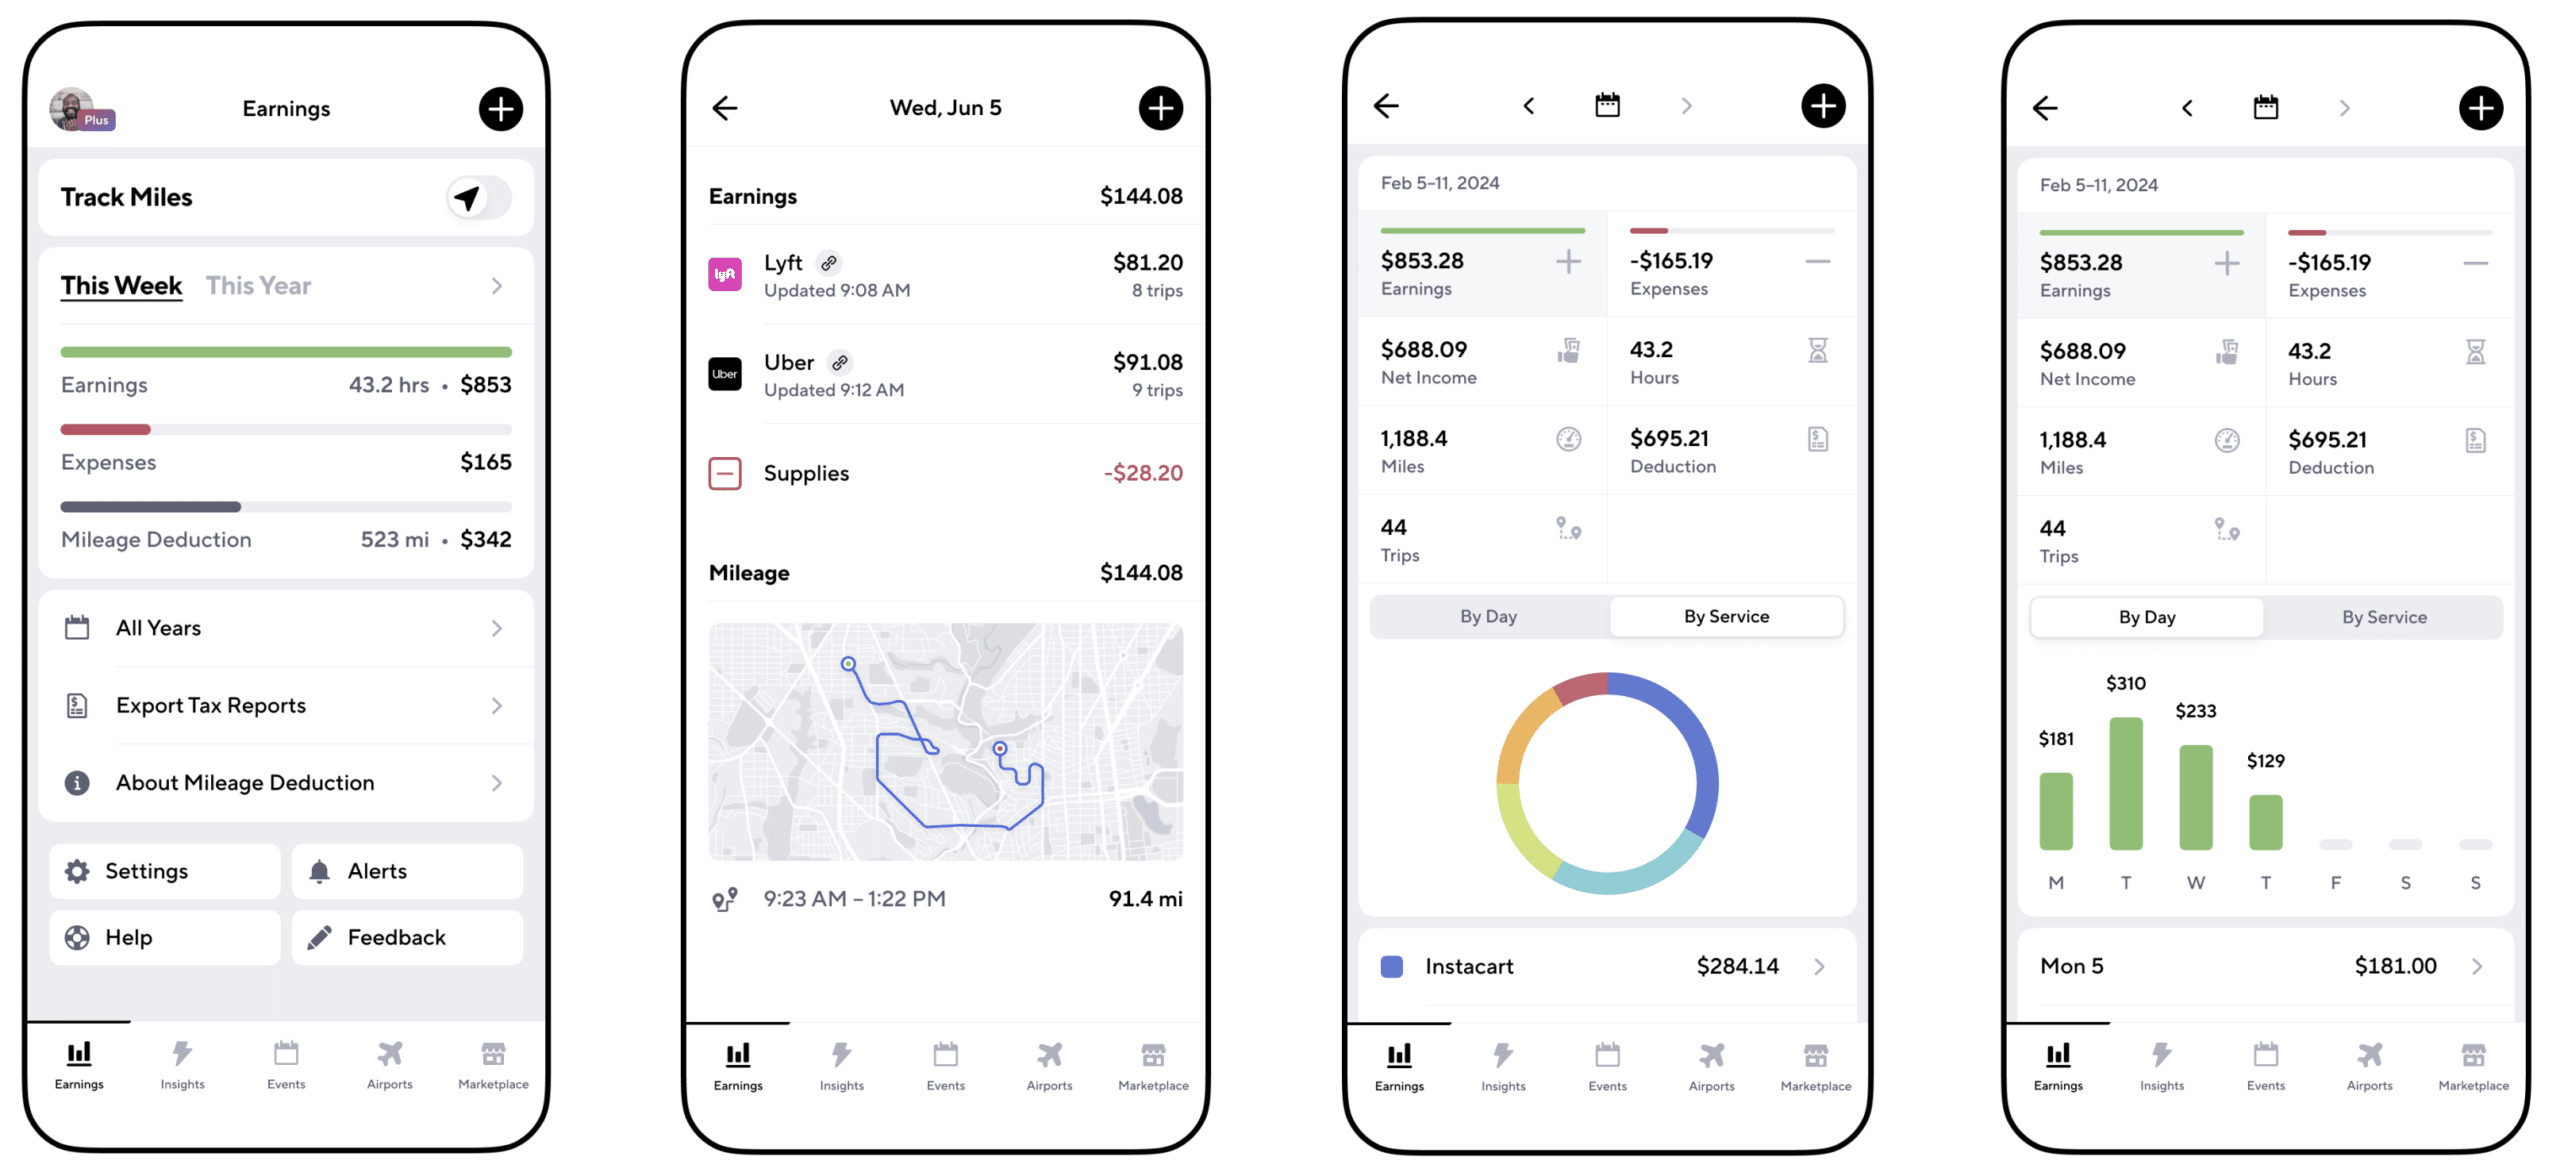
Gridwise App
Gridwise captures every deductible mile you drive, including the distance you cover between the trips your driving app records. Know what expenses you can deduct, and put them to work for you when tax time comes. Learn more about tax deduction strategies in the Gridwise Tax Guide for drivers.
Boost earnings with referrals
As an independent contractor, you’re probably looking for ways to make even more money than you can with Uber Eats. And most gig workers like you enjoy getting passive income. With Uber Eats, there’s a really easy way to do that, referrals!
All you need to do is find friends and encourage them to deliver for Uber Eats. If they make a certain number of deliveries within a specified time, you will get paid for doing nothing more than having them sign up under your referral code! Rates of pay vary by city, so check your Uber Eats app to find out what the current deal might be, and learn more about the referral program on the Uber Eats website.
Also remember: “friends” don’t have to be your best buds. Many delivery people carry cards with a QR code linking to their referral information, so just about anyone you encounter can join Uber Eats and boost your earnings. You could meet a source of passive income at the gas station, on social media, or at your high school reunion. The more you hustle, the more there is to gain, right?
Master the art of self-employment
As an Uber Eats driver, you’re an independent contractor. That means the company isn’t going to withhold your taxes, provide insurance, keep track of your earnings, or tell you about tax deductions. You’ll have to do all these things for yourself.
If you want to maximize your tax advantages, open an official business entity. You can incorporate (create a corporation) or you can work as a limited liability corporation (LLC). You can also work with a DBA (Doing Business As) arrangement, but the corporation or LLC will do a better job of protecting you from liability.
Establishing a corporation or LLC offers better tax advantages than being a sole proprietor. For instance, if you simply collect your earnings into your private account, you’ll be charged self-employment taxes in most states. And paying extra taxes is something we all want to avoid, within legal limits, as much as possible.
Every Uber Eats driver needs to learn about self-employment, and there are some great resources you can review. Check out the CareerOneStop website about self employment which will help explain the basics. You can also check with a professional tax accountant, or look other websites to learn more about actually creating a business.
Scope out your market
Look at the area around you to see where you’re likely to get the most deliveries. Where are all the restaurants? Where might people be more inclined to order deliveries? What hours do you want to drive? What activities might be going on around those times? Think about late-night and after-school times as well as breakfast, lunch, and dinner times.
Be realistic about the potential for your area and aware of new services opening up. For example, in New York, there is already a tab on the Uber Eats app that allows customers to order groceries. In our article about the best food delivery service to work for you’ll see that Uber Eats stacks up well against other delivery companies, mainly because of its potential for expanded opportunities for drivers to earn.
So, is Uber Eats good money? As we said, it isn’t an automatic guarantee that everyone will make $1,000 a week with Uber Eats. Trying out the suggestions we give you here, though, should put you on the right track! Go out there and start stacking up those orders and raking in some impressive earnings!
Get more inside information on Uber Eats in these posts from the Gridwise blog:
- The delivery driver guide: Using the Uber Eats app
- Everything you need to know about driving for Uber Eats
- Uber Eats Pro: What drivers need to know
- Looking for a different gig, part-time or full time job? Check out the Gridwise Job board.
Uber Eats FAQ
How does the Uber Eats platform work for drivers?
Uber Eats is a food delivery service that connects customers with local restaurants and independent delivery partners. As an Uber Eats driver, you'll receive notifications of nearby delivery requests, which you can accept and complete. The platform provides flexibility, allowing you to work on your own schedule and earn money based on the number of deliveries you complete.
What are the requirements to become an Uber Eats delivery partner?
To become an Uber Eats delivery partner, you'll need to meet certain requirements, such as having a valid driver's license, a registered vehicle, and passing a background check.
How can I choose the right delivery zone to maximize my earnings?
Selecting the right delivery zone can significantly impact your earnings, as some areas may have higher demand and better-paying orders. It's important to research and identify the zones in your area that tend to have the most consistent and lucrative delivery opportunities.
How can I take advantage of peak delivery hours and surge pricing?
Understanding peak delivery hours, such as mealtimes and weekends, and taking advantage of surge pricing can boost your earnings. Be aware of when demand is highest in your area and adjust your schedule accordingly to capitalize on these peak periods.
What are some tips for maximizing tips and customer satisfaction?
Providing excellent customer service and going the extra mile to ensure a positive experience can lead to more tips and repeat business. Prioritize communication, timeliness, and attention to detail to keep your customers happy and satisfied.
How can I set realistic weekly goals to reach my $1000 target?
To make $1000 a week with Uber Eats, it's essential to set realistic weekly goals and track your earnings and expenses. Start by determining your target earnings and breaking it down into achievable daily or weekly goals. This will help you stay on track and make adjustments as needed.
What are some strategies for efficient route planning and navigation?
Effective route planning and navigation can save you time and fuel, allowing you to complete more deliveries. Utilize mapping apps and take advantage of features like real-time traffic updates and turn-by-turn directions to find the quickest routes.
How can I balance my Uber Eats deliveries with other commitments?
Develop a schedule that allows you to capitalize on peak delivery hours while still maintaining a healthy work-life balance. Consider using tools like calendar apps to plan your availability and track your hours to ensure you're maximizing your earning potential without sacrificing your personal life.
What are the key considerations for maintaining my vehicle as an Uber Eats driver?
Keeping your car clean and well-maintained is crucial for maximizing your Uber Eats earnings. Regularly scheduled oil changes, tire rotations, and other preventive maintenance can help extend the life of your vehicle and minimize downtime. Additionally, budgeting for vehicle-related expenses, such as fuel, insurance, and repairs, will ensure you're accounting for these costs and maximizing your net earnings.
What are the tax obligations and legal considerations for Uber Eats drivers?
As an Uber Eats delivery driver, it's essential to understand the tax obligations and legal considerations that come with being an independent contractor. This includes properly reporting your earnings, deducting eligible business expenses, and making quarterly estimated tax payments. Additionally, you'll need to ensure you have the appropriate insurance coverage, such as personal auto insurance and possibly commercial auto insurance, to protect yourself and your vehicle while on the road making deliveries.

The Gridwise Job Board: Find Your Ideal Job or Gig Work
Gridwise is an essential assistant app created by gig workers for gig workers. Our mission is to support those engaged in gig work in every way possible. We understand how challenging it can be to deal with income instability, a lack of benefits, and job insecurity that often comes with gig work. The Gridwise app tracks and organizes earnings and expenses, and offers a wide array of discounts, deals, and services that make the lives of independent contractors easier and more rewarding.
We firmly believe it’s possible to make a viable living and create a gig experience that offers flexible hours, variety, and excitement. With issues such as consistent earnings and job security in mind, Gridwise is proud to offer a centralized platform that shows you how to find gig work and secure reliable opportunities. We’re proud to introduce the Gridwise Job Board.
The Gridwise Job Board: Key features
Because Gridwise is dedicated to serving the gig worker community, we’ve filled the Gridwise Job Board with useful features that won’t waste your precious time.
- Comprehensive listings. Find part-time, full-time, temporary, and per-task work. Drive or deliver with your vehicle, utilize an employer’s vehicle, or even find non-driving gig work.
- User-friendly interface. Find the jobs that are right for you with a tap of your screen.
- Verified opportunities. We vet the jobs before they are listed to ensure you’re getting high-quality job postings.
How to get more gig work, seasonal, part-time or full-time jobs with the Gridwise Job Board
Looking specifically for “gig work apps” or “gig jobs near me?” You’re in luck. Our filters and search functions send you directly to the listings you seek.
Here’s how it works.
- Access the Job Board via the Gridwise website.
- Search for jobs by type, location, and more.
- Select the job that interests you, and read all about it.
- Scroll through the description, and if it appeals to you, click “Apply for job.”
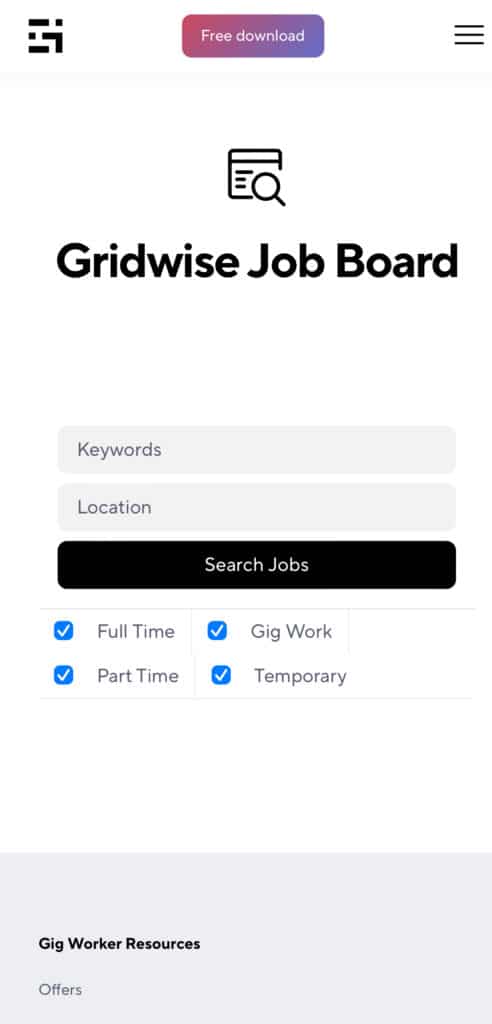
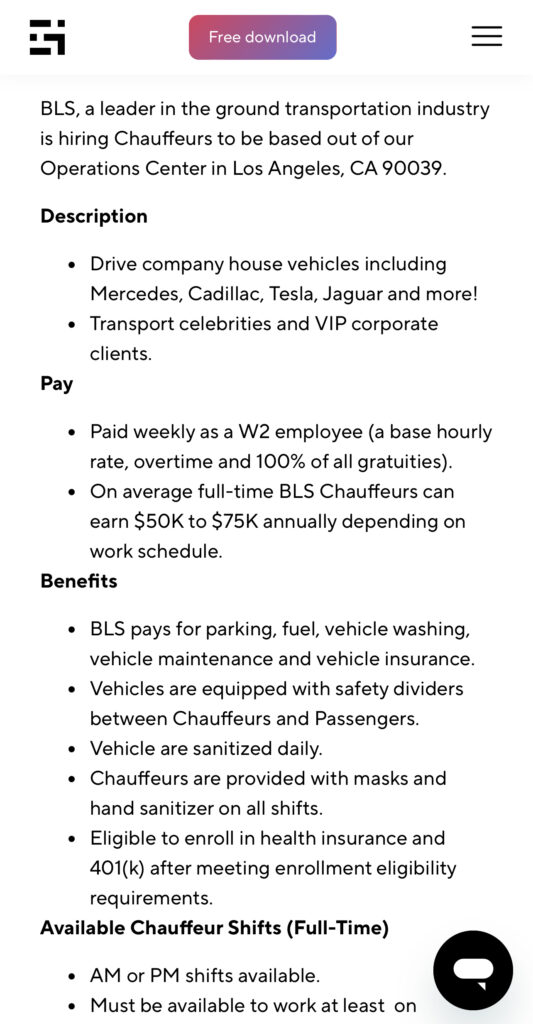
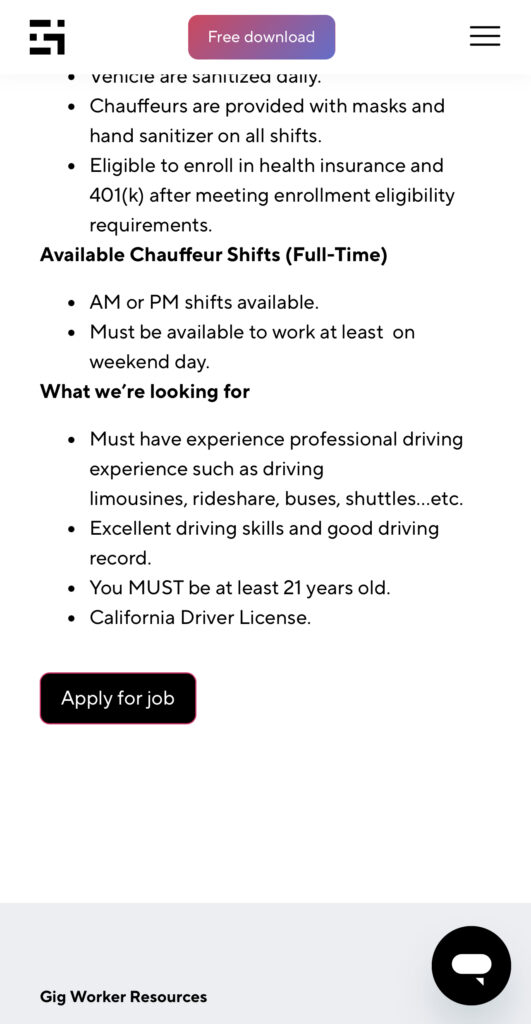
Many types of jobs are available. Adjust the search filter to see the full variety of opportunities that will let you cash in. Deliver food, set up catering, do rideshare driving, get paid for doing package delivery, and much more. You’ll find short-term gigs, long-term contracts, and part-time positions.
Perks of the Gridwise Job Board for gig workers
Gig workers who know how to make extra money will appreciate how the Gridwise Job Board lets you multiply your chances of bringing in big earnings. Here’s how:
- Increased stability. Use the Gridwise Job Board to find part-time or permanent jobs in addition to the part-time gigs you already have. Always keep a steady stream of earning opportunities flowing toward you.
- Flexibility and autonomy. Choose jobs that fit your schedule, work around other jobs and family duties, and still leave room for some fun in your life. Discover side hustles to supplement your full-time job, permanently or just for the season.
- Skill development. Find part-time work that lets you use a skill you already have, or try your hand at something new. It’s a smart way to develop a portfolio to showcase what you can do, or even to find permanent employment.
Get Gridwise and stay up to date on the Gridwise Job Board
Gig workers need plenty of information and assistance, and Gridwise is here to give it to you. Download the app and get essential features such as
- seamless earnings tracking
- mileage tracking
- expense recording, including notes
- low-cost and no-cost insurance benefits
- access to affordable medical, dental, vision, mental health, and alternative care
- professional services including legal and financial help
- deals and discounts
- weather, events, and traffic reports
- inside information on where and when to drive
More to know about gig work:

5 Best Mileage Trackers For Gig Drivers
Many drivers ask, “Do I really need a mileage tracking app?” The answer is simple: only if you want to have an accurate count of all the miles you can legally deduct from your taxable income! You might think your rideshare or delivery driving app has got you covered. After all, they do quite a good job of logging the miles you drive while you’re on a trip or delivery. But, if you want to have the best app to track mileage for Uber, Lyft, Doordash, Instacart, or the other apps you may use, you need more. Why is that?
Without a separate tracker, you’re missing the miles you drive in between pings. Did you realize that all the miles you drive, from the moment you begin your shift until it’s over (as long as you don’t drive several miles on a break to hang with your friends), are tax deductible! That means you need something besides your driving app to keep an accurate count of your travels. Read this Gridwise post to see how important it is to keep track of every deductible mile.
You won’t be surprised to hear that there’s an app for tracking miles. In fact, there are several of them. Here, we’re going to tell you about five top mileage tracking apps, and help you figure out which one is best for you.
Before we get to the list and identify the best mileage tracker app, let’s clarify what exactly a mileage tracking app is. According to G2.com’s technology glossary, mileage tracking is done for the purpose of keeping a log of mileage that is either reimbursable or tax deductible.
And yes, of course you can track your miles simply by taking readings on your odometer. But are you really prepared to account for how many miles you drove for personal reasons and subtract them from the total to get your business mileage? Even if you can remember all that and do the arithmetic, if you want an accurate reading of the miles you drive for business, and can therefore deduct, a mileage tracking app will save you a lot of trouble and prevent you from making costly errors.
Plus, as a gig driver, you have specific needs when it comes to a mileage tracker. Ideally, you’d be able to handle mileage tracking and several other functions all in one app. It can be maddening enough to deal with driving apps, particularly if you’re an avid multi-apper. You would want your mileage tracker app to help you keep account of other aspects of your business, including income, expenses, and inside information about the art of gig driving.
Not all mileage apps are equal, to be sure! Let’s look at five of the best apps to track mileage and figure out which is the best app to track mileage with Uber and Lyft, or what mileage tracker app is best for DoorDash.
1. Zoho Expense
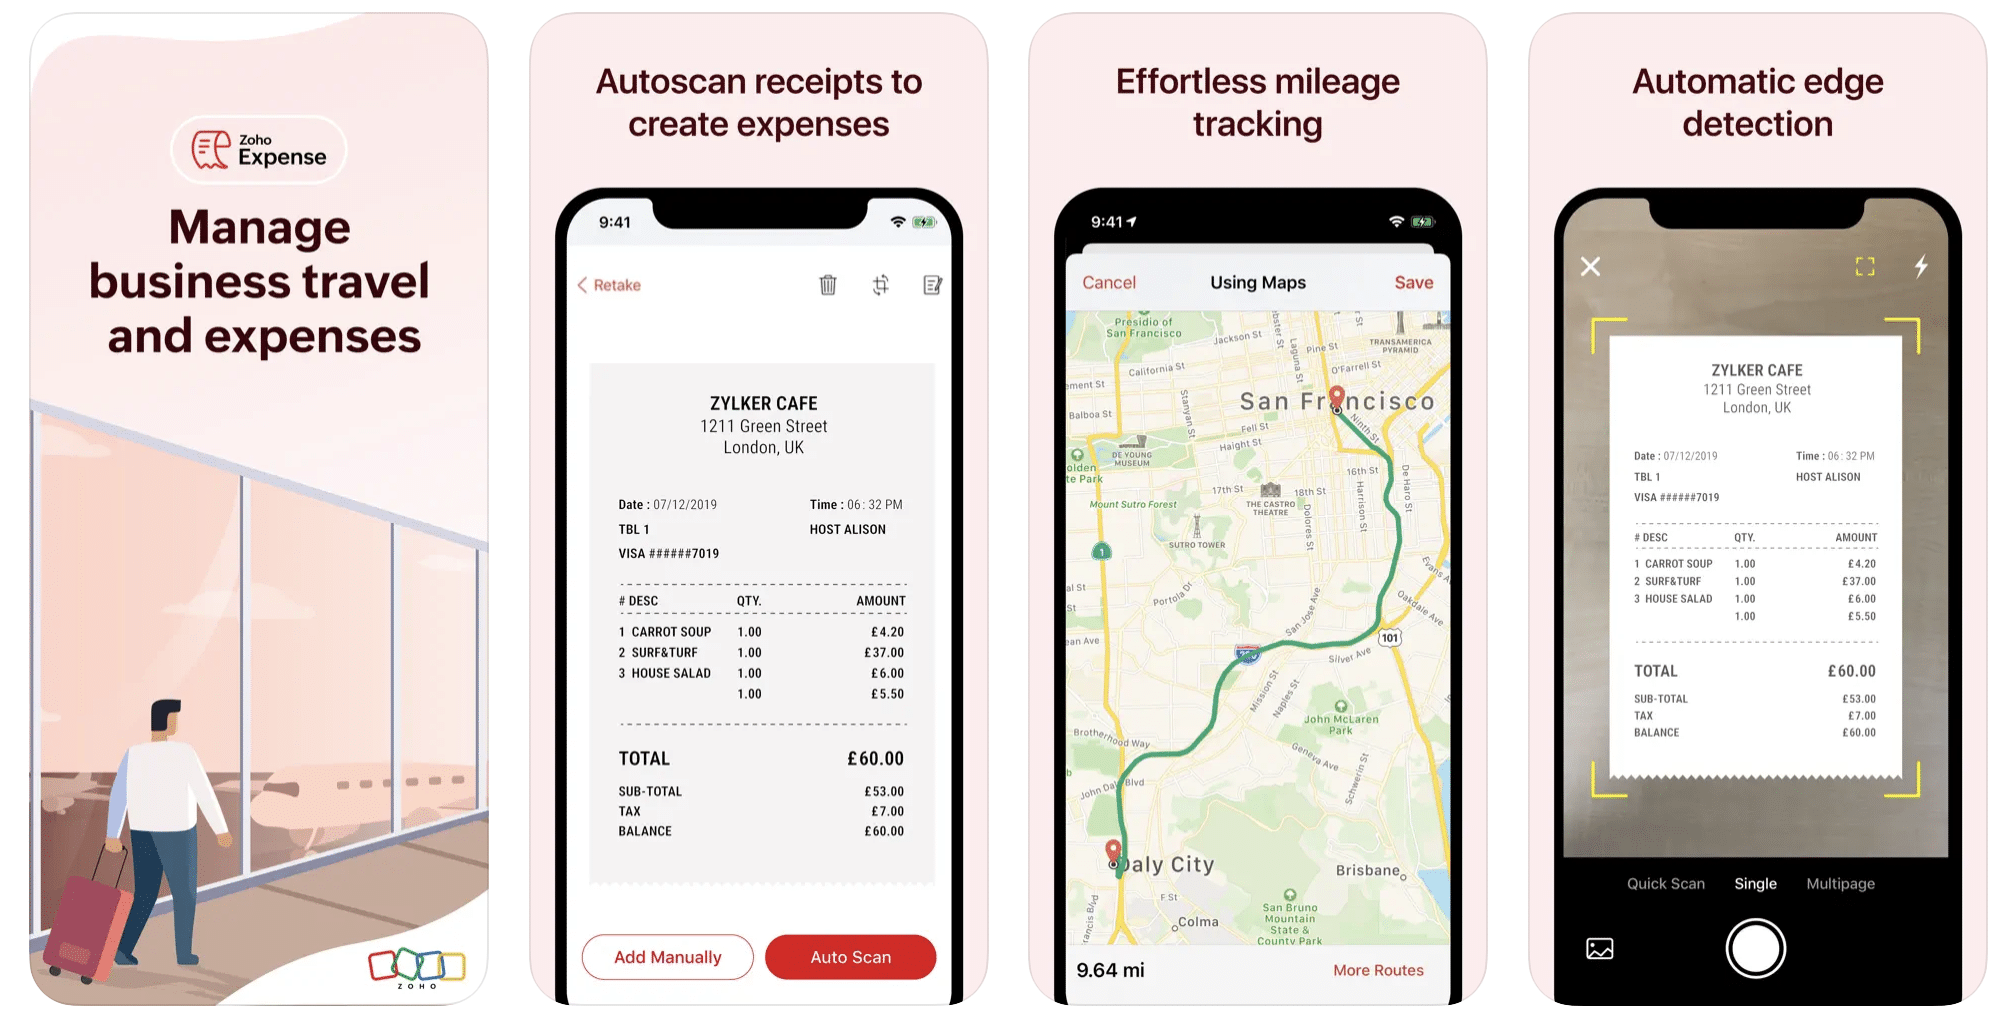
First up is Zoho Expense, which does exactly what its name says. This app is designed to allow companies to give employees a uniform way to create and submit expense reports. It can be used by individuals, including gig drivers, as well.
It includes a mileage tracker, as well as features that let you track other deductible expenses, including the ability to scan and record receipts.
Available on Android and Apple: Yes
Ratings: 4.8 stars on App Store, 4.7 stars on Google Play
Free Version: Yes
Subscription price: $3 per month, billed annually
Created specifically for gig drivers: No
2. Quickbooks Online
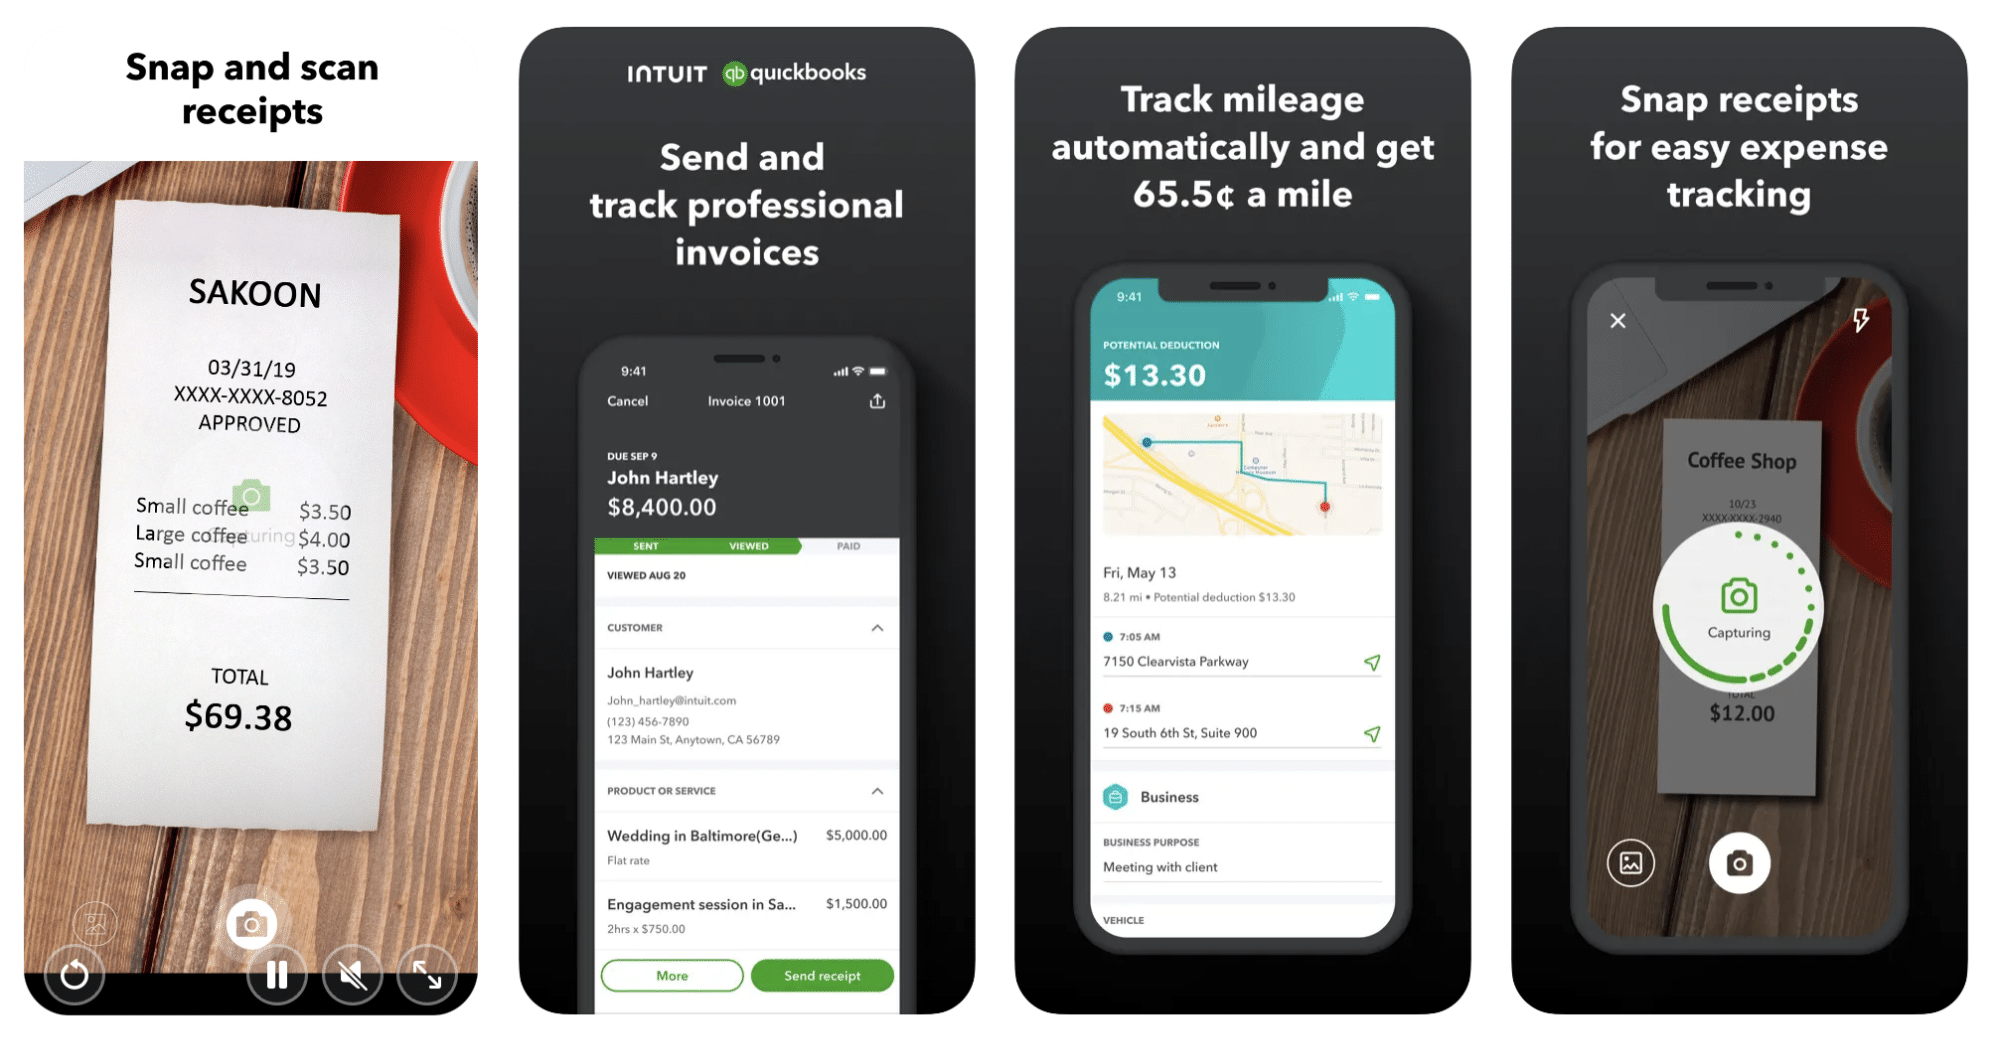
Quickbooks Online is a cloud-based app that allows you to track your mileage, earnings, and expenses. The information you enter can then be used to generate various reports that prepare you for tax time. It also allows you to create graphs that illustrate your cash flow, and includes a receipt scanner so you can instantly record deductible expenses. Quickbooks is popular, highly reliable, and designed mainly to help people keep track of their small businesses.
Available on Android and Apple: Yes
Ratings: 4.7 stars on App Store, 4.4 stars on Google Play
Free version: 30-day free trial
Subscription price: $15 per month for basic version if purchased for 3 months or more
Created specifically for gig drivers: No
Source: quickbooks.intuit.com
3. Shoeboxed
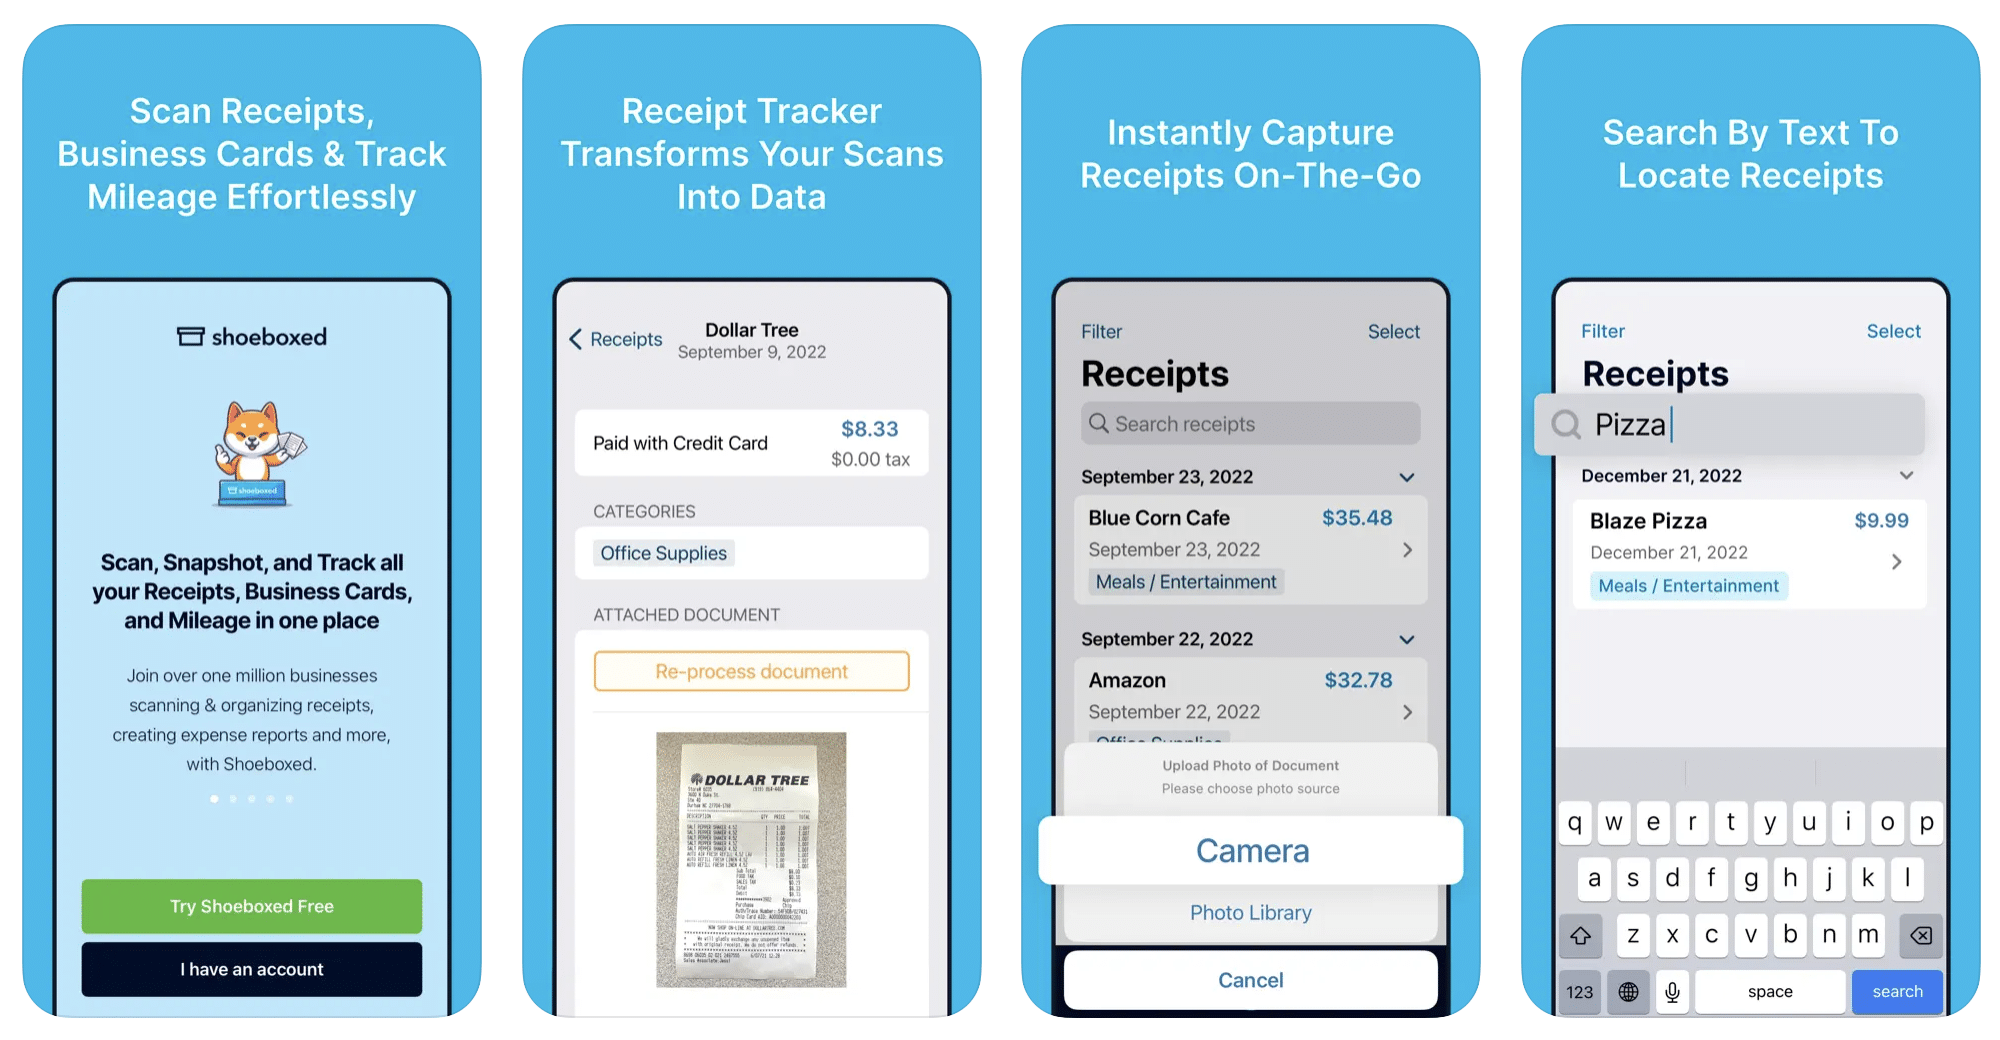
Shoeboxed started in 2007 as a service for scanning paper receipts into digital form. Now the app offers a free mileage tracker and has enabled users to scan receipts directly. It touts itself as the best mileage tracking app for DoorDash, but there are some elements missing that Dashers might like to have. While it provides features that record your expenses and prepare you for tax season, it doesn’t automatically track your earnings. The mileage tracker has a system where you can drop pins along your routes to make the tracking more precise, identifying those legs of a trip that you make for business purposes. The mileage tracker is “free” once you sign up for the basic version.
Available on Android and Apple: Yes
Ratings: 4.5 stars on App Store, 2.3 stars on Google Play
Free version: No
Subscription price: $18 per month for basic version
Created specifically for gig drivers: No
Source: blog.shoeboxed.com
4. Stride
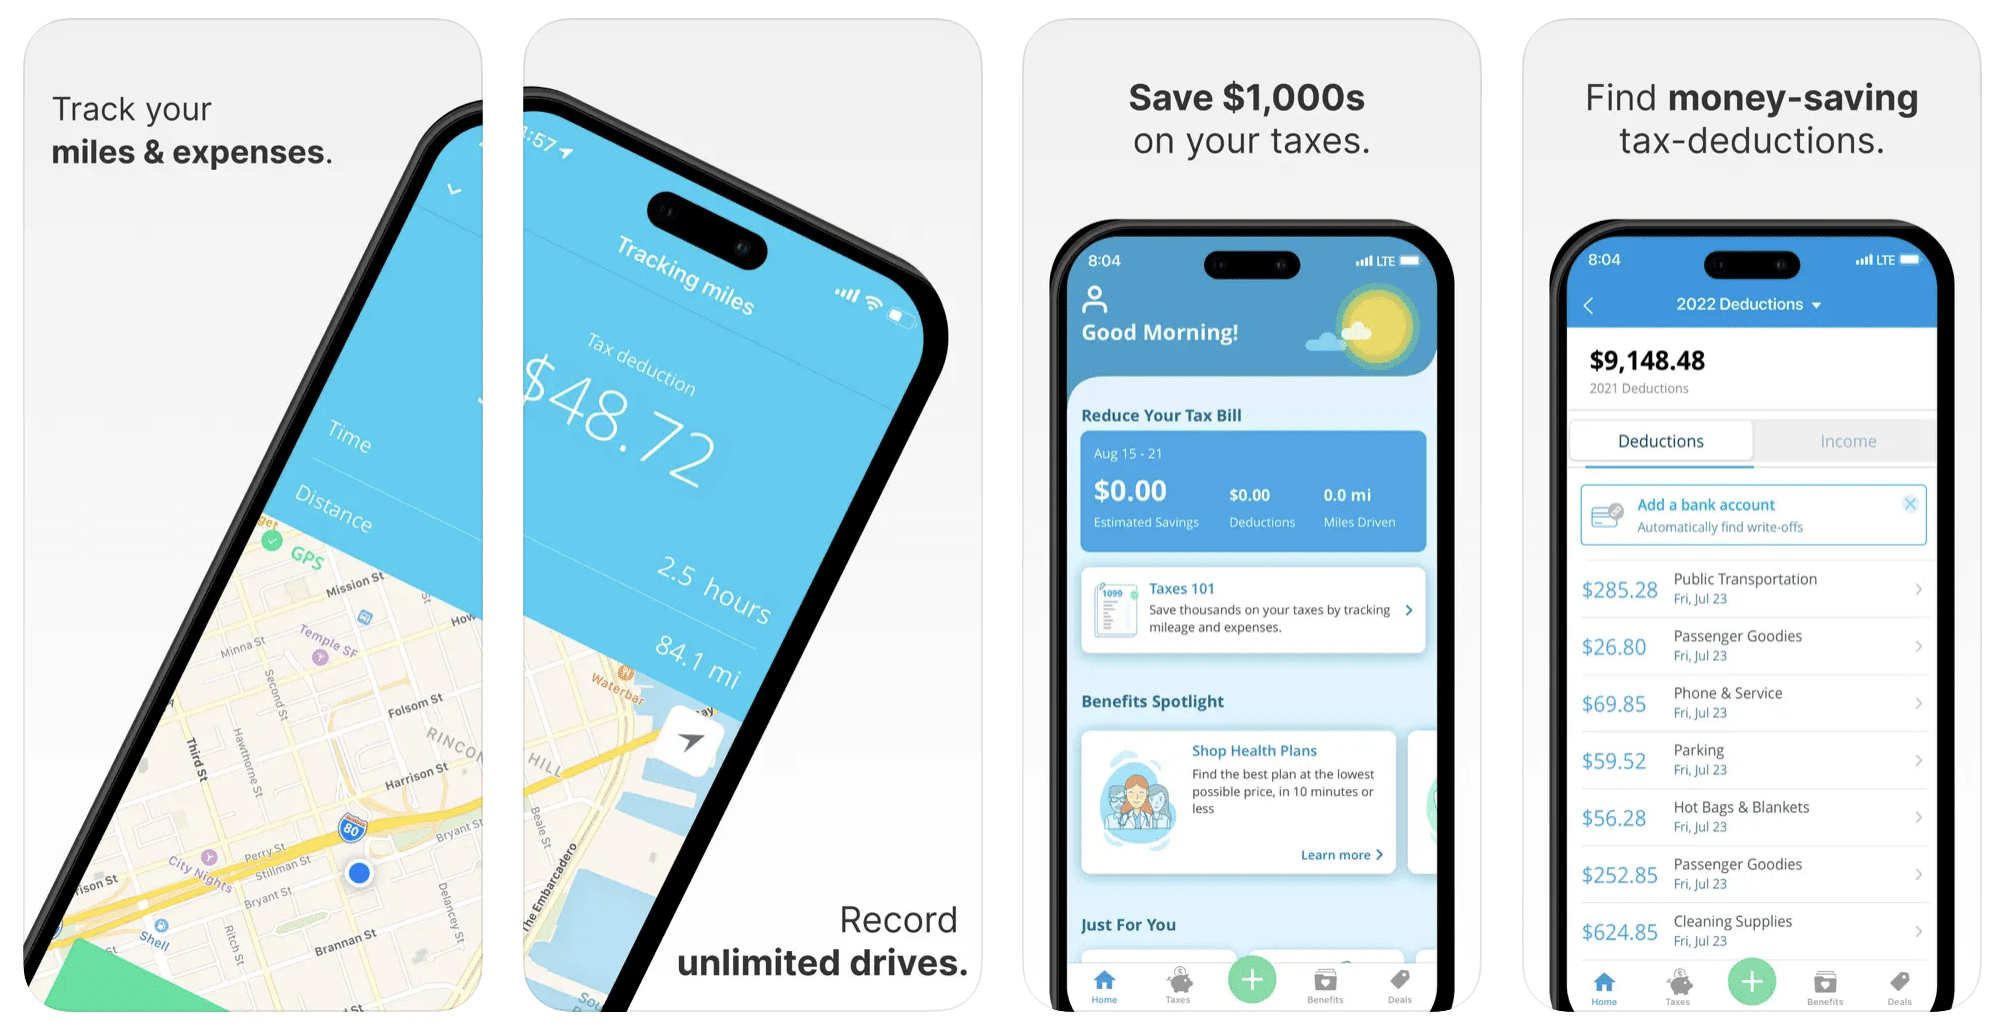
This free mileage tracker does a fair job of keeping track of the distances you rack up while gig driving, but it doesn’t automatically track earnings. It can be a big help, though, in tracking your expenses. You can link Stride to your bank account, and it will automatically scan your expenses to identify items you can potentially deduct. The app is totally free. This could make it the best free mileage tracker app, but there is a small price to pay. The app will persistently push you to consider various insurance plans that they are affiliated with. If you don’t mind that, this is a solid mileage tracker, even if it doesn’t track your earnings.
Available on Android and Apple: Yes
Ratings: 4.8 stars on App Store, 4.6 stars on Google Play
Free version: Yes
Subscription price: None. The app is free.
Created specifically for gig drivers: No
5. Gridwise
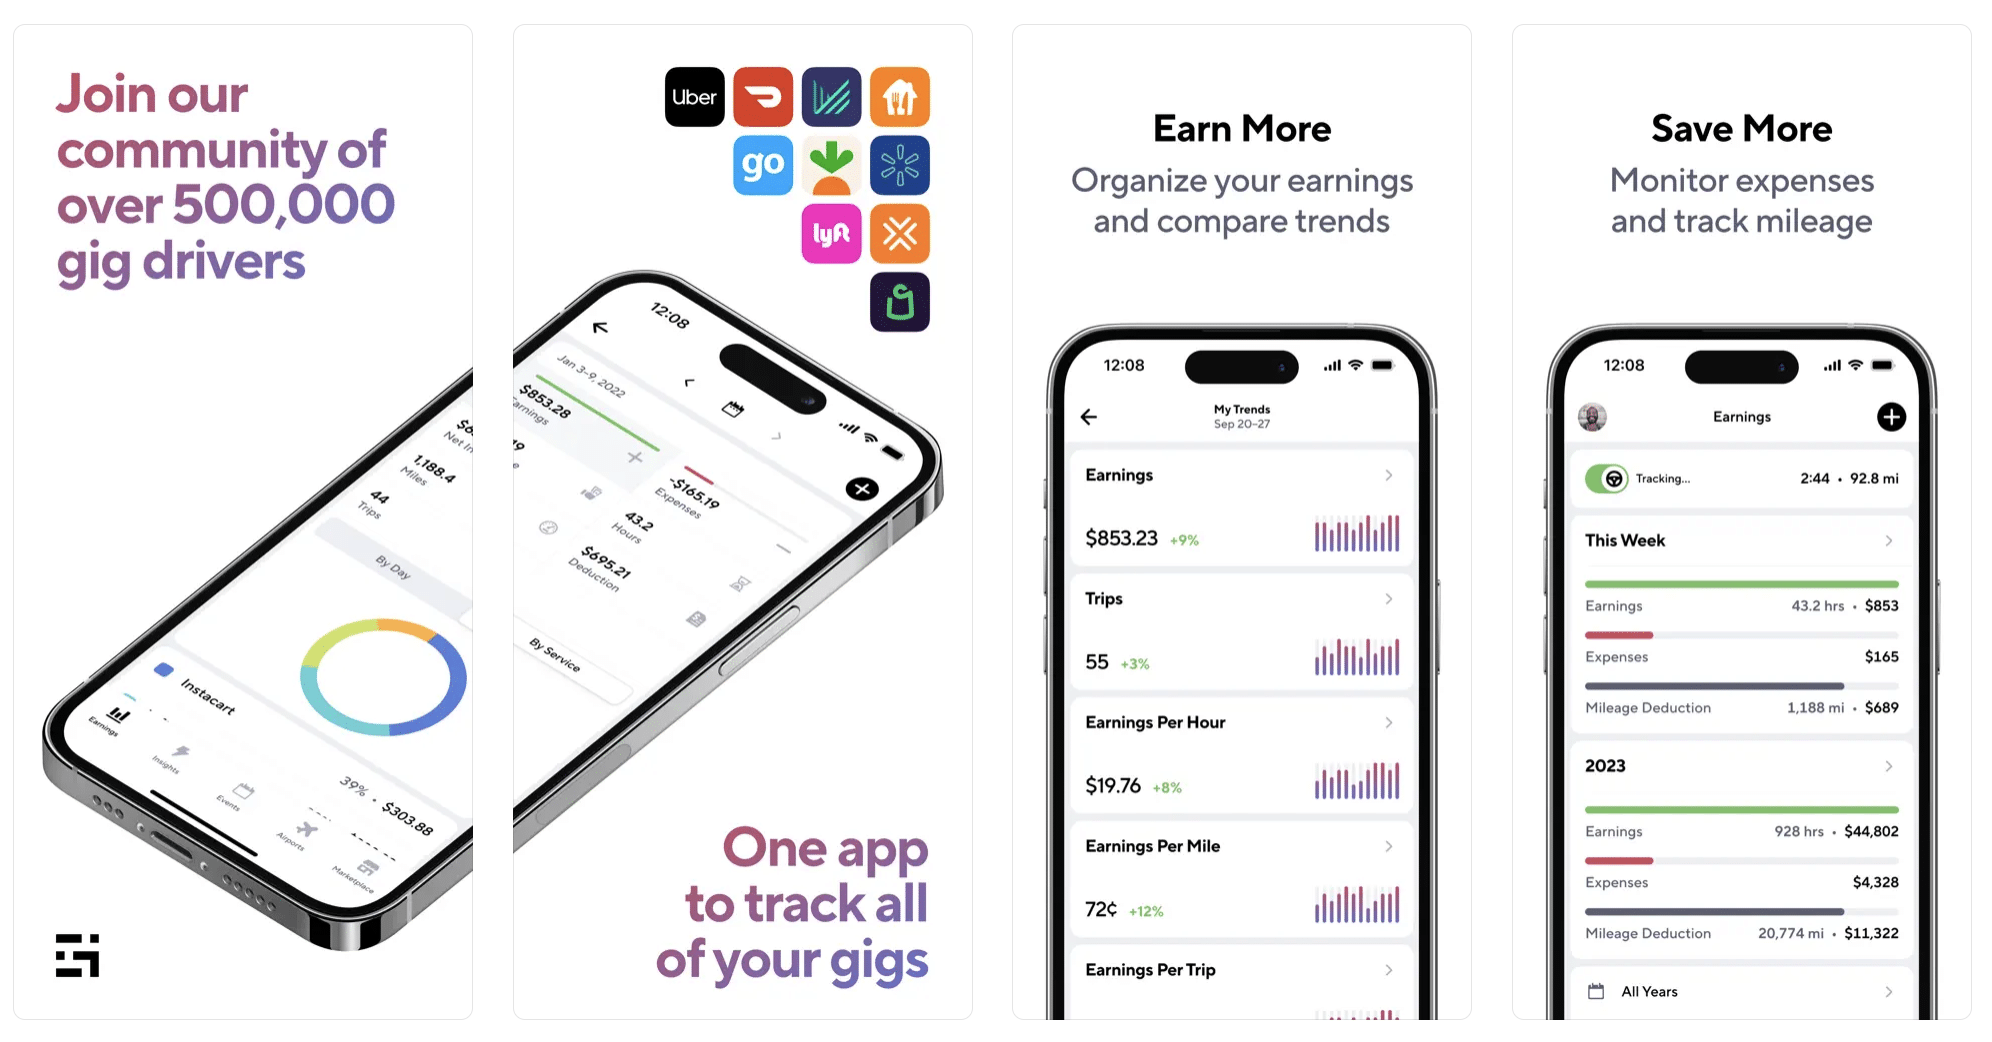
Gridwise has a free mileage tracker and free features that record your income and expenses. It gives you access to insurance and benefits, as well as insights about the best times and places to make the most money while gig driving. The Gridwise mileage tracker captures all the miles you drive while you’re on your driving shift, and it can be used if you have other trips you need to make which qualify as business travel.
Drivers love it because it is geared toward the needs of rideshare and delivery workers, providing free information about airport departures and arrivals, event start and let out times, weather, traffic, and more. The Gridwise Plus subscription adds value by providing additional insights and reports, discounts on benefits, the ability to export data in .csv format,, and more.
Available on Android and Apple: Yes
Ratings: 4.9 stars on App Store, 4.6 stars on Google Play
Free version: Yes
Subscription price: $9.95 per month for Gridwise Plus, or $95.99 per year (a $23.41 savings)
Created specifically for gig drivers: Yes!
What is the best mileage tracking app?
Now that we’ve checked them all out, we’re positive about the answer to that. Hands down, it’s Gridwise. Are we biased? You bet we are! But drivers love it too. Gridwise is the best mileage tracker app, and so much more. So many of the features are free, and the subscription to Gridwise Plus will pay for itself with additional insights to boost your earnings and deeper discounts on products and services.
Most important, Gridwise is designed specifically for gig drivers by experts who were once gig drivers themselves! Knowing what gig drivers need is a crucial step in creating an app that rideshare and delivery drivers can really use! Here are a few of the features, besides mileage tracking:
- seamless earnings tracking
- automatic, on/off toggle and manual mileage tracking
- mileage categorization
- airport, traffic, weather, and events information
- insights into where to drive and when to drive
- reports showing earnings across the platforms you use
- discounts on countless products and services for drivers
- additional resources for finding side gigs
- an informative and comprehensive blog
- affordable benefits, including insurance, medical, dental, and alternative practitioner discounts
- a community of drivers just like you
Don’t settle for just any app. Get the best mileage tracker, and so much more, from Gridwise!

Will Uber See a Q4 2024 Profit Surge? Here Are the Metrics to Watch
As Q4 2024 approaches, anticipation builds around Uber’s financial performance, particularly as the gig economy faces evolving regulatory, competitive, and demand-driven shifts. Investors and analysts closely monitor Uber’s ability to close the year profitably.
With data-driven insights, we can explore the underlying trends and assess what Uber’s year-end results might reveal about its strategy and resilience in a competitive landscape. This post will examine four critical metrics—Driver Base Pay, Driver Bonus Pay, Customer Charge, and Take Rate—to understand better the factors shaping Uber’s financial health and profitability potential as the year approaches.
Driver Base Pay: Uber’s Commitment to Competitive Earnings
What is Driver Base pay?
Driver base pay represents Uber drivers' core earnings per trip, excluding bonuses and incentives.
Why Driver Base Pay Matters for Stability and Cost Management
While bonuses more directly impact driver acquisition during peak times, base pay adjustments may help shape Uber’s attractiveness as a consistent earning opportunity compared to other platforms. Tracking these trends may provide insights into how Uber adjusts its pay structure to balance driver attraction with operational efficiencies.
Changes in base pay could indicate responses to competitive or regulatory shifts, impacting driver retention and stability. Finance and investment firms can interpret this data to gauge Uber’s workforce stability and operational efficiency.
- Workforce Stability: Higher or rising base pay may indicate a response to competitive pressures or regulatory changes, affecting driver retention and overall workforce stability.
- Operational Costs: Trends in base pay offer clues about Uber’s cost management approach, particularly about maintaining driver availability without sacrificing profitability.
- Market Positioning: Consistent or increasing base pay can signal Uber’s positioning relative to competitors, highlighting whether it’s creating a more attractive earning potential for drivers.
The Impact of New Legislation: Adapting to a Shifting Gig Economy
With recent legislative changes across critical markets, Uber and other gig platforms face evolving requirements around driver classification and compensation that could influence pay structures. For example, California’s AB 5, implemented in January 2020, redefined gig worker classification criteria. More recently, in January 2024, New York State introduced the Gig Worker Transparency Law, requiring companies to disclose more detailed pay and fee information to gig workers.
In addition, Washington State’s Minimum Compensation Standard, which took effect in July 2023, established minimum per-trip pay rates for drivers. These regulations may shape Uber’s base pay adjustments as companies navigate compliance requirements while maintaining competitive market positioning. Monitoring how these legislative factors impact Uber’s base pay and operational costs in Q4 could provide insights into the company’s approach to balancing driver supply with emerging regulatory demands.
Base pay trends and what they could mean
Uber’s base pay trends for drivers, starting at $10.97 in February and peaking at $12.06 in October, offer insight into the company’s approach to stability in its workforce. Changes in base pay might reflect Uber’s response to market conditions or regulatory shifts, with potential implications for driver retention and cost efficiency.
Trends that could tell us where Uber is headed in Q4
As Q4 unfolds, monitoring driver base pay trends can offer insights into Uber’s longer-term strategies. A continued rise in base pay might suggest adjustments in Uber’s approach to stay competitive or respond to regulatory shifts, especially in regions with recent legislation impacting driver earnings. Alternatively, any stabilization or decrease in base pay could indicate a more balanced driver supply or effective management of operational costs. Observing these trends in Q4 could help reveal how Uber balances driver acquisition costs with overall profitability goals.
Driver Bonus Pay: The Pulse of Peak Demand
What is Driver Bonus pay?
Driver bonus pay represents the incentive Uber offers drivers to meet peak demand during busy periods in certain areas. Driver bonus pay is a tool Uber and other gig worker platforms use to balance short-term supply and demand, particularly in peak periods.
Why Bonus Pay can speak volumes about demand
Variations in driver bonus pay may offer insight into Uber’s strategies for managing peak demand and supply. An increase might suggest efforts to manage peak demand or respond to competitive pressures, whereas a decrease could reflect a stabilization in supply-demand dynamics.
Studying these fluctuations helps uncover how Uber might be adapting to market needs. On the other hand, an increase in paid bonuses in an area is also a healthy indication that Uber is varying their supply effectively. This can lead to higher customer satisfaction and future customer loyalty for Uber.
For finance professionals, bonus pay trends can reveal insights into demand patterns and competitive dynamics.
- Demand Fluctuations: An increase in bonus pay often reflects heightened demand in certain areas or times, such as holidays or events, and may indicate future revenue potential.
- Competitive Pressures: Higher bonuses can imply intense competition for drivers, revealing how Uber adapts to maintain adequate driver availability.
- Cost Efficiency: A decrease in bonus pay could suggest that Uber has stabilized its driver supply, leading to lower operational costs and potentially higher margins.
What are the trends that Driver Bonus pay reveals?
In 2024, Uber's bonus pay amounts showed significant fluctuations. Starting at $2.62 in January, the bonus pay peaked at $4.15 in July before dropping to $1.99 in August. It stabilized around $2.43 by October, reflecting a 22% increase from the August low. This volatility may reflect Uber's strategic adjustments to driver incentives in response to market conditions and supply dynamics.
What are the trends that Driver Bonus Frequency reveals?
The frequency of bonuses also varied throughout 2024. Beginning at 25.8% in January, it rose to 31.3% in February, then dropped to 11.9% in July. By October, the frequency increased to 34.0%, a 186% recovery from the July low. This trend suggests Uber's efforts to balance driver engagement and cost management, possibly in response to seasonal demand changes.
Bonus Trends: Is Uber Ready for the Q4 Rush?
As we approach the holiday season, demand will likely surge, potentially impacting driver availability. Monitoring bonus pay trends in Q4 will help assess how Uber addresses increased demand and supply needs in the holiday season. For example, an uptick in bonuses could indicate peak season challenges. In contrast, stable bonus levels would suggest effective supply management—both will be essential for understanding Uber’s revenue strategy this quarter.
Customer Charge: Gauging Uber’s Pricing Power
What is Customer Charge?
Customer charge is the amount Uber collects from riders per trip. Customer charge trends can reveal Uber’s pricing strategy and ability to balance operational costs with demand.
Customer Charges as a window into revenue strategy
Customer charge is the amount Uber collects from riders per trip. This metric provides insight into Uber’s pricing power and ability to cover rising operational costs. Customer charge trends offer a lens into Uber's pricing strategy. An increase may suggest the company successfully manages rising costs while maintaining demand. Understanding these patterns could reveal how consumers respond to price adjustments and what that means for Uber’s revenue potential.
The amount Uber charges customers per trip can indicate its pricing power and ability to cover operational costs. Customer charges can provide insights into Uber’s revenue generation and market strategy.
- Revenue Growth: Rising customer charges may indicate strong demand or Uber’s ability to pass on increased costs to consumers, signaling revenue growth potential.
- Pricing Flexibility: Stable or increasing customer charges can reflect Uber’s ability to sustain demand despite higher prices, showcasing its brand strength and market position.
- Competitive Market Dynamics: Any fluctuations in customer charges might reflect external market pressures, competitive pricing, or shifts in consumer behavior, helping investors assess Uber’s adaptability.
However, looking at the breakdown of customer charges to get a complete picture would be prudent. The customer charge breakdown would look at base pay, bonus, and tips. Get in touch with our team here to explore these analytics.
Some trends we see in Customer Charge Analytics
Customer Trip prices for Uber rides fluctuated throughout 2024. Starting at $19.79 in January, prices peaked at $23.57 in October, a 19% increase. There was a notable dip to $17.55 in August, a 26% decrease from the October peak. These changes likely reflect Uber's dynamic pricing strategies in response to demand fluctuations and competitive pressures.
What to watch for in Q4
As Q4 unfolds, observing any increase in customer charges could reflect higher seasonal demand, offering insights into Uber’s pricing strategy and its influence on revenue. The steady rise in customer charges provides an interesting area of study. It opens the door to exploring how Uber’s pricing power influences its ability to handle operational costs, and whether these adjustments are sustainable without dampening demand.
Take Rate: Uber’s piece
What is Take Rate, and why is it key?
The take rate—meaning the percentage of each fare Uber retains after paying drivers—is a vital indicator of the company’s profitability. Monitoring take rate trends helps investors understand how Uber balances revenue goals with driver compensation.
A note on airport-specific Take Rate:
Airport trips often have a distinct take rate, as these rides tend to be longer and can include additional fees or adjusted pricing. Data from Gridwise Analytics shows that Uber's airport take rate is typically higher than that of standard trips, reflecting both the premium nature of airport rides and the operational considerations involved, such as wait times and coordination. Tracking airport-specific take rates in Q4 may reveal how Uber approaches revenue on high-demand routes, particularly at transit hubs with unique logistical demands.
Why does Take Rate matter?
Changes in the take rate reveal Uber’s approach to managing operational margins and profitability without undermining driver incentives. An increasing take rate may signal changes in per-ride profitability as Uber retains a larger share of fares, providing a key indicator of revenue trends. Additionally, steady or increasing take rates indicate that Uber effectively manages driver compensation and costs to optimize its bottom line.
- Profitability Potential: A higher take rate indicates improved profitability per ride, making it a key metric for evaluating Uber’s earnings potential.
- Operational Efficiency: Steady or rising take rates reflect Uber’s ability to manage driver compensation relative to revenue goals.
- High-Value Routes: Airport-specific take rates provide insight into how Uber maximizes revenue on premium, high-demand routes, supporting profitability in key markets.
How Take Rate trends indicate Uber’s profitability path
Uber's take rate showed variability, starting at 15.8% in January and peaking at 22.2% in August before adjusting to 18.3% in October. This peak in August represents a notable change in the percentage cut Uber receives from rides. Various factors, including changes in pricing strategies, operational adjustments, or market conditions, could influence the specific reasons for this increase.
What to watch for in Q4:
As Q4 unfolds, monitoring Uber’s take rate can show how effectively the company manages revenue, operational costs, and driver incentives. Any continued rise in the take rate may suggest adjustments in Uber’s revenue retention strategies, which can affect both margins and driver incentives.
Observing any shifts in airport-specific, alongside airport route paid Bonuses, Take Rates could also provide insights into how Uber leverages high-demand routes to support profitability. As the year concludes, this metric will be essential in understanding Uber’s approach to sustaining a balanced and competitive model.
Trip Volume: A closer look at Uber’s Demand surge
What is trip volume?
Trip volume refers to the total number of trips completed by Uber drivers over a specific period. It is a crucial indicator of demand for Uber's services and reflects the platform's operational scale and market reach. Changes in trip volume can highlight shifts in consumer behavior, market conditions, and Uber's competitive positioning.
What Trip Volume reveals about consumer demand
Trip volume is crucial for understanding Uber's market performance and growth potential. It provides insights into consumer demand, platform efficiency, and the effectiveness of Uber's market strategies. Monitoring trip volume trends can help assess Uber's ability to attract and retain customers, manage supply-demand dynamics, and optimize operational efficiency.
- Market Demand: Increases in trip volume suggest rising consumer demand and successful market penetration, while decreases may indicate competitive pressures or changing consumer preferences.
- Operational Efficiency: Consistent or growing trip volume can reflect Uber's ability to match driver supply with rider demand efficiently, optimizing platform utilization.
- Revenue Potential: Higher trip volumes typically correlate with increased revenue opportunities, making it a critical metric for financial performance analysis.
What analysis on Trip Volume tells us
Uber's trip volume experienced fluctuations throughout 2024. Starting at 3.61 million tasks in January, it peaked around April before declining steadily, reaching a low of 3.35 million functions in September. These changes may reflect seasonal demand variations, competitive dynamics, or strategic adjustments in Uber's service offerings.
Impact of market conditions on Trip Volume
Market conditions, including economic factors, competitive actions, and consumer trends, can significantly impact trip volume. For instance, economic downturns may reduce discretionary spending on ride-hailing services, while increased competition from other platforms could affect Uber's market share. Understanding these influences is essential for predicting future trip volume trends and strategic planning.
What to watch out for in Q4
As Q4 progresses, observing trip volume trends can provide insights into Uber's market resilience and strategic effectiveness. An increase in trip volume might indicate successful holiday season promotions or improved market conditions, while a decrease could suggest challenges in maintaining consumer engagement. Monitoring these trends will be crucial for evaluating Uber's ability to sustain growth and adapt to evolving market dynamics.
The takeaways
Each of these metrics—Driver Base Pay, Driver Bonus Pay, Customer Charge, Take Rate, and Trip Volume—provides a vital perspective on Uber’s operational efficiency and potential for a profit surge in Q4 2024. As Uber continues to navigate the complexities of its cost structure, analyzing how it balances rising driver pay with its take rate and customer charges can shed light on its ability to achieve profitability. Monitoring these trends could offer valuable insights into Uber’s operational health as the year concludes.
However, these insights only scratch the surface. Gridwise Analytics provides a real-time, data-driven view into gig mobility metrics, enabling financial firms to make more informed decisions. With granular data correlated to publicly reported gig platform metrics with 98% accuracy, we provide financial firms with the insights they need to make informed decisions. Our anonymized data from millions of gig worker trips gives a comprehensive view of the operational health of companies like Uber, DoorDash, and Lyft.
In today’s data-driven world, having access to reliable, actionable data is essential. Whether you’re tracking earnings per trip, platform expansion, or driver retention, Gridwise Analytics provides the insights that make a difference. If you want an up-to-date look at how these numbers are trending and impacting companies like Uber, contact Gridwise Analytics. Data is no longer a luxury—it’s a necessity.

Stay Organized with Gridwise’s New Receipt Upload Feature
Staying on top of your expenses is essential for every gig driver, and Gridwise makes that task simpler than ever. Our app has long offered expense tracking to help you understand where your money is going, but we’re thrilled to introduce an exciting new feature for Gridwise Plus members: Receipt Uploads. With this addition, you can easily upload and save digital copies of your receipts, allowing for better organization and quicker access whenever you need it.
Why does this matter? Keeping track of your receipts means you can more accurately monitor spending, streamline tax preparation, and even catch potential deductions you might have missed. In just a few taps, you can enhance your expense tracking and ensure no detail slips through the cracks.
Read on to discover how Receipt Uploads can simplify your record-keeping and make a positive impact on your bottom line.
Why Add Receipts to Your Expenses?
Expense tracking helps drivers understand their true earnings after costs. Here’s how uploading receipts enhances your existing tracking abilities:
- Accurate Financial Records: Adding receipts ensures you have a reliable, verifiable log of every expense.
- Streamlined Tax Prep: No more scrambling for receipts come tax time—everything is already organized in one place.
- Better Cost Control: Reviewing receipts can reveal insights into spending patterns and areas for saving.
With this new feature, your financial recordkeeping will be more comprehensive and accessible, right within the Gridwise app.
How to Upload Receipts in Gridwise
Using the new receipt upload feature is simple. Here’s how you can add receipts to any expense you log:
- Tap the black "+" button at the top right of the app’s main screen.
- Select Expenses.
- Enter the Expense Amount: Type in the dollar amount of your expense.
- Set the Date: Choose the date that matches your expense.
- Tap Category and select the correct expense category.
- Return to the New Expense form.
- Tap Add Photo to upload your receipt:
- You can take a photo of your receipt or select an existing image from your library.
- Add any relevant Notes if needed.
- Tap Save to log the expense. You’ll receive a confirmation, and the expense will appear in the earnings section.
Note: The receipt upload feature is available exclusively for Gridwise Plus users on app version 3.61 and above.
https://vimeo.com/1024885937?share=copy#t=0
Take Charge of Your Finances with Gridwise
We know tracking your expenses is already important to you. With the new receipt upload feature, your expense tracking is now even more robust and organized, saving you time and helping you maximize your take-home earnings.Upgrade to Gridwise Plus today and make the most of this enhanced feature, putting you in control of every dollar you earn and spend on the road.

How to Make $1,000 a Week With Amazon Flex in 2026 ($22.60/hr Data)
So, how much do Amazon Flex drivers earn? In this blog, we explore what drivers can expect to make, covering the factors that influence earnings, tips for maximizing pay, and how seasonal trends impact income. Whether you’re considering Amazon Flex as a full-time job or a side gig, this guide will give you a clear picture of potential earnings and how to make the most of your time on the road.
What is Amazon Flex?
Amazon Flex refers to Amazon’s fleet of gig drivers who deliver packages. Amazon has, for some years, provided overnight delivery to Amazon Prime members and, in some cases, same-day delivery. According to Techjury.com, six in ten US households use Amazon Prime. That’s serious market penetration. LandingCube.com reports that Amazon delivers approximately 1.6 million packages a day.
Suppose you are a Prime member purchasing a new dash holder for your cell phone, vital equipment for your gig driving activities. When you click the button to purchase, that item appears as an order on a computer in an Amazon warehouse, and a worker is off to collect it. This all happens within minutes. Meanwhile, a computer is busy calculating the routing process. Somewhere along the way, the item and routing instructions come together, and the product is delivered to you that day, the next day, or the day after that.
Many things need to happen to ensure this system flows properly, one of which is a flexible workforce of delivery people. Amazon looked to the community of gig drivers, and now we have Amazon Flex.
Is it Possible to Earn $1000 on Amazon Flex per Week?
A critical element in maximizing earnings is choosing the right times to deliver, which can significantly impact your weekly income.
For instance, a YouTuber shared their experience of earning $3,563.50 by delivering approximately 1,000 Amazon packages over 110 hours. This impressive feat translates to an average of $37 per hour before taxes and expenses, showcasing the potential to earn well above $1000 in just one week. You can explore their journey in detail here: How much I earned delivering 1,000 Amazon packages - YouTube.
To achieve similar success, leveraging a tool like Gridwise can prove invaluable. Gridwise assists drivers in pinpointing the most lucrative driving windows by analyzing demand spikes during tax season, holidays, and special shopping events such as Amazon Prime Day. By aligning your driving schedule with these peak times, you enhance your ability to earn higher wages and make the most out of each hour on the road.
Therefore, yes, earning $1000 per week on Amazon Flex is a realistic target, especially when you employ strategic planning and effective tools to boost your efficiency and earnings.
But there’s a catch. You need strategies and the knowledge to make it happen.
How much does Amazon Flex pay?
The Amazon website shows Flex pay ranges between $18 and $25 an hour. But is this really how much Amazon Flex drivers make?
How much do Amazon Flex drivers earn per hour in 2024?
Amazon Flex drivers earn an average of $21.96 per hour in 2024. This hourly rate includes a small bonus and tips component of $0.90 per hour. Amazon Flex drivers enjoy a relatively high hourly rate compared to many other gig economy jobs, reflecting the demanding nature of package delivery work.
What is the daily earnings for Amazon Flex drivers in 2024?
Amazon Flex drivers earn an average of $113.27 per day in 2024. This daily rate suggests that drivers typically work around 5-6 hours per day. The flexibility of choosing their own schedules allows drivers to balance this work with other commitments or jobs.
How much do Amazon Flex drivers make per week in 2024?
Amazon Flex drivers earn an average of $400.70 per week in 2024. This weekly income indicates that many drivers treat Amazon Flex as a part-time job or supplementary income source. The amount can vary significantly based on the number of shifts a driver chooses to work each week.
What are the monthly earnings for Amazon Flex drivers in 2024?
Amazon Flex drivers earn an average of $1,273.19 per month in 2024. This monthly income can provide a substantial boost to a household's finances. However, it's important to note that drivers are responsible for their own vehicle expenses, fuel costs, and taxes, which can impact their net earnings.
- Hourly gross average: $21 to $22, averaged over six quarters
- Daily gross average: $109 to $113, averaged over six quarters
- Weekly gross average: $331 to $411, averaged over six quarters
- Monthly gross average: $989 to $1,329, averaged over six quarters, showing a consistent increase
Source: Gridwise, 2023 Q1 to 2024 Q2
Earning $1000 a week with Amazon Flex: An earnings breakdown
Based on the Q2 2024 data:
- Average hourly gross: $21.83
- Average weekly gross: $411.93
To reach $1,000 per week, drivers would need to increase their earnings by about 143%! However, this is if we base earnings on the average alone. Your earnings can indeed be higher.
Hours Required
At the average rate of $21.83 per hour:$1,000 / $21.83 ≈ 45.81 hours. Drivers would need to work approximately 46 hours per week to reach this goal at the average rate. However, strategic planning can reduce this time commitment. Knowing your average per hour can also help you with your personal hourly requirement for hitting your target.
Strategy and Advice
- Target Higher-Paying Blocks: Some Flex blocks pay more than the average rate, especially during peak times or for less desirable shifts. By focusing on these, drivers could potentially earn $25-$30 per hour, reducing the required hours to 33-40 per week.
- Maximize Prime Time Hours: Work during evenings and weekends when demand is highest, potentially increasing your hourly rate.
- Be Available for Instant Offers: These last-minute, often higher-paying requests can significantly boost your hourly average.
- Efficient Route Planning: Plan your routes strategically to complete more deliveries in less time, potentially increasing your per-hour earnings.
- Maintain High Performance Metrics: Consistently high ratings and on-time deliveries can lead to more frequent and potentially higher-paying offers.
- Combine with Other Gig Work: During slower Flex periods, consider supplementing with other gig economy jobs to reach your weekly goal.
- Track Expenses: Keep detailed records of your mileage and other expenses for tax deductions, which can increase your net earnings.
- Vehicle Efficiency: Use a fuel-efficient vehicle to minimize expenses and increase net earnings.
- Stay Informed: Keep up with local events and Amazon promotions that might increase delivery demand in your area.
- Be Flexible: Be willing to work in different areas or take on various types of deliveries (e.g., Prime Now, Amazon Fresh) to maximize opportunities.
- Optimize for Tips: While Amazon Flex doesn't heavily rely on tips, providing excellent customer service can lead to occasional gratuities, boosting your earnings.
Remember that consistently earning $1,000 per week may be challenging and could require working more hours than the average Amazon Flex driver. It's important to balance your work hours with personal time and consider the wear and tear on your vehicle when pursuing this goal. Additionally, earnings can vary significantly based on location, season, and other factors beyond a driver's control.
How Amazon Flex blocks work
Amazon packages its deliveries for Amazon Flex drivers by blocks, ranging from three to six hours. The larger the block, the higher the price tag. Drivers indicate which Amazon warehouses they want to pick up from (warning: don’t count on all warehouses being open to you, especially when you first start). When you choose a block, you know how long it will take and how much you will make. Some quick division, and you know your hourly wage.
But a nice perk of Amazon Flex is that the blocks typically take less time than advertised. Gridwise came across driver story after driver story of blocks that took nowhere near the time allotted. Better yet, Amazon doesn’t seem to care. Their only concern is that the deliveries are made and made accurately. Once finished, you’re free to go about your other business, which might even include seeing if any other blocks are available.
A block that takes less time means you’re making more money per hour. You may have selected a four-hour block labeled at $120, but it only took three hours. Your hourly pay went from $30 to $40. Now you can look for more blocks.
This is an integral part of maximizing your Amazon Flex driver salary. But how can you get to $1,000 a week as an Amazon Flex driver?
Choose optimal driving windows to earn more with Amazon Flex
Maximizing your earnings as a gig worker isn't just about putting in more hours; it's about working smarter, not harder.
Gridwise, a comprehensive app designed specifically for gig drivers, is crucial for making informed decisions about when and where to drive.
Here’s how Gridwise's features can help you optimize your driving schedule:
- Real-Time Demand Tracking: Gridwise analyzes local events and trends to forecast high-demand periods. This means you can anticipate busy periods, like tax season or holiday rushes, and plan your schedule accordingly.
- Earnings Comparison: The app allows you to track and compare your earnings across different times and locations. This feature helps you identify the most profitable times to drive and which areas yield the best returns.
- Custom Alerts: Set up alerts for upcoming high-demand times like Amazon Prime Day. Gridwise notifies you about these opportunities, ensuring you don't miss out on potential high-earning windows.
- Performance Analytics: Gridwise provides detailed insights into your driving patterns and earnings. By analyzing this data, you can make adjustments to improve your efficiency and increase your income.
- Weather and Traffic Updates: Stay ahead of external factors such as weather conditions and traffic congestion. Gridwise integrates this information, helping you decide the best times to hit the road and avoid slowdowns.
By utilizing these features, you can strategically plan your driving times and locations, ensuring you're on the road during the most lucrative windows. This targeted approach not only boosts your earnings but also enhances your overall efficiency as a gig driver.
What are the tips from $1,000-a-week Amazon Flex drivers?
- Accept only higher earning blocks
Your goal is to identify the Amazon Flex blocks that work for you. Most top-earning drivers don’t accept a block for less than $100, which accomplishes two things. First, goals are a good habit for drivers who want to maximize earnings. Second, if enough drivers pass on smaller blocks, those blocks are more likely to surge in price, which gets us to secret #2.
Drive smarter, not harder. Gridwise shows you the best times, places, and platforms to drive. Download for free →
- Be aware that Amazon Flex blocks will surge in price
It’s supply and demand, simple economics. If Amazon Flex has more deliveries than drivers, they increase the payment for a block as it approaches delivery time, known as a surge. Perhaps the flu is burning through an Amazon facility, and several drivers call in sick. Amazon relies on the ranks of Amazon Flex drivers to fill this void. As an added incentive to attract drivers, they bump up the price of the last-minute block.
According to a YouTube video by Chuck Driver, Amazon Flex surges can boost prices from 25% to 100%. Longer block lengths tend to surge higher, as do blocks during inclement weather (including snow, which is why you need to read the Gridwise post Doing Rideshare and Delivery in Snowy Conditions: What to Know).
- Know when surges are likely to happen
According to Chuck Driver, Amazon Flex surges are likely just before standard block times, particularly early mornings and evenings. If Amazon has a batch of blocks scheduled for pick up at the warehouse at 3:30 am (yes, Amazon schedules them that early) and at 2:45 am, if a block remains untaken, it might surge. That means you have to set your alarm clock so you can wake up at 2:45 am to see if any blocks are surging, but that’s why you're a top-earning Amazon Flex driver.
Shifts late in the day also surge as regular drivers return to the warehouse with deliveries they could not complete. According to Chuck Driver, there is less competition for surges late in the day and into the night, as many Amazon Flex drivers want to be home with their families. This makes it more likely you will score a good surge.
- Understand when the busy periods are for deliveries
Amazon Flex has two busy periods of the year. Predictably, deliveries start their upward trend around Thanksgiving, continuing through Christmas, and then plummet around New Year's Day. The first quarter of the year is flat, but deliveries start to spike again in April as people receive tax return checks and plan summer vacations. Increased demand continues until about July, and then flattens again until the cycle repeats.
You can also expect spikes around Amazon Prime days in June and July, although the company is constantly experimenting with the dates for that program. You will see more surging blocks during these times because the increased demand causes the warehouses to get behind, creating lots of last-minute blocks that need delivery.
- Attain Level 2 of Amazon Flex Rewards
The Amazon Flex Rewards program gives you points for each block completed. If you have a “Great” rating with Amazon Flex, you get two points for each completed delivery and 20 points per block. A “Fantastic” rating gets you three points per delivery and 30 points for each completed block. Once you amass 650 points as an Amazon Flex driver, you're at Level 2 for the entire quarter and the following one.
Level 2 perks include increased ability to set your preferred warehouses and early access to blocks. You have a better chance of grabbing the surging blocks. If your goal for Amazon Flex delivery driver pay is $1,000 a week, Level 2 is where you want to be.
- Keep your Amazon Flex app updated
This is true for all apps used by gig drivers. Developers at Amazon Flex are constantly refining and improving the app. Regularly updating your app ensures you have access to all the latest improvements. If you neglect to update the app, it can become clunky, slow, and unresponsive. It might even stop working altogether. Check for updates at least twice a week.
- Save money on fuel by becoming familiar with the different types of Amazon warehouses nearest you
There are different Amazon Flex warehouses. Some cater exclusively to Amazon Flex drivers. These warehouses will likely have early morning surges (remember, 3:30 am) and late afternoon and evening surges. Other warehouses are for regular Amazon drivers. Amazon Flex drivers are allowed in only after the regular drivers have loaded their trucks and left. This is where you will get surging blocks because drivers have called in sick or return later in the day with undelivered items.
Get familiar with the warehouses nearest you; you're more likely to get delivery routes close to your home, which cuts down on miles and your fuel consumed. All warehouses operate differently. Some have drivers pull inside to receive their blocks (a nice thing during bad weather), while others require you to come in and get your block in a cart, then load it in the parking lot.
- Show up early for your shift
You don’t get paid for sitting around, but some Amazon warehouses will count you as tardy if you're late to pick up a block, even if it’s obvious you were waiting in line. Bring a book or listen to podcasts while you cool your heels.
- Sort your Amazon Flex deliveries
It’s tempting to begin your route right away and start dropping off packages. Take a few minutes, though, and sort them. It’s not difficult and saves you lots of time on the route. Check out the many YouTube videos showcasing different approaches on how to sort your Amazon Flex packages, such as Sara Elizabeth’s video.Use Waze or Google Maps for navigation
- Be wary of Amazon’s navigation
Many drivers report that the navigation used for the Amazon Flex app is notoriously buggy, but you can change to Waze or Google Maps to correct this situation.
- Wear an Amazon Flex vest
You receive an Amazon vest when you become a Flex driver. Wear it. Being identifiable saves a lot of time when driving through neighborhoods or walking around apartment buildings or office complexes. One look, and people know who you are. You can check out Esty for Amazon caps and T-shirts. You want to be clearly identifiable as an Amazon Flex driver.
- Carry a collapsible wagon or hand truck in your vehicle
Remember, you want to save time. A collapsible wagon or hand truck in your vehicle is great for heavy or bulky boxes and is especially convenient when you have multiple deliveries to a single apartment or office building. Shaving off time helps you cross one of the biggest hurdles to making $1,000 a week as an Amazon Flex delivery driver.
- If you're new to Amazon Flex, start with three-hour blocks
Yes, this is counter to the advice we gave you earlier regarding selecting only those blocks that will earn you more than $100, but if you're a newbie to Amazon Flex, don’t overwhelm yourself. You will learn quickly and soon be doing those blocks worth $100 and more.
- Stay away from the Amazon Flex block bot grabbers
Bots and other software can help your app grab Amazon blocks, even when you're not monitoring it. Resist the temptation to use them. According to ThisOnlineWorld.com, “Using third-party software to get more blocks is a direct violation of terms of service and will result in deactivation from Amazon Flex.” You will never make $1,000 a week at Amazon Flex if you get deactivated from the app.
How can Gridwise help you earn more with Amazon Flex?
Gridwise makes gig drivers more successful. In just a few minutes, you can link your Amazon Flex app, and all the apps you use for gig driving, allowing you to automatically track all your mileage, add it up, and provide accurate reports for the maximum deductions at tax time.
Gridwise also analyzes all your gig driving earnings so you can easily understand when and where you're most profitable - so you can reach that $1000 a week goal!

How Much Do Uber Drivers Make?
Uber appeared in the marketplace in 2009. The company was the first to develop a workable format to bring rideshare to everyday consumers, using a simple app for riders and passengers. Uber didn’t just enable rideshare, though. It enabled a new industry: people who make their living as gig drivers, anyone with a driver's license could consider applying. You didn’t even need a car. You could rent one. More than a decade later, gig driving has spawned Uber rivals and entirely new gig sectors, notably food and package delivery. This first-to-market achievement has also earned Uber status as a crystal ball for the industry. Whatever Uber does, others will soon follow. This makes it logical to answer the burning question: How much do Uber drivers make?
How much do Uber drivers make?
Before we answer this question, it’s essential to understand how the best gig drivers maximize their pay. They look at it from every angle possible. They don’t stop at asking, How much Uber drivers make a year? They want to know: How much do Uber drivers make in a day? How much do Uber drivers make an hour? And how much do Uber drivers make per trip? They want a breakdown of how much do Uber drivers make before tips and in bonuses.
By understanding each earning category, strategic Uber drivers know where they earn the most. They know that they can make more by boosting their tips, or if they can squeeze in an extra ride each hour. They also know where the rides are and when they are likely to earn the most.
These are the earning secrets we will address in this blog post.
How much do Uber drivers make per ride?
In the world of data and statistics, rides are referred to as tasks, which is why you see them listed as such. We still call them rides. At the end of 2023, Uber rideshare drivers averaged $14.39 per ride. Smart Uber drivers often prefer this number because it tells them how much more they can make if they squeeze in another ride each hour.
It’s handy to know your market and the extended area. Look at the destination before accepting and ask yourself how soon you’ll receive a ride from that location, or will you spend precious minutes driving to another area where you’ll get a ride? Often a handful of smaller rides in a high-traffic area will net more than one long ride that takes you to a low-traffic area.
Also, know that you are more likely to see surge pricing in high-traffic areas or close by. If a ride takes you to the suburbs, you’re less likely to benefit from surge pricing.
How much do Uber drivers make an hour?
In Q3 2023, Uber drivers were averaging nearly $19 an hour. Hourly earnings are heavily influenced by where and when you drive. Urban areas tend to have peak hours during morning rush hour, lunch, and throughout the evening, starting at about 4:00 pm (sometimes earlier depending on your region). Weekends tend to be the best for consistent rides, with Friday and Saturday nights the heaviest. There is also the phenomenon of Thirsty Thursdays, spurred by people who want to start the weekend early.
How much you make an hour as an Uber driver depends on how well you know your market and how well you utilize what you’ve learned from per ride earnings.
What's your real hourly rate after expenses? (2026 data)
The number the Uber app flashes after a ride isn't your take-home pay. According to Gridwise's 2026 Annual Gig Mobility Report, Uber drivers nationwide grossed $23.88 an hour of active work time in 2025, averaging 21.2 active hours a week. But "active hours" only count time on a trip, and idle time between rides made up 30% of total distance driven last year. Once gas (including idle miles), insurance, and wear and tear come out, net income consistently lands 30% to 50% below that gross number.
Watch the video below for the four factors, market, timing, ride type, and tips/bonuses, that move your real hourly rate the most, plus the exact 4-step formula to calculate your true take-home pay per shift.
How much do Uber drivers make before tips?
This chart shows what the average driver makes daily in tips and bonuses. Be mindful that this number represents both full- and part-time drivers.
We can’t compare apples to apples here, but if you pencil out the numbers, you get an idea. If before tips the average driver makes $104.81 per day, based on an hourly rate of $18.99, they are working a little less than five and a half hours a day.
Generally, rideshare drivers realize about 10% to 11% of their income in tips. If you’re averaging more, then you’re doing something right. It’s also important to realize that these tips are received through the app. Drivers also receive cash tips; others get tips through third-party cash services such as PayPal, Zelle, and Venmo. These don’t reflect in the app. As one Southern California driver points out, “During one year, the largest tips I received were off the app, which included one for $150.”
How much do Uber drivers make a day?
How much do Uber drivers make per day? At the end of 2023, Uber drivers were averaging gross daily earnings of just under $117. Based on the preceding graph, it works out to about 10.4% in tips.
Another way to maximize daily earnings is to research events in the area. Sporting events are a no-brainer, but concerts, trade shows, and conventions are also places to find rides. Typically, passengers from the latter two events go to local hotels. This tactic will often keep you in the area so you can pick up more rides in an hour, increasing your hourly rate. The business people you pick up from trade shows and conventions are good passengers for another reason: they tip from their expense accounts, which means they’re generally higher.
How much money do Uber drivers make a month?
Again, keep in mind these numbers combine full-time and part-time drivers. Some drivers can earn more, depending on their regions and their strategies. Last year, Business Insider profiled a full-time driver who, after deducting money spent on fuel, oil changes, and tires, made about $22 an hour. This is a strategic driver and gives us a good insight into how much full-time Uber drivers make. His monthly earnings after expenses and before taxes were about $3,500, or about $42,000 a year.
Uber driver earnings compared to Uber Eats drivers
Many people ask, How much do Uber Eats drivers make? We can answer this by referring to a graph from a recent Gridwise article, “How Much do Uber Eats Drivers Make?”
Uber Eats drivers averaged $13.49 per hour in Q3 2023. Although not as much as Uber rideshare, for drivers who want to pull in extra, Uber Eats offers the opportunity to make additional money, especially for drivers who multi-app (or run both apps simultaneously). Drivers can take advantage of midday opportunities with Uber Eats (a prime time for food delivery), filling the gaps in rideshare.
How to increase Uber driver earnings
Here are some of our most useful tips for making more as an Uber driver.
Drive smarter, not harder. Gridwise shows you the best times, places, and platforms to drive. Download for free →
Surges
The Uber app institutes surge pricing whenever there are more passengers than drivers. Depending on the imbalance, surges will increase fares by 50%, or sometimes 100% or 200%. Surge pricing is every day when significant events are let out or when the bars close at 2:00 am.
Driver Incentives
Most commonly seen as bonuses, these incentives encourage drivers to stay on the app. These include offers on the app for completing a certain amount of rides within a given time, such as three rides in a one- or two-hour period. If you turn off the app during this period or refuse a ride, the incentive disappears.
When and where you drive
Look for target-rich areas where you can find lots of rides. After driving for a while, you’ll notice patterns, such as when shifts change at a hospital or when classes let out at the local college or university. Also, check the When to Drive and Where to Drive features on the Gridwise app. They come in handy and are very accurate.
Large events
Sporting events and concerts have large amounts of attendees, and at the end, they all want to go home. Look at the Events tab on the Gridwise app for current information on what’s happening in your area.
Know your area
In large downtown areas and in the suburbs, find sources of rides that don’t show up on conventional sites. For instance, the after-hours scene in Los Angeles is often active all night on the weekends. There are many large warehouses hosting events that feature cheap liquor and decent music until dawn. Information like this can make you a lot of money when most other drivers have gone home.
Accurate earnings records
“What gets measured, gets improved.” Peter Drucker, a famous business theorist, said that, and it’s true. Download the Gridwise earnings tracker to track your income. Look at it regularly for dates, times, and places where you’ve earned a lot. Soon you will see patterns that help you earn even more.
Track mileage
Fuel is your biggest expense, a fact you can’t get around. You can, however, earn substantial tax write-offs at the end of the year by tracking your mileage. Don’t mess with pen-and-paper mileage logs. Download the Gridewise mileage tracker. It works passively, providing digital records you can download at tax time. Learn more with “How to Track Mileage for Taxes With Gridwise.”
Take out the family SUV
If you can seat six passengers, you can drive UberXL, increasing your rate by 50%.
How to increase tips as an Uber driver
We mentioned earlier that rideshare drivers average about 10% in tips. You can increase that number by doing some straightforward things.
Carry charging cords
Most drivers will tell you that very few shifts pass without at least one passenger asking to use a charging cord. It’s a good idea to have all the popular ones, including an iPhone charger and a USB-C charger for Androids.
Curate an in-demand music list
You should constantly be curating a playlist. Interestingly enough, jazz and big band are favorites. Sinatra is very popular, too. Nobody disses Frank. One driver tells how a passenger asked him to circle the block around his home twice so that he could listen to Nature Boy by Frank Sinatra. Music generates tips.
If there is a big concert in town, make sure that artist is on your playlist. There’s no better warm-up for a musical event than listening to the artist on your way to the venue. One driver tells how he was taking a group to the concert of a popular Latin band. He found the group on his music app. The passengers were so happy they left a healthy tip.
Stash gum, mints, candy, and water
Quite often, passengers are heading to meet friends, go on a date, or launch into a job interview. The last thing they want is the smell of their last meal on their breath. Carry some gum and mints.
Install cash apps
We discussed this earlier. Sometimes passengers, for whatever reason, don’t want to tip you through the app. It happens more often than you think. Have a few cash apps on your phone, and put them on your Uber business card. Consider PayPal, Zelle, Venmo, and others.
Dress for success
Wear nice clothes. You’d be surprised at the drivers out there in cut-off sweats and sleeveless T-shirts. We’re not talking about a tie and button-down shirt (although we know of at least one driver whose signature move was a bow tie). People are more likely to respect you, and tip you look presentable.
Use the passenger’s name
People love to hear the sound of their name. You’ll know what it is from the app, so use it often. Make sure it’s the first thing they hear when they get in your car and the last thing when they get out.
Have a sign-off line
Make your sign-off line simple and memorable. When you get to the destination, turn to the passenger, say their name, and then add, “It has been a pleasure having you in my car.” This is just a suggestion. Make up your own, but make it memorable.
How Gridwise can increase Uber driver earnings
There is one more measure you can take to maximize earnings as an Uber driver, and that’s to subscribe to Gridwise. We mentioned some of the benefits earlier in this blog post, but they are worth mentioning again, along with some others:
- real-time weather, traffic, airport. and events information
- earnings insights
- deals and discounts
- tax help
- insurance and affordable health care options
- money-saving connections to automotive and financial services
Download the free Gridwise app to enjoy these benefits and features. Join Gridwise Plus for deeper discounts and more benefits!
You can also join the Gridwise community. Get support from other drivers, along with special contests, offers, and giveaways. Join our Facebook community and follow us on Instagram, and start earning more the next time you go out.
Check out these links to learn more about driving for Uber Eats, or to discover valuable Gridwise services.
- How Much Do Lyft Drivers Make?
- How Much Do DoorDash Drivers Make?
- Everything You Need to Know About Amazon Flex
- Walmart Spark Delivery Driver Pay: How Much Does a Walmart Spark Driver Make?
- How Much Can You Make on Instacart?
- How Much Do Shipt Shoppers Make?
- How Much Do Uber Eats Drivers Make?
- Increase Your Earnings in 2024! How to Make $1000 per Week With Uber
- Check out the Gridwise Job Board
Replica: Enhancing Mobility Insights with Gridwise TNC Data
About Replica

Replica, a transportation analytics company, provides data and insights to help their customers better understand the built environment. Replica continually looks for ways to make its data outputs more accurate. Their customers consist of a mix of policymakers and planners in the public sector, as well as private sector clients who want to incorporate geospatial insight into their strategic and city planning.
High-quality data is vital to planners as they make important local policy decisions, such as how much parking they need to provide, where to put the next subway stop, or where there is demand for more housing or commercial office space. However, access to this data is usually slow, limited, and expensive.
Replica runs a seasonal, high-fidelity simulation that accurately represents the population and its travel patterns for the entire country. They collect and ingest historical and near real-time data to create sophisticated models of current and future mobility patterns. Replica’s customers rely on this information to improve the planning and monitoring of transportation and land use systems in cities nationwide.
Gridwise Analytics’ gig mobility data was chosen by Replica and integrated into their model as an additional source of ground truth in January 2023, using data from fall 2022.
Recognizing the challenge
With a focus on economics, infrastructure, and transportation, the models Replica produces require data about traffic patterns and people’s choices about how they will get around.
The percentage of trips involving Transportation Network Companies (TNC) has propagated substantially over the last decade. These companies include app-based platforms, such as Uber, Lyft, DoorDash, and Instacart, which move people and the items they want through independent workers known as gig drivers. While TNC growth has been substantial, it’s been hard to find data and mobility insights that effectively shed light on the new patterns of movement.
However, as the percentage of trips involving TNCs grew, more data was required to inform Replica’s models.
Replica relies on data sets sourced from observation of traffic counts and the types of activity involved. It consists of auto and vehicle counts in aggregate and specific vehicle types. Also included are public transportation and TNC/taxi counts, and public datasets.
While observation and public data yielded basic TNC information, Replica’s team had a desire for ground truth —namely, TNC data activity and mobility insights that could effectively capture the scale and detail required to depict the expanding TNC activity across the US accurately. This would allow Replica to more effectively address its customers’ concerns about how TNC activity affects issues such as parking, increased congestion on the streets, and how taxes for TNC services might be structured.
Replica knew that it was searching for additional data that tracked TNC activity, but sources for such data were limited. Not every city reports TNC data, making it difficult to cover Replica’s vast customer network. Thus, it was necessary to do a lot of extrapolating, which is not beneficial to the model.
The solution? Truth in data
Screenshot showing network volume by household Income
When Gridwise Analytics mobility data caught Replica’s attention, they realized they had come upon a data source that would be valuable in informing Replica’s model with more detailed TNC activity.
“Gridwise Analytics stands out because of its granularity, quality,
and scale for volume of the necessary data.”
- Replica
The data Replica uses is from several input sources. In aggregate, it is used to train and calibrate the model. Replica uses Gridwise Analytics as ground truth data to perform both of these operations. These include delivery data, rideshare data, gig driver trip and location data, TNC data, gig economy data, as well as others.
Holding out a portion of the data makes it possible to determine if the models match what is happening in real life. Gridwise Analytics offers additional ways to discern patterns and make predictions. “We always knew we needed TNC data, but before Gridwise Analytics, there were only limited sources out there,” they say.
Accurate data results in impactful models
Using Gridwise Analytics data and mobility insights, Replica can refine its perception of TNCs’ role in transportation throughout their customer population. Replica develops trip and fare models that enable their customers to estimate costs per trip and show the numbers and percentages of trips that TNCs handle.
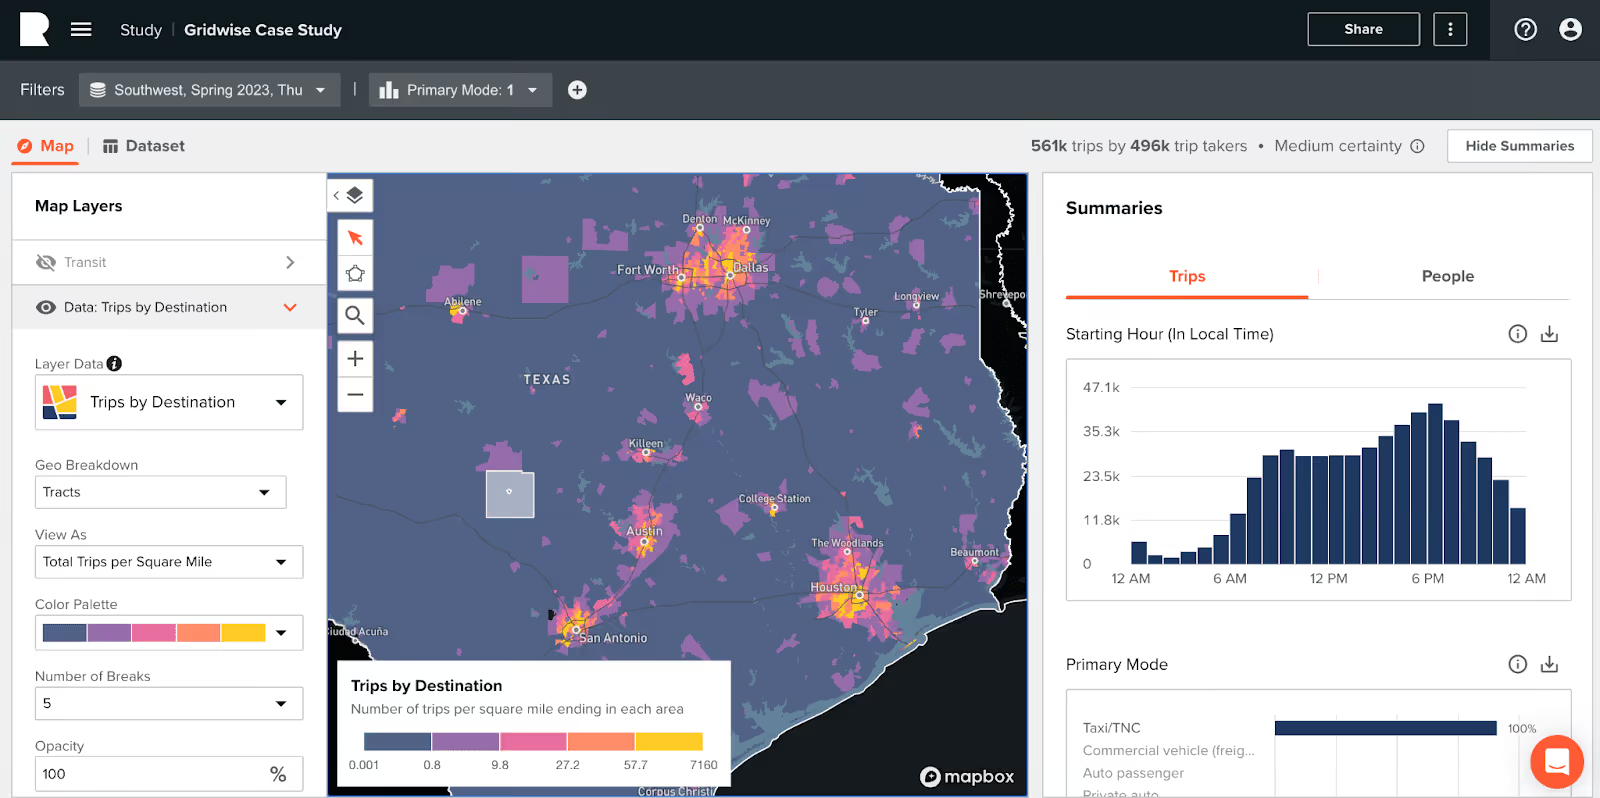
Screenshot showing hourly breakdown of trips by destination, filtered by TNC mode
Replica found Gridwise Analytics easy to incorporate into their simulations. The data is delivered in a ready-to-use and well-structured format.
Replica is confident that Gridwise Analytics has helped improve what they do. Integrating Gridwise data has allowed Replica’s already powerful model to be adjusted so it more closely aligns with what they expected to see given the rise of importance of the gig mobility sector.
What’s next for Replica?
Replica intends to continue building on the use cases for Gridwise Analytics data within their models. This includes potentially expanding into incorporating “points of interest” data sometime in the near future. Gridwise Analytics mobility data would provide further granular insight into traffic data, congestion data, and travel behavior around airports, merchant locations, events, and other important aspects of transportation analysis and planning.
The impact of delivery trips will contribute more detail into Replica’s powerful models. Delivery also affects factors that concern Replica’s customer base, such as parking and congestion. Granular data describing these trips will give Replica even more valuable information to offer regarding transportation planning.

How Much Do Instacart Shoppers Make in 2026? ($15.06/hr + 52% from Tips)
How much can you make on Instacart? Instacart has introduced a range of new features that make increasing your earnings easier with this grocery delivery service. In this post, we'll go over these new features in detail, how much you can make doing Instacart, and share other helpful tools and strategies to maximize your Instacart earnings. We also touch on reaching a $1,000 per week milestone.
Instacart shopper pay: How much can you make on Instacart?
How much do Instacart shoppers make? If you look this up, you’ll find a wide range of figures, depending on who’s telling you the story and how biased they might be. There are different types of Instacart shoppers, too. That’s part of the answer to the question, How much do Instacart shoppers make?
Here are the three roles that let you earn with Instacart:
- In-store shoppers, who are employed by Instacart and simply fill the orders so they can be made ready for curbside pickup.
- Delivery-only drivers, who are independent contractors, simply pick up completed orders and deliver them to customers.
- Full-service shoppers, who serve both roles, go through the grocery store to fill customer orders and then deliver them. They too are independent contractors.
How much does Instacart pay in-store shoppers?
Glassdoor.com states that the average in-store shopper gets paid around $15 per hour, but pay can range from $6–$24 per hour. Hourly wages such as these, for 30 hours or less per week, appeal to some people, because these jobs come with some limited benefits.
How much does Instacart pay delivery-only drivers?
Doing delivery-only for Instacart is more flexible than working in the store. You won’t make as much as a driver who also does the shopping duties.
What about Instacart full-service shopper pay?
When you shop and deliver for Instacart, you’ll make more money than you can with the other two alternatives. Here we’re going to give you actual earnings numbers, based on data collected anonymously from Gridwise drivers. Gridwise’s figures reflect averages taken from our nationwide network of app users and are broken down into categories such as earnings per hour and per trip, and tip amounts per trip.
Before we get to the actual numbers, it’s important to know that, despite trends that show less demand for grocery delivery in the post-pandemic market, Instacart full-service shopper pay is holding steady.
How do we know this? You can read the full details about Instacart shopper earnings in the first quarter of 2022 in this blog post from Gridwise. Here, we’ll keep it to the basics so you can get a general idea of where Instacart full-service shopper pay is currently.
- How much does Instacart pay per hour?
Our insights show that the national average of hourly earnings for Instacart drivers was between $15 and $16 in the first three months of 2022. Notice that being a full-service shopper puts you ahead of in-store shoppers, as their actual average hourly pay is more like $14, and can be much lower than that.
- How much does Instacart pay per trip?
Gridwise data reveals that the national average earnings per trip for Instacart shoppers is $16.06. That is rather substantial, considering that, with some hustle, it’s possible to make more than just one trip in an hour.
- What about tip earnings for Instacart shoppers?
Gridwise drivers reported that they earned between $5 and $6 in tips per trip. At about 34%, this a rather substantial percentage of per trip earnings, way more than the 10% or 15% you might expect.
As you can see, you’re already getting close to that $1000 per week. If you make the maximum here, which would be around $16 per trip, plus $6 in tips per trip, you would make your grand by fulfilling somewhere between 45 and 46 orders per week. That’s a lot of orders, though, and a bit of a hustle.
There are effective strategies to help you earn more money in less time with Instacart. Before we dive into those, it's important to first understand your unique circumstances, as well as the current market conditions, supply, and demand factors you're facing.
Knowing the details of your personal parameters - things like your schedule availability, access to a vehicle, and other commitments - will allow you to optimize your Instacart work. Similarly, staying informed about the broader market trends and supply/demand dynamics in your area can guide you in making smart decisions about when and where to focus your efforts.
Once you have a solid grasp of the landscape you're operating in, we can explore the specific tactics and techniques that will enable you to boost your Instacart earnings efficiently. With the right approach, tailored to your individual situation and the overall market, you can absolutely generate more income in less time through your Instacart work. Let's dive into those strategies next.Share
In a changing landscape, work sharper and be smarter than average
No one quite expected the volcanic-type growth the grocery delivery business showed during the pandemic, but it was very real. Now that pandemic restrictions are being lifted, you might think people would stop ordering their groceries online and getting them delivered.
Lucky for the food delivery business, it seems that people have developed a liking for ordering online. There are reports of some decline in activity, but it isn’t as sharp as it could be. There is still business out there for Instacart full-service shoppers. You just have to know yourself, and be aware of your opportunities. So, go ahead and answer a few questions about yourself.
How many hours do you want to work?
The first step is to decide whether you want your Instacart gig to be a full-time or part-time endeavor. This decision will depend on factors like your other sources of income, your family situation, and access to a vehicle when needed.
Working as a full-time Instacart shopper will generally provide you with more earning opportunities. However, you can still make good money by working part-time, you'll just need to be more strategic and put in extra effort.
If you have the availability and means to work full-time with Instacart, that route will likely maximize your weekly earnings potential. But a part-time Instacart gig can also be quite lucrative, as long as you optimize your schedule and approach. Evaluate your personal circumstances and decide which option - full-time or part-time - aligns best with your goals and lifestyle.
How large is the market for Instacart shopping where you live?
There are two things to consider here. If you live in a small town or suburban location, business might not be very brisk. Urban areas usually have more batches, but there’s also the possibility that there will be a lot of shoppers ready to fill orders. You will have to compete with them.
You can always consider working in an area that’s going to be more productive for you, whether that means driving closer to a more heavily populated area, or expanding your reach to outskirts that have lots of demand, but fewer drivers. There are shortcuts to figuring these things out, and we’ll get to that in a bit.
Once you determine your personal commitment and market factors, you should know that Instacart has done many good things to change the way shopper pay and pay structure works in 2022. Here are some highlights.
Help from Instacart
Instacart has taken steps to help shoppers make more. Here’s a “new for 2022” list of efforts the company has made to improve the shopper experience and open up new windows of opportunity.
App Updates
Remember how we said that it would be easier to make more money if you could make more than one trip in an hour? That’s no easy feat when you’re running around the store, striving to find just the right jicama, or distinguish between a kumquat and a persimmon.
Now, imagine if you could just tap on an item on the shopping list, and then see a map of the store pop up, indicating exactly where you can find the item. After a recent update, the Instacart app does exactly that! This can save shoppers a whole lot of time and make it possible to take and fulfill more orders than before.
Instacart responded to distressed shoppers who were unhappy about being unable to talk to someone when they needed to resolve certain issues. To make shoppers happy, Instacart brought back phone support. So issues such as “I can’t find the almond milk with vanilla; will plain be ok for the customer?” or “the GPS on the app isn’t taking me to the right store” can be solved by a living, breathing, and well-informed human being.
If you work hard and customers love you and you have high ratings, shouldn’t you get first dibs on batches when they become available? Instacart thinks so, and they’ve adjusted their app’s algorithm to give shoppers who have a rating of 4.7 or better priority when it comes to distributing batches.
Multi-store batching and add-ons
The Instacart app now allows for multi-store batching, so you can shop at more than one store as part of one batch. The add-ons feature lets you accept a second order in the same store while you’re shopping for another. These two features give shoppers what they really want, a chance to earn more and make a greater number of trips in a shorter period of time.
Customers can be a source of endless frustration. Some even play tricks on drivers, such as taking back a tip they promised when they placed the order. Instacart will now reinstate a tip up to the amount of $10, as long as the customer doesn’t report an issue with the order. By doing this, Instacart protects drivers from the “bait and switch” game some customers play.
Instacart is making an effort to get customers to give shoppers better tips. When a customer gives a 5-star rating, the app automatically encourages the customer to leave a bigger tip. Instacart says this has yielded a 6% increase in tips given for eligible orders.
At the checkout, they’re reminding customers to recognize how hard shoppers work, and how much tips are appreciated. As a result of this prompting, there’s been a 12% decline in the number of customers neglecting to leave a tip.
Nano-fulfillment = more trips per hour
Instacart is making it easier for retailers to fulfill different kinds of orders, and this will mean more opportunities for Instacart shoppers. In select cities, the new Instacart Platform for retailers gives them the ability to create “Carrot Warehouses.” These are flexible, local stores and warehouses that let retailers provide 15-minute, ultra-fast delivery. These nano-fulfillment centers will be designed to fit the specifications of specific retailers and could bring a new level of opportunities to shoppers.
How to make more money with Instacart: extra steps to take and moves to make
As mentioned earlier, earning $1,000 per week with Instacart will require extra effort on your part. While Instacart has introduced new features to support its shoppers, the predicted economic downturn in the grocery delivery industry means you'll need to be strategic to achieve this earnings goal.
To maximize your weekly Instacart income, you'll need to develop a well-crafted plan that capitalizes on the most lucrative times and locations to work. Additionally, it will be important to manage your expenses effectively so you can keep more of your earnings.
With the right strategic approach, supported by helpful technologies, earning a $1,000 weekly income from Instacart is certainly an achievable goal, despite the predicted industry challenges. It will just require a bit more planning and diligence on your part.
Gridwise can help you achieve your goals
One tool that can help you with this is Gridwise. The app (available on IOS and Android) provides valuable data and insights to help you identify the optimal times and zones for completing Instacart orders. It can also assist with tracking your expenses and maximizing your mileage deductions. By using a resource like Gridwise, you'll be better equipped to navigate the changing Instacart landscape and reach your $1,000 per week target.
We told you there are tools you can use to help you create and maintain your strategy. Now it’s time to learn more about them and see how you can put them to work for you.
- If you haven't already, you can sign up to deliver groceries with Instacart here.
- Track expenses and mileage. Your Instacart full-service shopping gig is a business, and you have to run it like one. That means taking advantage of tax deductions, from fuel and special equipment, to mileage on your vehicle.
- Use Gridwise to see how much you’re earning, and maximize your tax deductions. Our free app lets you seamlessly sync your Instacart platform to an earnings, expense, and mileage tracker that gives you a ton of extra earning power.
- Know When to Drive and Where to Drive. These Gridwise features give you the insight you need to plot out your driving strategy. You’ll see exactly how much shoppers are earning in your area, based on the times they’re shopping and where the biggest batches are to be found. Like all Gridwise data, this information comes directly from real drivers, so you can be sure that you’re not being led on a wild goose chase. Knowing when and where to drive will surely help you succeed in making $1000 a week with Instacart a lot faster!
- Hustle for tips. Now that Instacart has a tip protection policy and is reminding customers how important tips are for you, you’ve got a leg up. But if you want to make more, you can get more tips by adding extra effort into your shopping and delivery activities. Stay in communication with customers, letting them know if you’re running late or are having trouble finding an item. Get equipment that makes it easy to deliver the packages without crushing bread or breaking eggs. If you see your customers, greet them with a cheerful attitude that will let them see how much you care about giving them what they’re paying for.
- Work the bonus and referral programs. Instacart offers bonuses for shoppers from time to time. You can enter contests based on the number of eligible batches you complete. Prizes can be as big as $500 added to your shopper account. The Instacart shopper referral program pays as much as $400 per new shopper, if the shopper you refer completes the required number or orders within the time limit given.
- Cash in on shopper perks. Instacart’s adding perks into the full-service shopper package. While this program might not directly make you more money, it will help you save. You’ll get deals on entertainment, travel, restaurants, retail stores, gyms, phone plans, and even some financial services.
If you thought making $1000 a week with Instacart was out of your reach, we hope you see things differently now. With a sound strategy that incorporates new Instacart efforts to support shopper earnings, plus tools from Gridwise, you can definitely make that grand-a-week dream come true.
It costs you nothing to track your earnings and mileage, see when to drive, where to drive, and calculate your tax deductible expenses. It’s really easy, too.
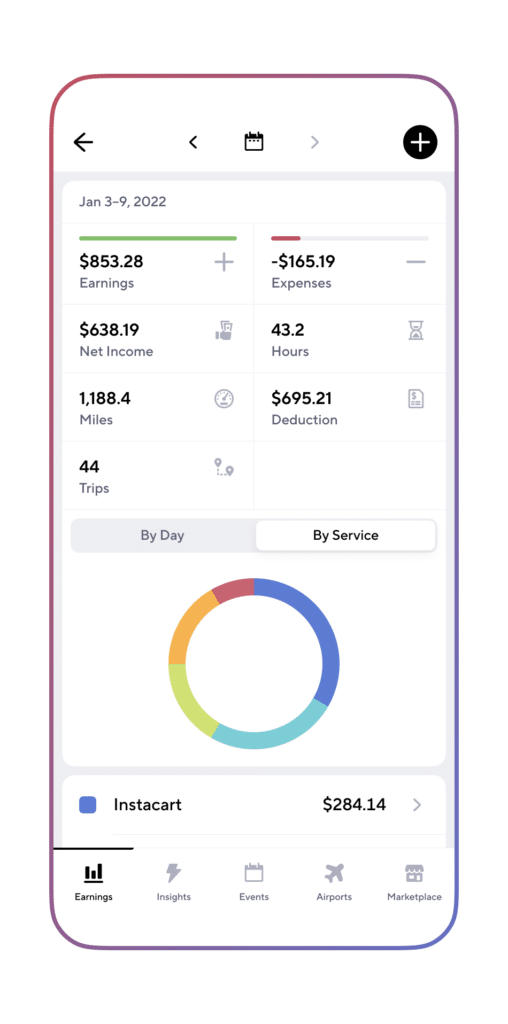
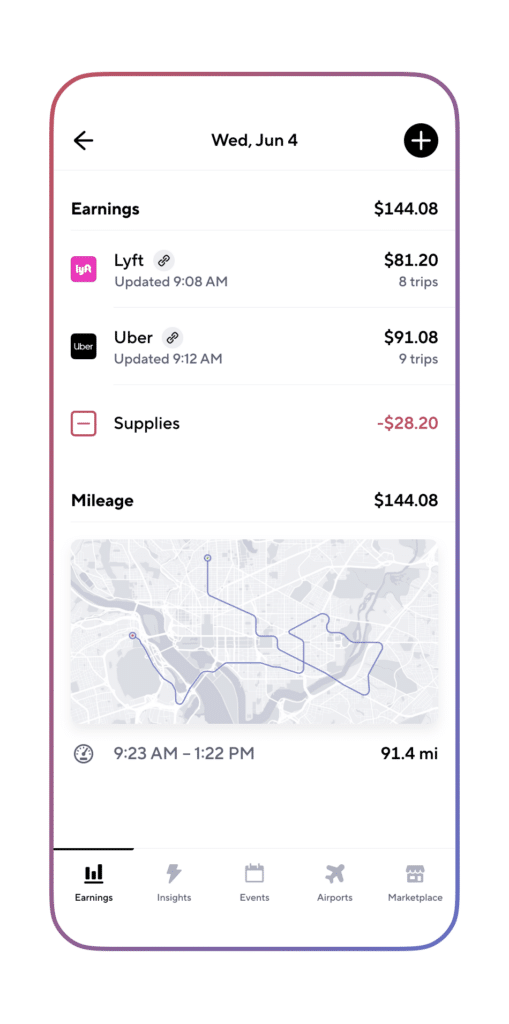
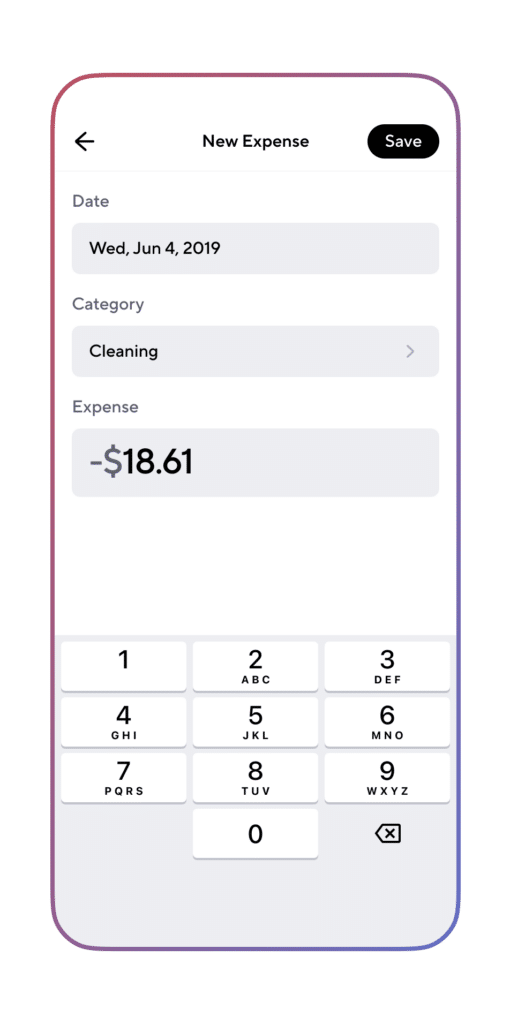
Are you looking for more Instacart resources?
- The Ultimate Guide To Being an Instacart Shopper
- Shipt vs. Instacart: Which is better for shoppers and drivers?
- Is driving for Instacart worth it?
- How to make $1000 a week with Instacart
- Check out the Gridwise Job Board
- How Much Do Uber Drivers Make?
- How Much Do Lyft Drivers Make?
- How Much Do DoorDash Drivers Make?
- Everything You Need to Know About Amazon Flex
- Walmart Spark Delivery Driver Pay: How Much Does a Walmart Spark Driver Make?
- How Much Do Shipt Shoppers Make?
- How Much Do Uber Eats Drivers Make?

Are Uber Eats Delivery Robots Coming for Your Job?
Uber Eats is shaking up food delivery by rolling out their Uber Eats Delivery Robots in cities like Los Angeles and Miami. This tech-forward move is part of a more significant trend in the gig economy to use automation for faster, more efficient service. Partnering with Serve Robotics, Uber Eats is introducing robots that can navigate busy sidewalks to get orders straight to customers.
What Uber Eats’ delivery robots rollout means for delivery
But what does this mean for drivers? An Uber Eats spokesperson for Euronews said in a recent article, "Because these pilots will initially be small, we do not anticipate discernible impacts to the marketplace or courier earnings, but we will be actively monitoring relevant metrics," a company spokesperson said.
Many fear what it could mean for job security. Is this a glimpse into a future where delivery jobs start to disappear? With these robots hitting the streets, it's more important than ever to understand how this shift could affect the gig economy—and how drivers can stay ahead of the curve.
How the Uber Eats delivery robot system works
The robots come from Serve Robotics, and they’re designed to make short-distance deliveries. They use AI, cameras, and sensors to avoid obstacles while cruising along sidewalks. Although mostly autonomous, human operators can take control for tricky tasks like crossing streets. Customers get live tracking and can unlock the robot’s cooler when it arrives.
Testing in Los Angeles and Miami
The rollout began in West Hollywood, where robots deliver for popular spots like Kreation Juicery. With plans to expand nationwide, Uber Eats expects to see thousands of robots operating in major cities soon.
Challenges & concerns about Uber Eats’ robot delivery
- Risk of Vandalism and Theft:
Drivers are worried these robots could become targets for vandalism or theft, especially in cities with larger homeless populations. Some fear they could also be damaged by people who see them as toys. - Navigation and Technical Issues:
Real-world obstacles like crowded sidewalks, bad weather, or blocked routes could be tough for robots to handle. Deliveries to complex locations, such as gated communities or tall buildings, might also cause delays. - Human Intervention and Regulatory Hurdles:
Even though robots are built to be autonomous, human intervention might still be needed in some cases, which could slow down the scaling of the program. Additionally, different states have their legal requirements, making it challenging to expand robot delivery services.
Will delivery robots affect driver jobs and pay?
The arrival of robot delivery has sparked fears of job losses among drivers. Uber Eats claims that robots will only cover short, simple deliveries, freeing drivers up for more profitable trips. Still, there’s a lingering concern that the growing use of automation could gradually reduce the number of delivery jobs.
What drivers can do to stay competitive
- Prioritize Efficiency:
As robots handle more short trips, drivers should focus on optimizing routes for longer, high-paying deliveries. Tools like Gridwise can help pinpoint peak times and the best areas to drive. - Stay Informed About Local Rules:
Cities will introduce robot deliveries at different speeds, so it’s essential to keep track of local regulations that may impact delivery zones. - Provide Outstanding Customer Service:
Personal touches can set drivers apart from robots. Going the extra mile for customer satisfaction can help maintain high ratings. - Broaden Your Income Sources:
Consider diversifying into other gigs, like rideshare, or learning new skills to stay financially stable. - Keep an Eye on Robot Issues:
Stay updated on common robot challenges like technical malfunctions or weather-related disruptions that could affect deliveries.
Preparing for the future of delivery
The rise of delivery robots is transforming the gig economy. While they aren’t likely to fully replace human drivers, they could change how deliveries are made, especially for short and low-value trips. By taking on simpler tasks, robots might free up drivers to focus on higher-paying opportunities. Those who adapt quickly could potentially see an increase in earnings.
However, this shift comes with its own set of challenges. Drivers must stay on top of robot adoption in various cities, follow any regulatory changes, and find ways to leverage their human skills, such as personalized customer service. Upskilling, diversifying income streams, and using tools like Gridwise to optimize driving strategies will be essential for gig workers who want to thrive in an increasingly automated world.
Robots may be taking over some tasks, but human drivers still have a crucial role to play. This is especially true for complex or high-touch delivery situations where a personal touch makes a difference. By staying prepared and adapting their strategies, gig workers can continue to succeed, even as the industry evolves.
Stay on top of the gig industry

Making Gig Mobility Data Even Easier to Leverage: Introducing Gridwise Analytics Reports
For more than three years, Gridwise Analytics has been a trusted partner for stakeholders seeking deeper insights into gig mobility. Our data-driven solutions enable organizations across the gig mobility, autonomous vehicle, financial services, and retail industries to make informed decisions with comprehensive market intelligence.
Here’s how we support each sector:
- Gig Mobility: We enable gig platforms to benchmark earnings, enhance driver loyalty, optimize operations, and improve pay structures, empowering them to remain competitive.
- Autonomous Vehicle Fleets: Our insights help autonomous vehicle companies create precise financial and operational models to more accurately predict performance and operational needs.
- Finance: Hedge funds, asset managers, and financial institutions leverage our data to forecast platform profitability, assess performance, and gain insights into the 80+ publicly traded merchants operating on these platforms.
- Quick-Service Restaurants (QSRs): Gridwise Analytics assists QSRs by benchmarking delivery performance, evaluating marketing campaigns, and identifying optimal locations for expansion.
Introducing Gridwise Reports: Simplified Access to Gig Mobility Data
While our data has already driven impactful results across various industries, we are dedicated to simplifying accessing and applying gig mobility insights.
That’s why we’re excited to introduce Gridwise Analytics Reports—a product suite consisting of 5 distinct reports designed to make gig mobility data more accessible and actionable for decision-makers. With Gridwise Reports, users can quickly gain insights without needing a dedicated data scientist or analyst, enabling faster, more efficient decision-making across teams.
The benefits of Gridwise Reports
- Comprehensive Insights: Gridwise Reports provides a complete view of market dynamics with detailed data on supply, demand, and operational trends.
- Easily Actionable: Our reports deliver clear, digestible insights that don’t require advanced data skills to interpret. This enables immediate decision-making, so customers can promptly act on timely information.
- Weekly Updates: Staying current is critical in a fast-moving industry. That’s why Gridwise Reports are updated weekly, delivering fresh data directly to users’ inboxes.
- Correlated with Public Data: Gridwise Reports are aligned with public gig mobility data so that users can trust in the accuracy and reliability of the insights provided.
Explore the Gridwise Analytics Reports Suite
The Gridwise Analytics suite features five distinct reports, each designed to help stakeholders comprehensively understand the gig economy. We’re thrilled to announce that our first two reports, the Gig Worker Pay and Engagement Report and the Rideshare Report, are available now. The Food Delivery, Grocery, and Merchant Delivery reports will be available by the end of Q4 2024.
Gig Worker Pay and Engagement Report
The Gig Worker Pay and Engagement Report helps companies benchmark competitor pay structures, analyze driver engagement, and optimize coverage across gig platforms.
Included Modules:
• Trip Pay: This module breaks down driver earnings per trip, including base pay, bonus pay, tips, and total pay, with details by time of day and day of week. These insights allow businesses to benchmark driver earnings across different conditions and periods.
• Worker Pay: Offering a holistic view of driver earnings over time, this module aggregates various pay components, including base pay, bonuses, and non-trip incentives. It helps businesses understand pay structures, assess compensation trends, and adjust to enhance driver retention.
• Retention and Engagement: This module tracks driver activity levels and engagement, measuring hours worked, active engagement, and retention rates over time. It enables companies to understand driver loyalty, which is crucial for workforce planning and improving long-term engagement.
• Multi-Apping: Focused on drivers who work across multiple platforms, this module provides insights into how drivers divide their time and earnings among different services. It helps businesses understand driver loyalty and competitive dynamics, enabling them to develop strategies to increase driver dedication to their platform.
Leveraging the Gig Worker Pay and Engagement Report allows decision-makers to visualize and better understand per trip pay, holistic worker pay, retention, and multi-apping trends.
Rideshare Report
Designed to help firms understand the rideshare sector, The Rideshare Report offers insights into driver pay, operational efficiency, and customer charges.
Included Modules:
• Pricing and Pay Metrics: This module provides detailed insights into driver earnings, customer charges, and platform take rates, broken down by time of day, trip distance, ride type, and airport-specific trips. These metrics enable businesses to analyze profitability trends and understand the financial impact of different trip conditions.
• Distance, Duration, and Operational Stats: By covering trip distances and durations and shift-level statistics like work hours and idle times, this module helps businesses evaluate worker utilization and optimize operational performance. By understanding these metrics, companies can improve efficiency and maximize driver productivity.
• Origin and Destination: This module provides insights into common origin-destination pairs within a market, helping companies understand regional demand and travel patterns. By analyzing these trends, businesses can optimize service coverage, identify high-traffic routes, and strategically plan for growth.
The Rideshare Report provides decision-makers with a comprehensive view of the rideshare sector, offering insights into key metrics such as customer charges, platform take rates, worker utilization, demand trends, travel patterns, and more.
Additional Reports
Food Delivery Report: This report dives into the industry, focusing on driver earnings, operational efficiency, and customer pricing. It’s ideal for businesses looking to understand or optimize delivery operations.
Grocery Report: This report offers an in-depth analysis of grocery delivery, including driver pay, operational metrics, and customer costs. This report helps businesses understand the unique demands of grocery delivery and optimize their performance.
Merchant Delivery Report: Designed for both merchant partners and financial services companies, this report provides insights into order volumes, delivery trends, and overall performance. It’s a valuable resource for QSRs and similar businesses to optimize delivery strategies and enhance customer satisfaction. Financial institutions can also leverage these insights to assess merchants' performance and growth potential within the gig economy, enabling better-informed investment decisions.
Take the Next Step with Gridwise Analytics Reports
The Gridwise Reports suite empowers companies to unlock more profound insights into the gig economy, with data tailored to specific sectors and operational needs. Whether you’re interested in benchmarking pay, optimizing delivery operations, or understanding regional demand trends, our reports provide the intelligence you need to make data-driven decisions confidently.
Ready to see the power of Gridwise Reports in action? Request a sample report today and explore how our data can enhance your strategic planning and keep your business ahead of the curve.
Work smarter. Earn more.
Whether you drive, deliver, or pick up shifts — Gridwise helps you track earnings, mileage, and performance so you stay in control of your work. Download the app and take charge today.
