The Q3 2026 Rideshare and Delivery Report:
Pay, Pricing, and Platform Fee Trends
Riders paid more, and platforms kept a bigger share of each fare. Drivers earned more per hour without completing more trips. In delivery, hourly pay depended a lot on the app.


Uber and Lyft kept a larger share of each fare in Q3. What happened to worker pay?
Four findings from the report
We compared Q3 2026 with Q3 2025 across customer prices, platform fees, driver pay, work hours, and delivery pay by app.
Rideshare platform fees
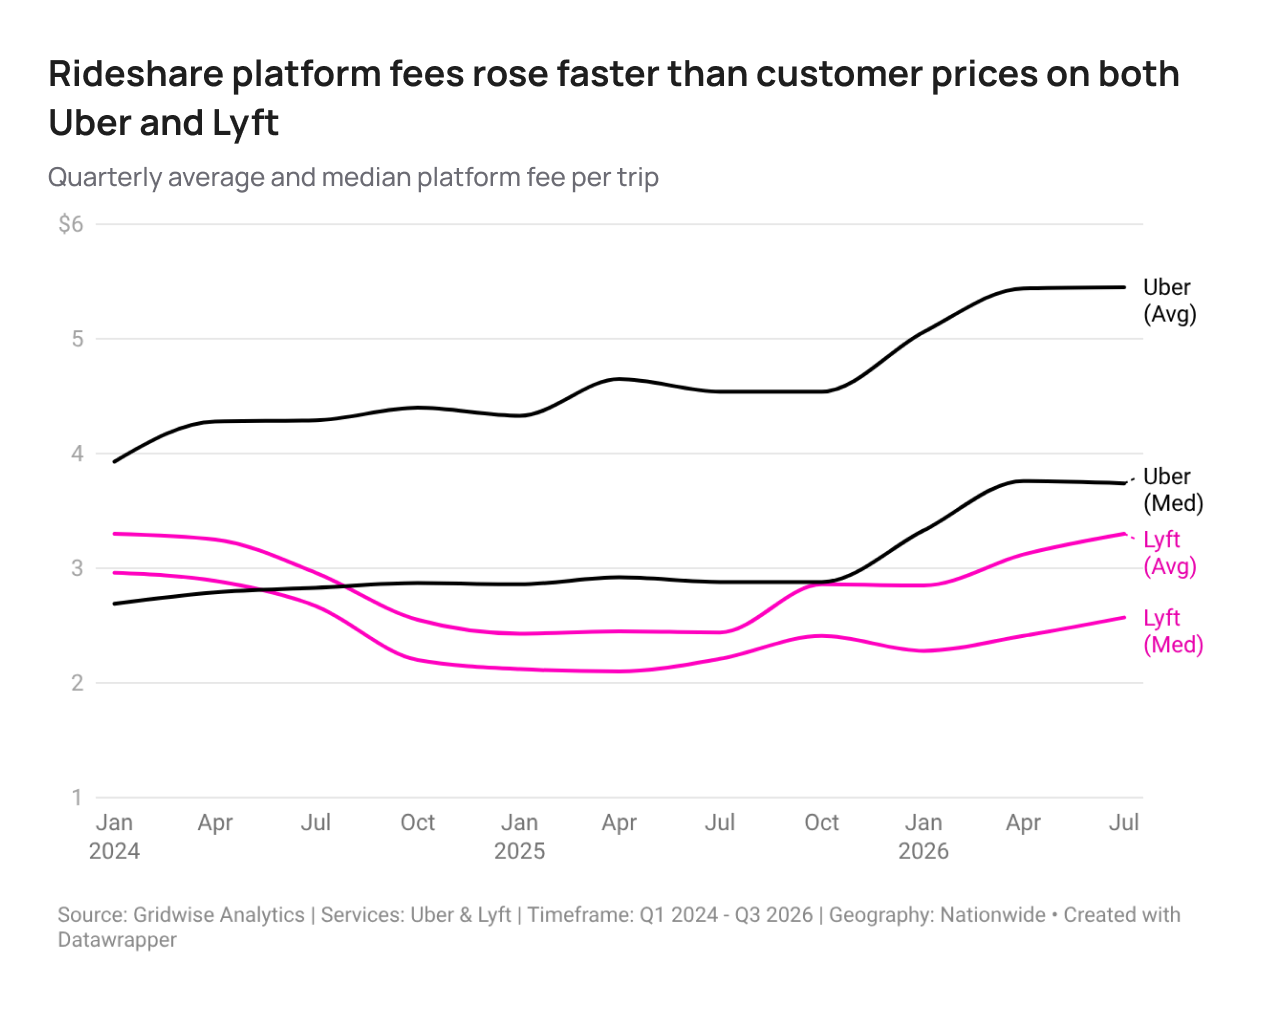
Lyft's platform fee rose faster than Uber's, but Uber still kept more per trip.
Lyft's average fare rose 6.2% to $19.76, while its average platform fee rose 35.2% to $3.30. Uber's fare rose 8.4% to $24.30, and its fee rose 20.0% to $5.45. Lyft had the larger percentage increase, while Uber had the larger dollar increase and the higher average fee per trip.
Rideshare pay per mile
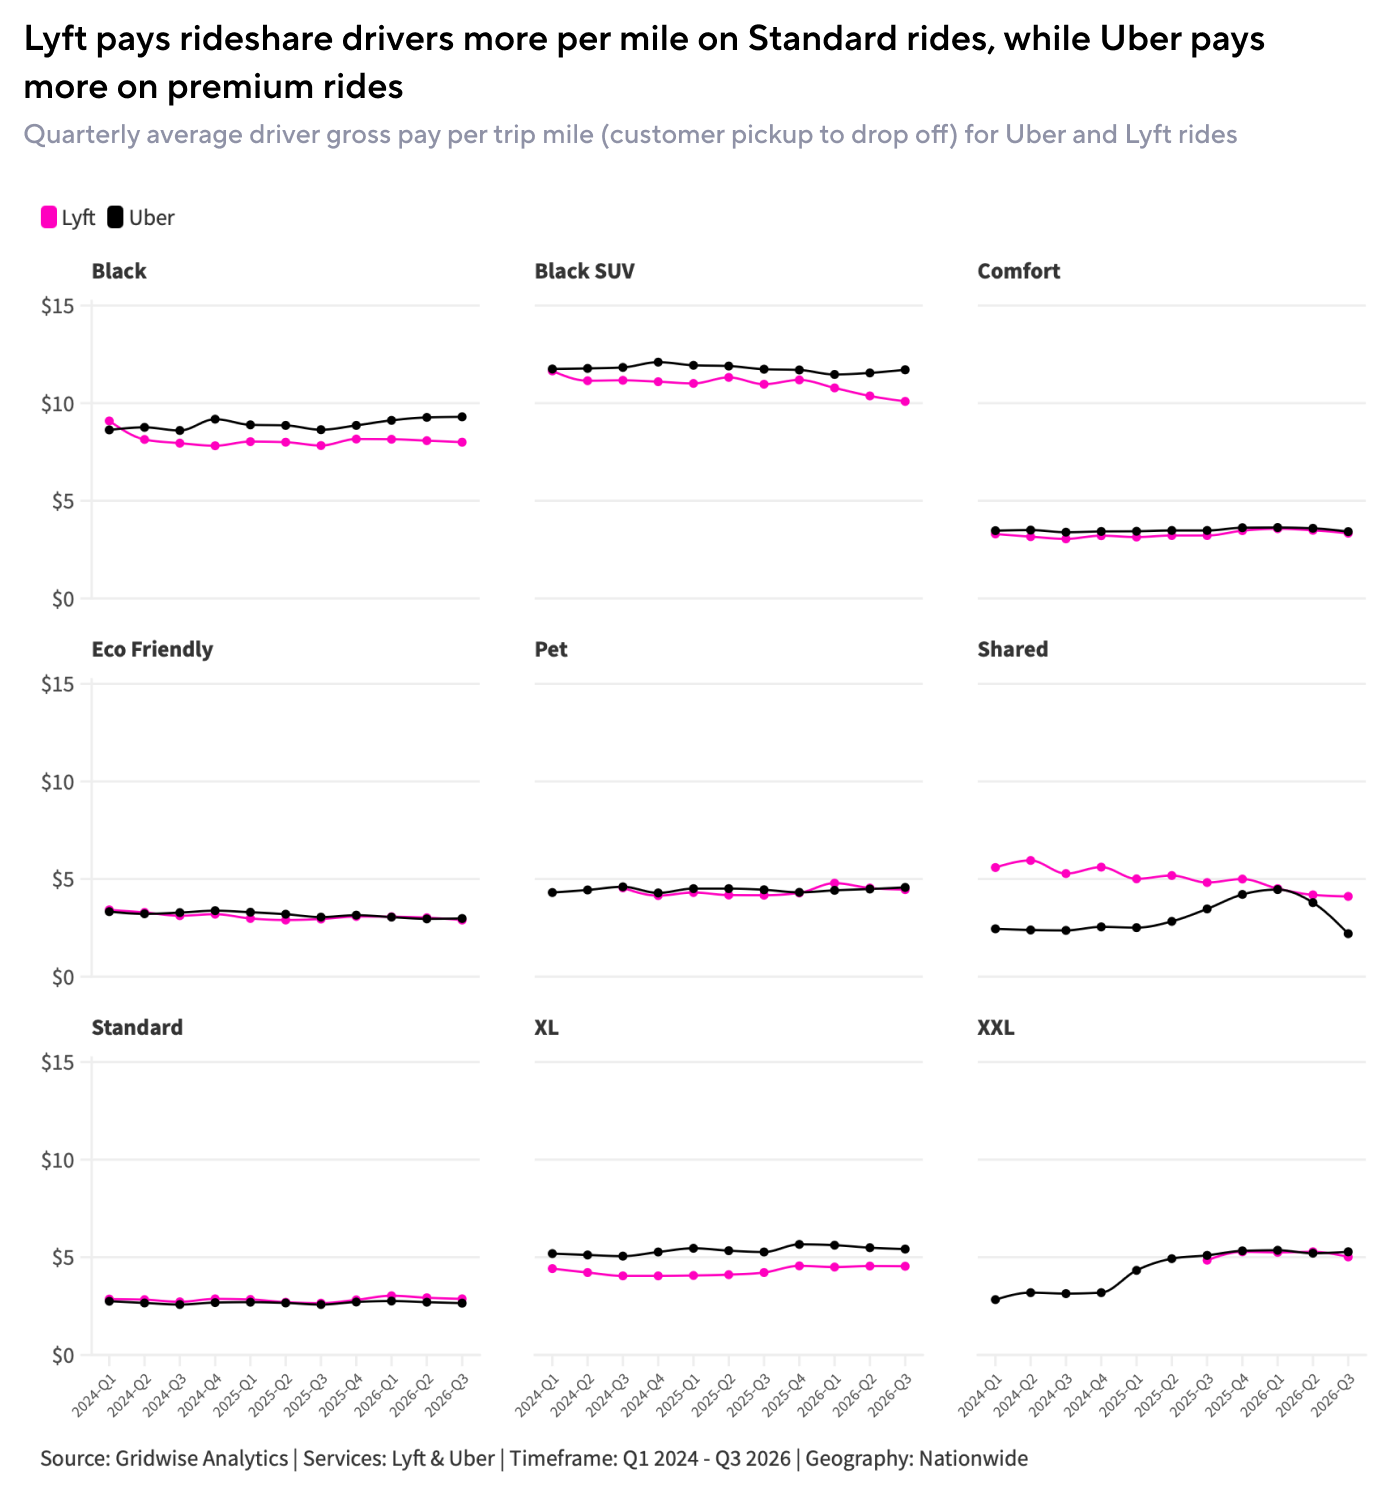
Lyft paid more per mile on Standard rides, while Uber paid more on premium rides.
On Standard rides, Lyft drivers' average gross pay per mile was $2.87 in Q3 2026, compared with $2.65 for Uber, 8% more. Lyft has paid more per mile than Uber on Standard rides since Q4 2023. Uber paid more per mile on premium rides: Uber Black paid $9.30 per mile, compared with $8.00 for Lyft Black, and Uber Black SUV paid $11.71, compared with $10.09 for Lyft Black SUV.
Rideshare driver pay
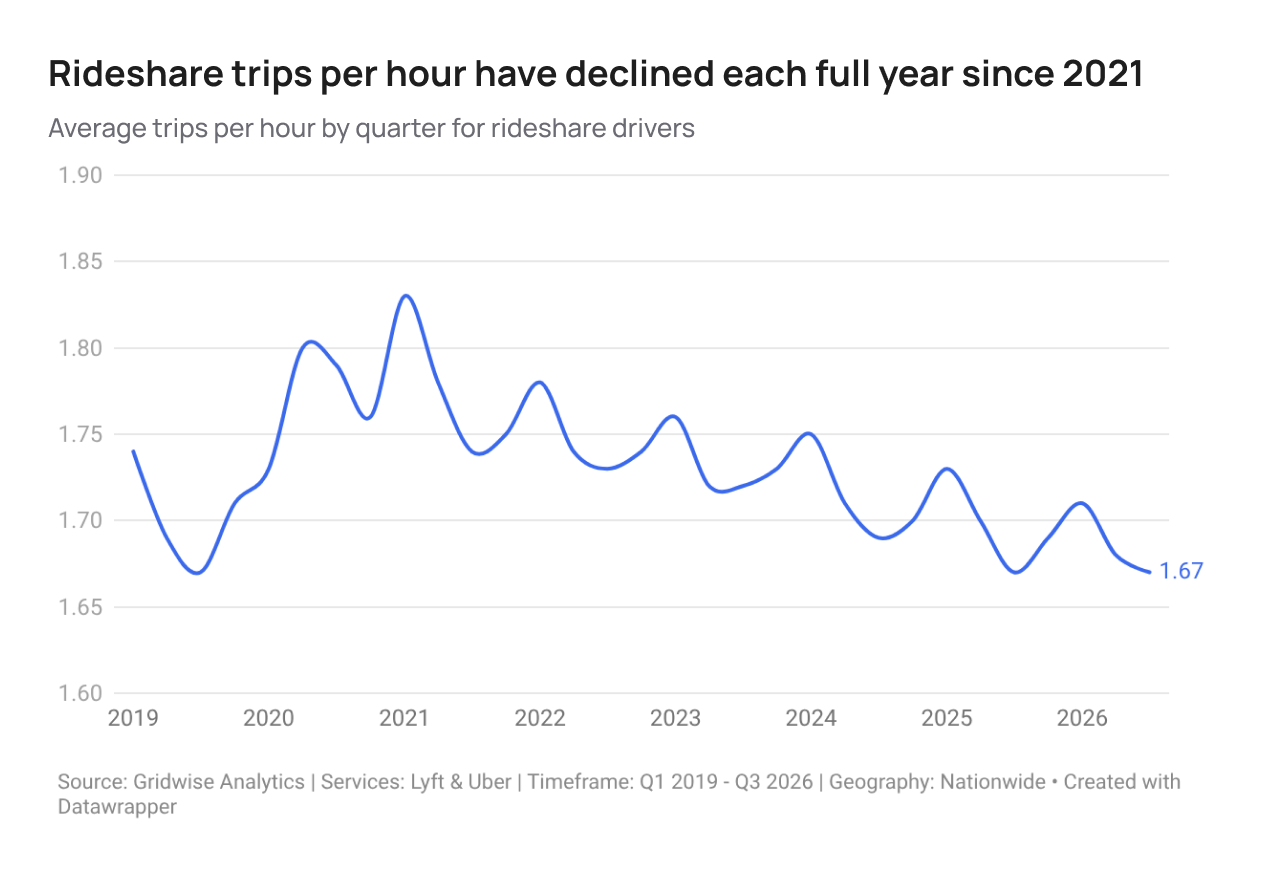
Drivers earned 8.3% more per hour, but they weren't any busier.
Hourly gross pay rose to $24.09, and quarterly gross pay rose 10.7% to $3,941. Drivers also worked 2.1% more hours. But they still completed 1.67 trips per working hour, tied for the lowest in Gridwise data.
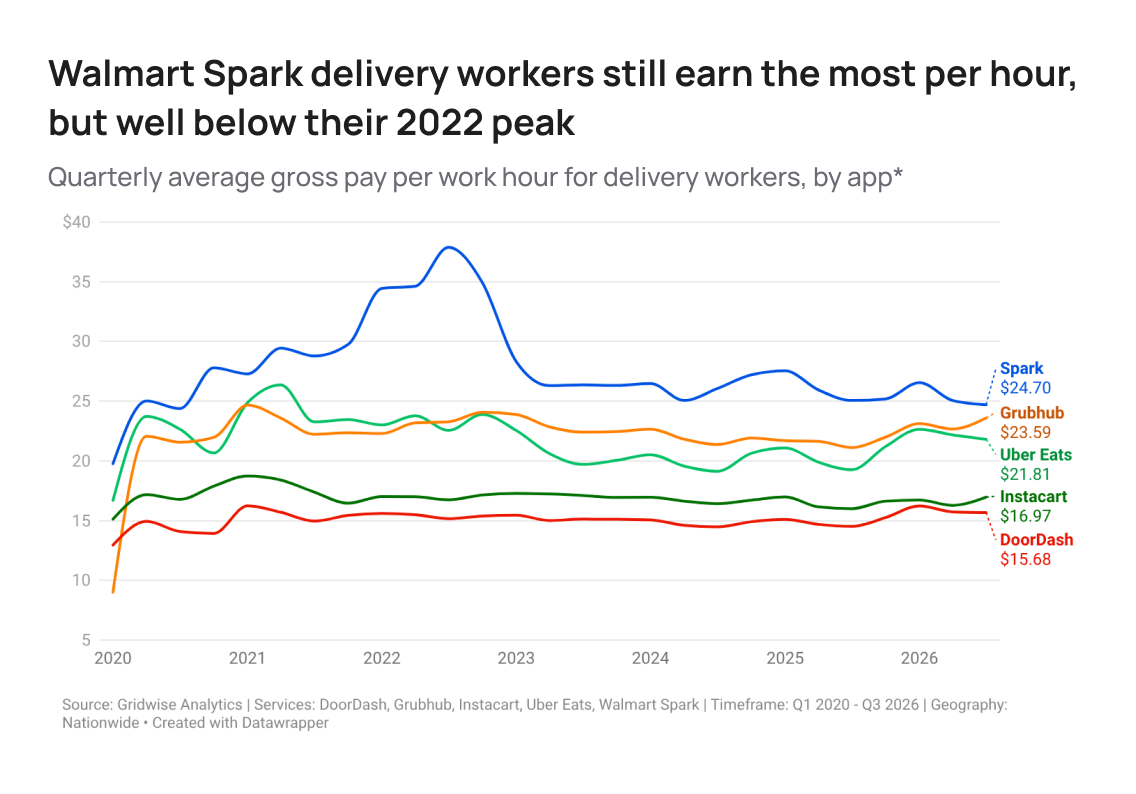
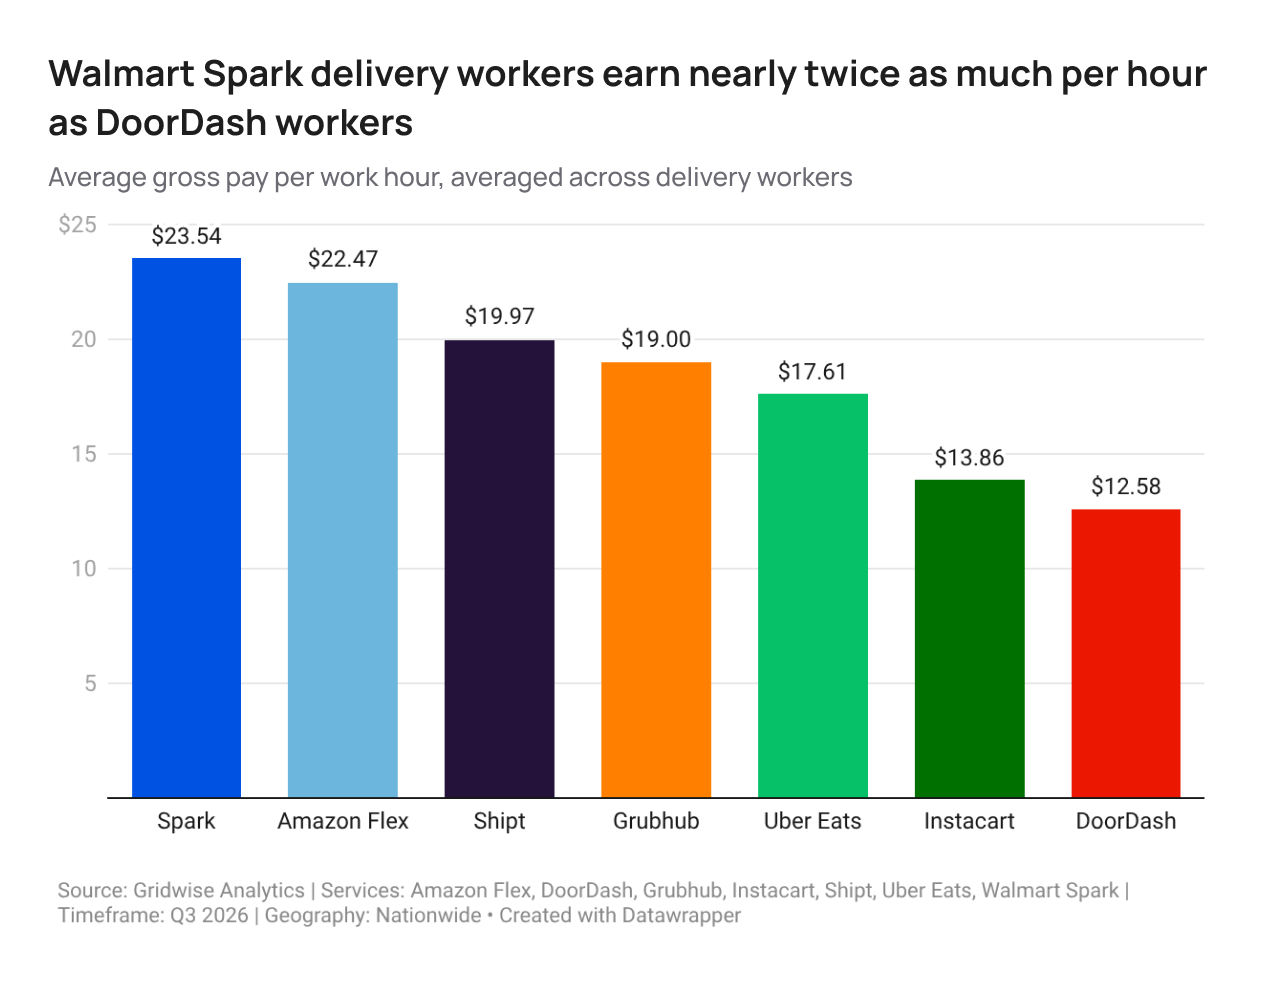
*Bar chart: Q3 2026 pay averaged across delivery workers. Trend chart: quarterly averages, so values differ slightly from the bar chart.
Delivery pay by app
Spark workers earned the most per hour, but Spark paid the least per mile.
Walmart Spark workers earned $23.54 per working hour, the most of seven apps and nearly twice as much as DoorDash workers at $12.58. Spark has stayed on top, but its hourly pay is still well below its 2022 peak, while Grubhub and DoorDash workers had their highest Q3 hourly pay yet. Per mile, the trend runs the other way: Uber Eats climbed to the top at $5.77, and Spark fell to $2.47, less than half of Uber Eats' rate.
Delivery batching
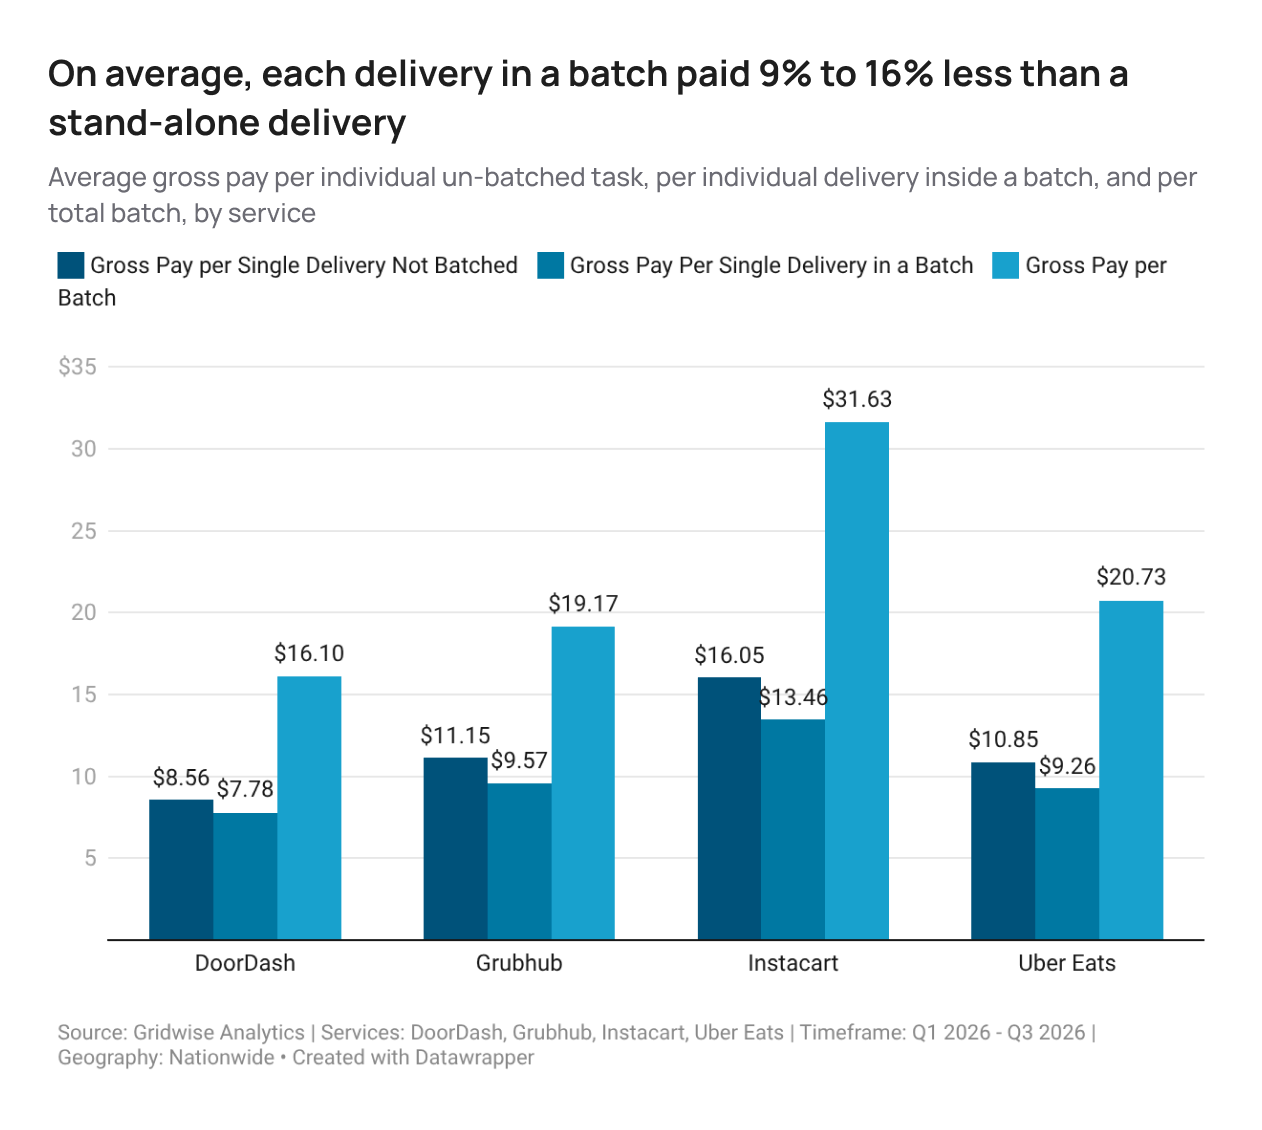
Each delivery in a batch paid less, but a full batch paid much more.
From Q1 through Q3 2026, 63% of Instacart grocery deliveries were part of a batch. On DoorDash, Grubhub, Uber Eats, and Instacart, each delivery in a batch paid 9% to 16% less than a stand-alone delivery. But a full batch paid $31.63 on Instacart, compared with $16.05 for a stand-alone delivery, and $16.10 on DoorDash, compared with $8.56.
Uber and Lyft kept a bigger share of each fare than a year earlier. Will platform fees keep rising faster than fares?
Download the reportSee how Uber, Lyft, and seven delivery apps compared
The full report includes:
- Uber and Lyft fares, platform fees, and fee rates, per trip and per mile
- Driver pay, hours, trips per hour, and gas costs, with data back to 2019
- Delivery pay by app (per hour, per delivery, and per mile), plus batching, order mix, and short deliveries
- How estimates built on Gridwise data compared with consensus on six Uber metrics