Gridwise blog
Tips, insights, and advice to help you earn more and work smarter, whether you do gig work, hourly, or shift work.
How to Make $1,000 a Week With Uber Eats in 2026 (Tips + Hourly Data)
In this blog, we'll explore the strategies and techniques that can show you how to earn $1000 per week as an Uber Eats delivery driver. We'll cover everything from optimizing your delivery zones and schedules to maximizing your tips and customer satisfaction. Whether you're a seasoned Uber Eats driver or just starting out, this guide will provide you with the insights and actionable steps to take your Uber Eats driver earnings to the next level.
Becoming an Uber Eats delivery partner can be a lucrative opportunity, especially if you're able to consistently earn $1000 a week. By understanding the platform, optimizing your delivery strategies, and focusing on customer satisfaction, you can maximize your earnings and turn Uber Eats into a reliable source of income.
We’ll cover the following topics to provide coaching and ideas to help you push your earnings up to that $1000 per week level:
[elementor-template id="20891"]
What do Uber Eats drivers do?
Uber Eats drivers deliver prepared food most of the time, but they also might shop for and deliver goods from convenience outlets and grocery stores. The job is pretty simple. You get a request for an order, you drive to the restaurant or store to pick it up, and then you deliver it to the customer. If you already drive for Uber, you can choose to take orders for Uber Eats delivery any time.
If you’re not an Uber Eats driver yet, it’s pretty easy to become one. This Gridwise post tells you what you need to do if you want to sign up and start making money Uber Eats style. Many rideshare drivers welcome the chance to deliver food rather than people. This article from Nerdwallet covers the Uber Eats gig from that angle.
There are some sweet advantages to working with Uber Eats. In lots of cities you don’t even need to have a car. You can use a bike or a scooter, or even walk, to make your rounds. If you do use a car, Uber Eats’ requirements are a lot easier to meet than they are for Uber rideshare driving.
You also have a lot of flexibility. You can shop and deliver convenience items and groceries, but you don’t have to. And, like most driving gigs, you can choose your own hours, and map out the locations where you want to work.
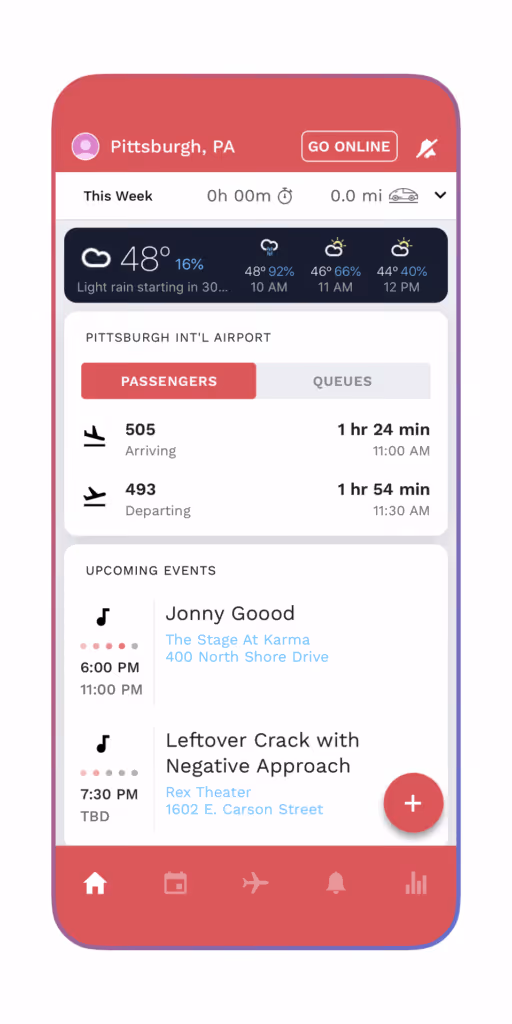
Use Gridwise features When to Drive and Where to Drive to help you figure out what work hours and which specific areas will be the most profitable for you. Real data from real delivery people will show you earning patterns for drivers in your town.
[elementor-template id="20949"]
How much can you earn doing Uber Eats?
The honest answer to this question is: basically, as much as you want! It all depends on how many hours you put in and how strategic you are about your gig. Earnings vary from one area to another, as this article from Entrepreneur points out. To give you a baseline, let’s look at the earnings of Uber Eats drivers who tracked their earnings with Gridwise.
Remember that these numbers show us only average earnings. To make $1,000 a week with Uber Eats, you’re going to have to be better than average, and we’ll show you how. For now, though, it’s good to have these figures so you get a ballpark number of where to start.
How much do Uber Eats drivers make?
Gridwise data tell us the following:
- Monthly earnings average around $444.00 per month.
- Gross earnings per trip are between $9.00 and $10.00.
- Tips make up about 50% of most Uber Eats drivers’ income, which amounts to about $225.00 per month.
Is Uber Eats good money? It can be. While there are other gigs that pay more per trip, if you drive for Uber Eats, you’ll always be pretty busy.
https://datawrapper.dwcdn.net/HPAz8/3
You can also see that, unlike many other gigs, tips play a huge role in Uber Eats earnings.

With these numbers as a baseline, what can we say about how to earn $1,000 a week with Uber Eats? As we said in the introduction, it’s going to be a hustle, but it’s really possible. To figure out how to make the most money with Uber Eats, let’s start by looking at how many trips these “average” drivers made each month.
We know that average gross earnings were $444.00 per month, and drivers got around $10.00 per trip. That means they took 44 or 45 trips per month, which breaks down to 11 trips per week. That’s not a lot of Uber Eats delivery, is it?
The fact that Uber Eats drivers averaged so few trips shows us that many drivers use more than one app at the same time. This is called multi-apping, and you can learn more about it in this Gridwise post. If you want to answer the question of how much you can make with Uber Eats, then you need to stick with the app and keep plugging away at those orders. You also need solid strategies, as well as some inside tips and tricks.
How to make the most money on Uber Eats: Delivery driving tactics
Getting to that $1,000 a week with Uber Eats isn’t so hard when you remember that the drivers we saw making about $111 a week were only taking around 11 trips in the same time period. That’s not much at all! If you work the Uber Eats app like a boss, you’ll soon have many more trips than that, easily reaching the number needed to get you to $1,000 a week. Now, let’s get to some tactics you’ll need to make that kind of bank.
- Stay with the Uber Eats app, and track your earnings. Gridwise can easily do that for you. Simply sync your Uber Eats app with Gridwise, and you’ll be able to see how much you’ve earned with Uber Eats, what times were most profitable, and your average hourly pay. Racking up trips with Uber Eats has other benefits, including perks and bonuses that are awarded to top drivers.
- Leverage surge pricing and promotions. Surge pricing is applied when there is a lot of demand. When surge pricing is in effect, many of the trips you make will pay more than usual. Promotions are offered to drivers who complete a given number of trips in a certain time period. High traffic volume days, nights, and times give you these chances to get extra earnings. Challenging yourself to complete the right number of trips for promotions will add to the number of trips you can count on for big bucks, too. Learn more about Uber Eats surge pay, boosts, and promotions in this Gridwise blog post.
- Say yes to doubling up on orders. With Uber Eats, you can get back-to-back orders or receive batched orders. Back-to-back orders happen when you receive a new request while you’re on the way to deliver an original order. The Uber Eats app routes these trips automatically, so you won’t be sent out of your way.
Batched orders are Uber Eats’ way of bundling together orders from either the same restaurant, or two nearby eating establishments. You get money—and trip count credit—for all the orders you complete, plus customer tips, without having to make a bunch of separate trips.
- Turn on the charm and get bigger tips. Being nice really is part of the Uber Eats driver’s job, and getting tips is one way people who drive for Uber Eats make money beyond their basic pay.. Bring along those extra napkins and condiments, use equipment that keeps food and drinks at the right temperatures and prevents spilling, and consider your customers’ needs. If you deliver groceries, be extra careful with delicate items such as bread and eggs.
And, most important, follow your customers’ directions, and stay in communication with them if you are going to be delayed, or if you have questions about their order. This Gridwise post will tell how to get bigger tips as a delivery driver.
- Use even more charm to keep your ratings high. As an Uber Eats driver, you will be rated by the restaurant or store where you pick up the orders as well as the customers who are waiting for the deliveries. This two-way rating system is designed to keep you on your toes, so Uber can keep people satisfied with your service. Don’t worry—you get to rate them, too.
There’s another reason why your rating as a driver is important. It not only keeps you in good standing with Uber; it helps you to qualify for the Uber Eats Pro incentive program. To learn more about Uber Eats Pro, and what it takes to earn perks such as preferred services, discounts, and deals, check out this Gridwise blog post.
Smart business moves that seal the deal
Now that you know how to gobble up the deliveries you need to make $1,000 a week with Uber Eats, it’s going to be a breeze to get there. Let’s make it even easier, with business moves that boost your earnings and shrink your expenses. If you use these, it will also be easy to say yes when people ask, “Can you make good money with Uber Eats?”
Minimize expenses. Avoid racking up big fast-food bills by bringing your own food and beverages. You might not think you’re hungry when you first start your Uber Eats run, but once the aroma of pepperoni pizza, premium cheeseburgers, and piping hot fries start wafting through your car, that might change. Bring a sandwich or other healthy food from home, and buy bottled water in bulk to save tons of cash compared to what it costs to buy single servings.
Maximize tax deductions. Another way to minimize your expenses is to maximize your tax deductions. Start by tracking mileage with Gridwise.
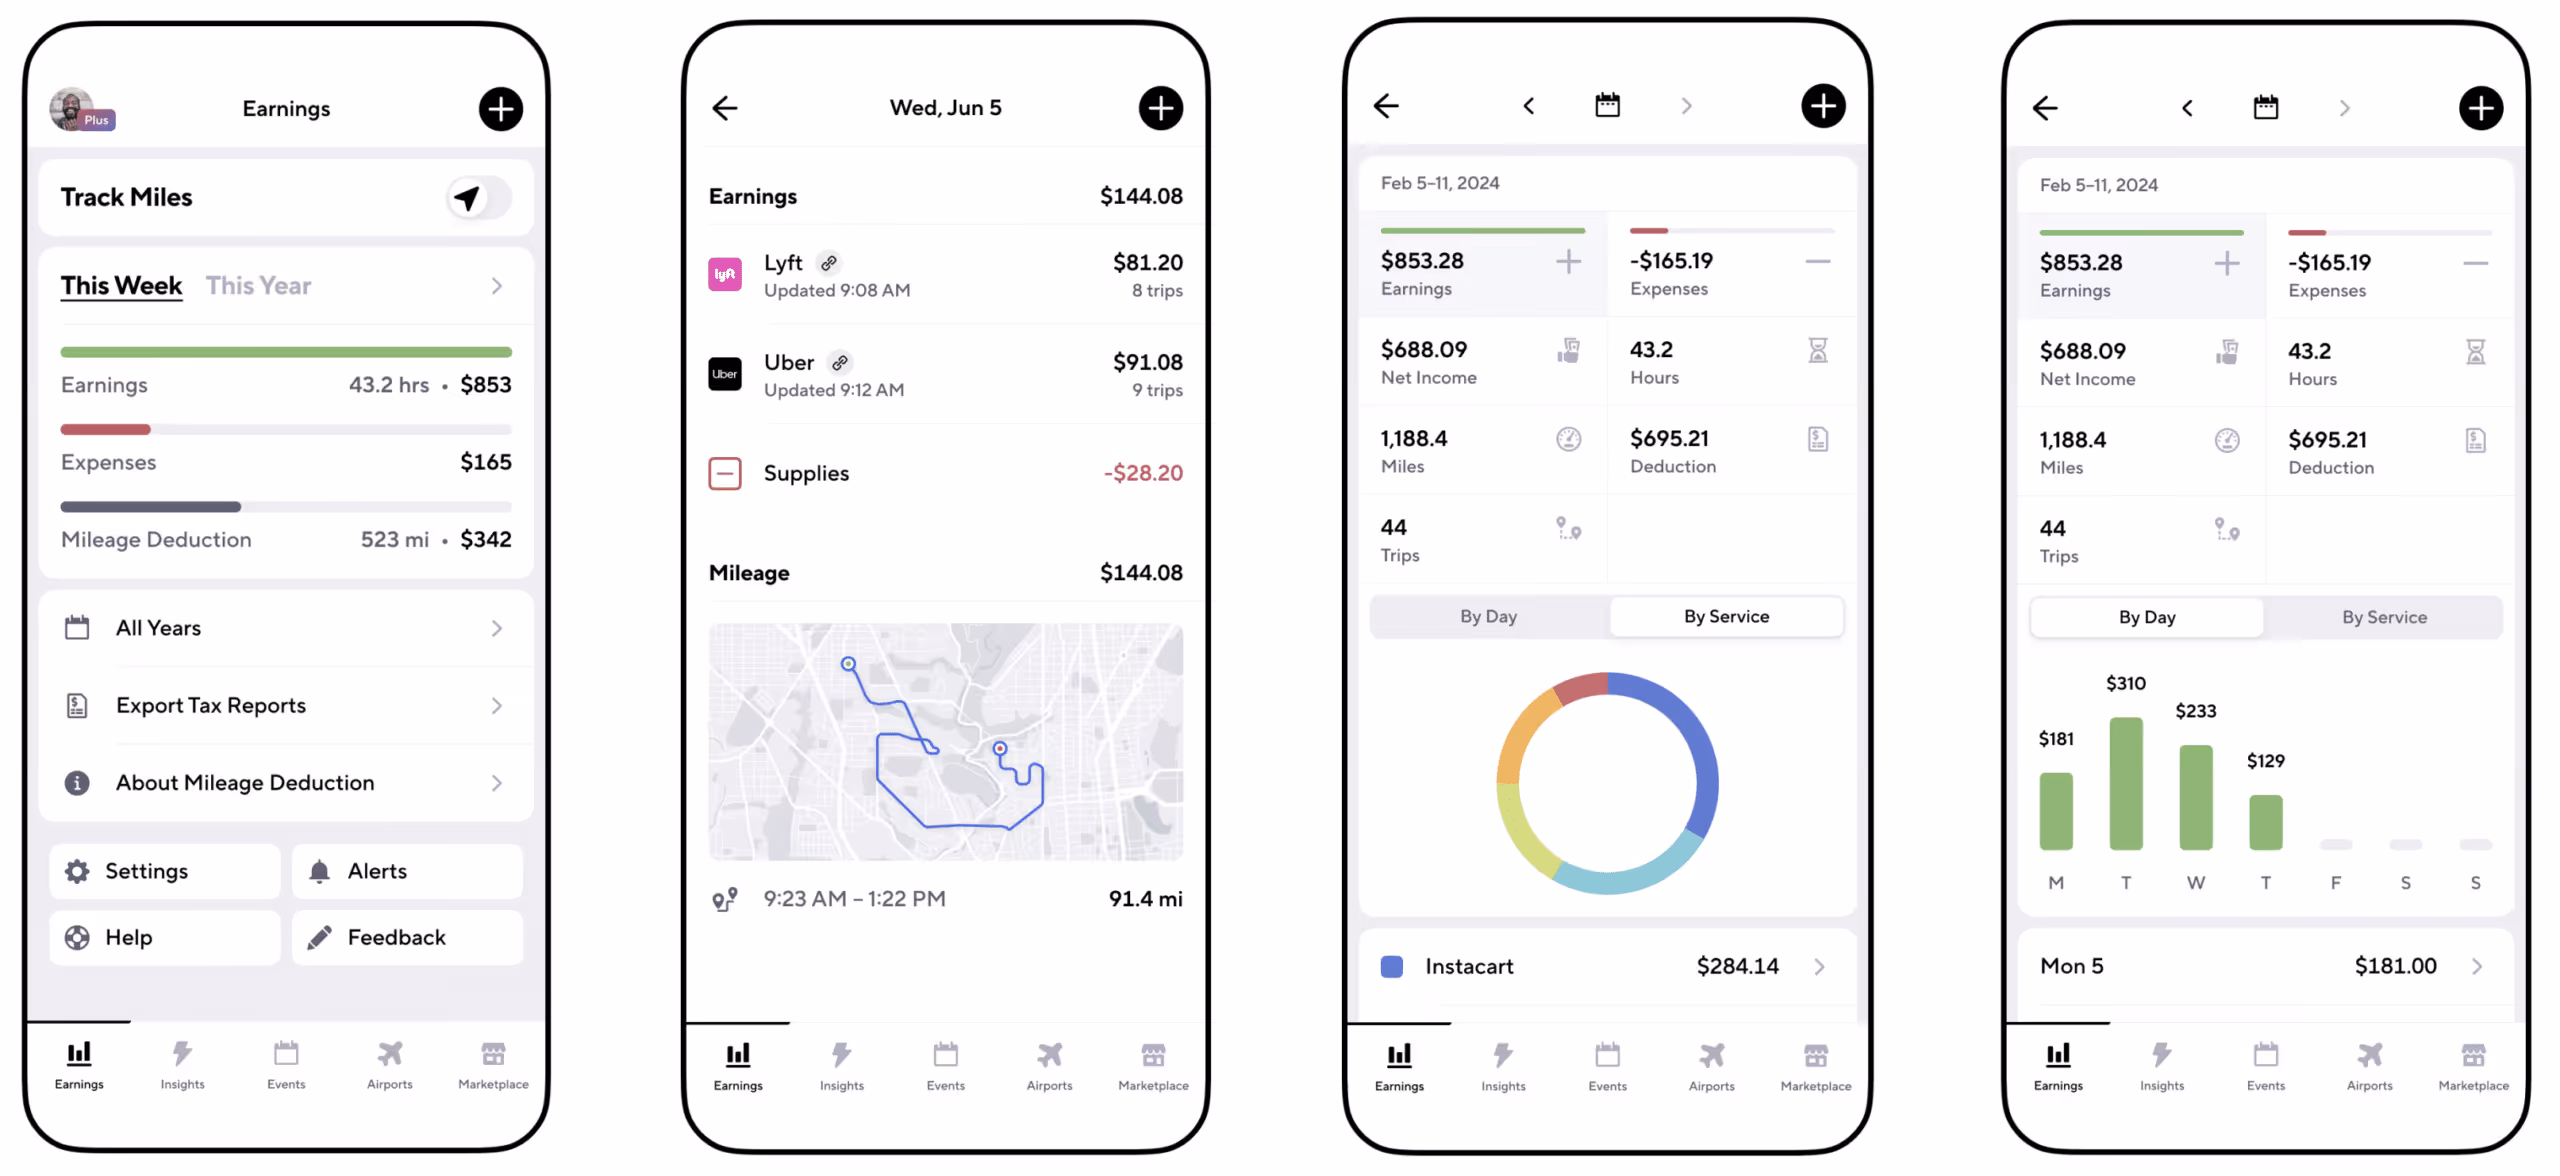
Gridwise App
Gridwise captures every deductible mile you drive, including the distance you cover between the trips your driving app records. Know what expenses you can deduct, and put them to work for you when tax time comes. Learn more about tax deduction strategies in the Gridwise Tax Guide for drivers.
Boost earnings with referrals
As an independent contractor, you’re probably looking for ways to make even more money than you can with Uber Eats. And most gig workers like you enjoy getting passive income. With Uber Eats, there’s a really easy way to do that—referrals!
All you need to do is find friends and encourage them to deliver for Uber Eats. If they make a certain number of deliveries within a specified time, you will get paid for doing nothing more than having them sign up under your referral code! Rates of pay vary by city, so check your Uber Eats app to find out what the current deal might be, and learn more about the referral program on the Uber Eats website.
Also remember: “friends” don’t have to be your best buds. Many delivery people carry cards with a QR code linking to their referral information, so just about anyone you encounter can join Uber Eats and boost your earnings. You could meet a source of passive income at the gas station, on social media, or at your high school reunion. The more you hustle, the more there is to gain, right?
Master the art of self-employment
As an Uber Eats driver, you’re an independent contractor. That means the company isn’t going to withhold your taxes, provide insurance, keep track of your earnings, or tell you about tax deductions. You’ll have to do all these things for yourself.
If you want to maximize your tax advantages, open an official business entity. You can incorporate (create a corporation) or you can work as a limited liability corporation (LLC). You can also work with a DBA (Doing Business As) arrangement, but the corporation or LLC will do a better job of protecting you from liability.
Establishing a corporation or LLC offers better tax advantages than being a sole proprietor. For instance, if you simply collect your earnings into your private account, you’ll be charged self-employment taxes in most states. And paying extra taxes is something we all want to avoid, within legal limits, as much as possible.
Every Uber Eats driver needs to learn about self-employment, and there are some great resources you can review. Check out the CareerOneStop website about self employment which will help explain the basics. You can also check with a professional tax accountant, or look other websites to learn more about actually creating a business.
Scope out your market
Look at the area around you to see where you’re likely to get the most deliveries. Where are all the restaurants? Where might people be more inclined to order deliveries? What hours do you want to drive? What activities might be going on around those times? Think about late-night and after-school times as well as breakfast, lunch, and dinner times.
Be realistic about the potential for your area and aware of new services opening up. For example, in New York, there is already a tab on the Uber Eats app that allows customers to order groceries. In our article about the best food delivery service to work for you’ll see that Uber Eats stacks up well against other delivery companies, mainly because of its potential for expanded opportunities for drivers to earn.
So, is Uber Eats good money? As we said, it isn’t an automatic guarantee that everyone will make $1,000 a week with Uber Eats. Trying out the suggestions we give you here, though, should put you on the right track! Go out there and start stacking up those orders and raking in some impressive earnings!
[elementor-template id="20936"]
Get more inside information on Uber Eats in these posts from the Gridwise blog:
- The delivery driver guide: Using the Uber Eats app
- Everything you need to know about driving for Uber Eats
- Uber Eats Pro: What drivers need to know
- Looking for a different gig, part-time or full time job? Check out the Gridwise Job board.
Uber Eats FAQ
How does the Uber Eats platform work for drivers?
Uber Eats is a food delivery service that connects customers with local restaurants and independent delivery partners. As an Uber Eats driver, you'll receive notifications of nearby delivery requests, which you can accept and complete. The platform provides flexibility, allowing you to work on your own schedule and earn money based on the number of deliveries you complete.
What are the requirements to become an Uber Eats delivery partner?
To become an Uber Eats delivery partner, you'll need to meet certain requirements, such as having a valid driver's license, a registered vehicle, and passing a background check.
How can I choose the right delivery zone to maximize my earnings?
Selecting the right delivery zone can significantly impact your earnings, as some areas may have higher demand and better-paying orders. It's important to research and identify the zones in your area that tend to have the most consistent and lucrative delivery opportunities.
How can I take advantage of peak delivery hours and surge pricing?
Understanding peak delivery hours, such as mealtimes and weekends, and taking advantage of surge pricing can boost your earnings. Be aware of when demand is highest in your area and adjust your schedule accordingly to capitalize on these peak periods.
What are some tips for maximizing tips and customer satisfaction?
Providing excellent customer service and going the extra mile to ensure a positive experience can lead to more tips and repeat business. Prioritize communication, timeliness, and attention to detail to keep your customers happy and satisfied.
How can I set realistic weekly goals to reach my $1000 target?
To make $1000 a week with Uber Eats, it's essential to set realistic weekly goals and track your earnings and expenses. Start by determining your target earnings and breaking it down into achievable daily or weekly goals. This will help you stay on track and make adjustments as needed.
What are some strategies for efficient route planning and navigation?
Effective route planning and navigation can save you time and fuel, allowing you to complete more deliveries. Utilize mapping apps and take advantage of features like real-time traffic updates and turn-by-turn directions to find the quickest routes.
How can I balance my Uber Eats deliveries with other commitments?
Develop a schedule that allows you to capitalize on peak delivery hours while still maintaining a healthy work-life balance. Consider using tools like calendar apps to plan your availability and track your hours to ensure you're maximizing your earning potential without sacrificing your personal life.
What are the key considerations for maintaining my vehicle as an Uber Eats driver?
Keeping your car clean and well-maintained is crucial for maximizing your Uber Eats earnings. Regularly scheduled oil changes, tire rotations, and other preventive maintenance can help extend the life of your vehicle and minimize downtime. Additionally, budgeting for vehicle-related expenses, such as fuel, insurance, and repairs, will ensure you're accounting for these costs and maximizing your net earnings.
What are the tax obligations and legal considerations for Uber Eats drivers?
As an Uber Eats delivery driver, it's essential to understand the tax obligations and legal considerations that come with being an independent contractor. This includes properly reporting your earnings, deducting eligible business expenses, and making quarterly estimated tax payments. Additionally, you'll need to ensure you have the appropriate insurance coverage, such as personal auto insurance and possibly commercial auto insurance, to protect yourself and your vehicle while on the road making deliveries.

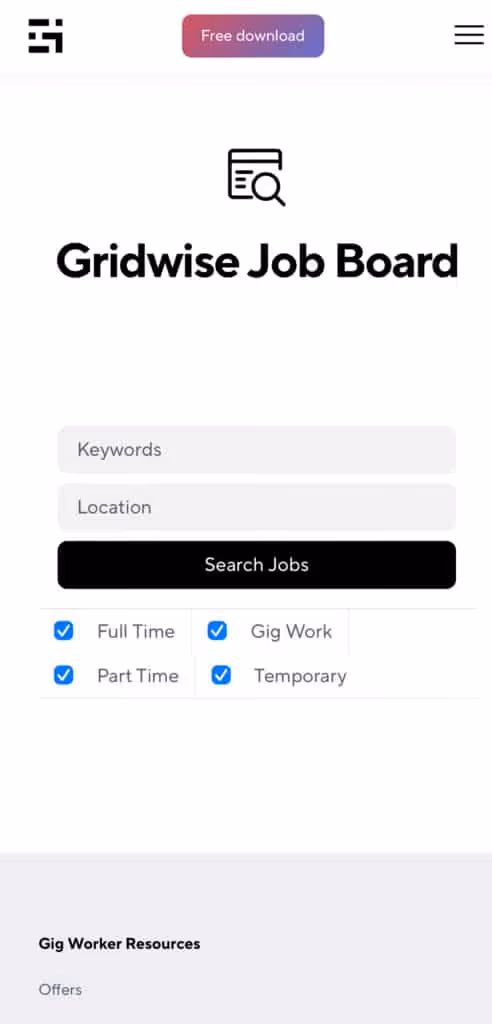
The Gridwise Job Board: Find Your Ideal Job or Gig Work
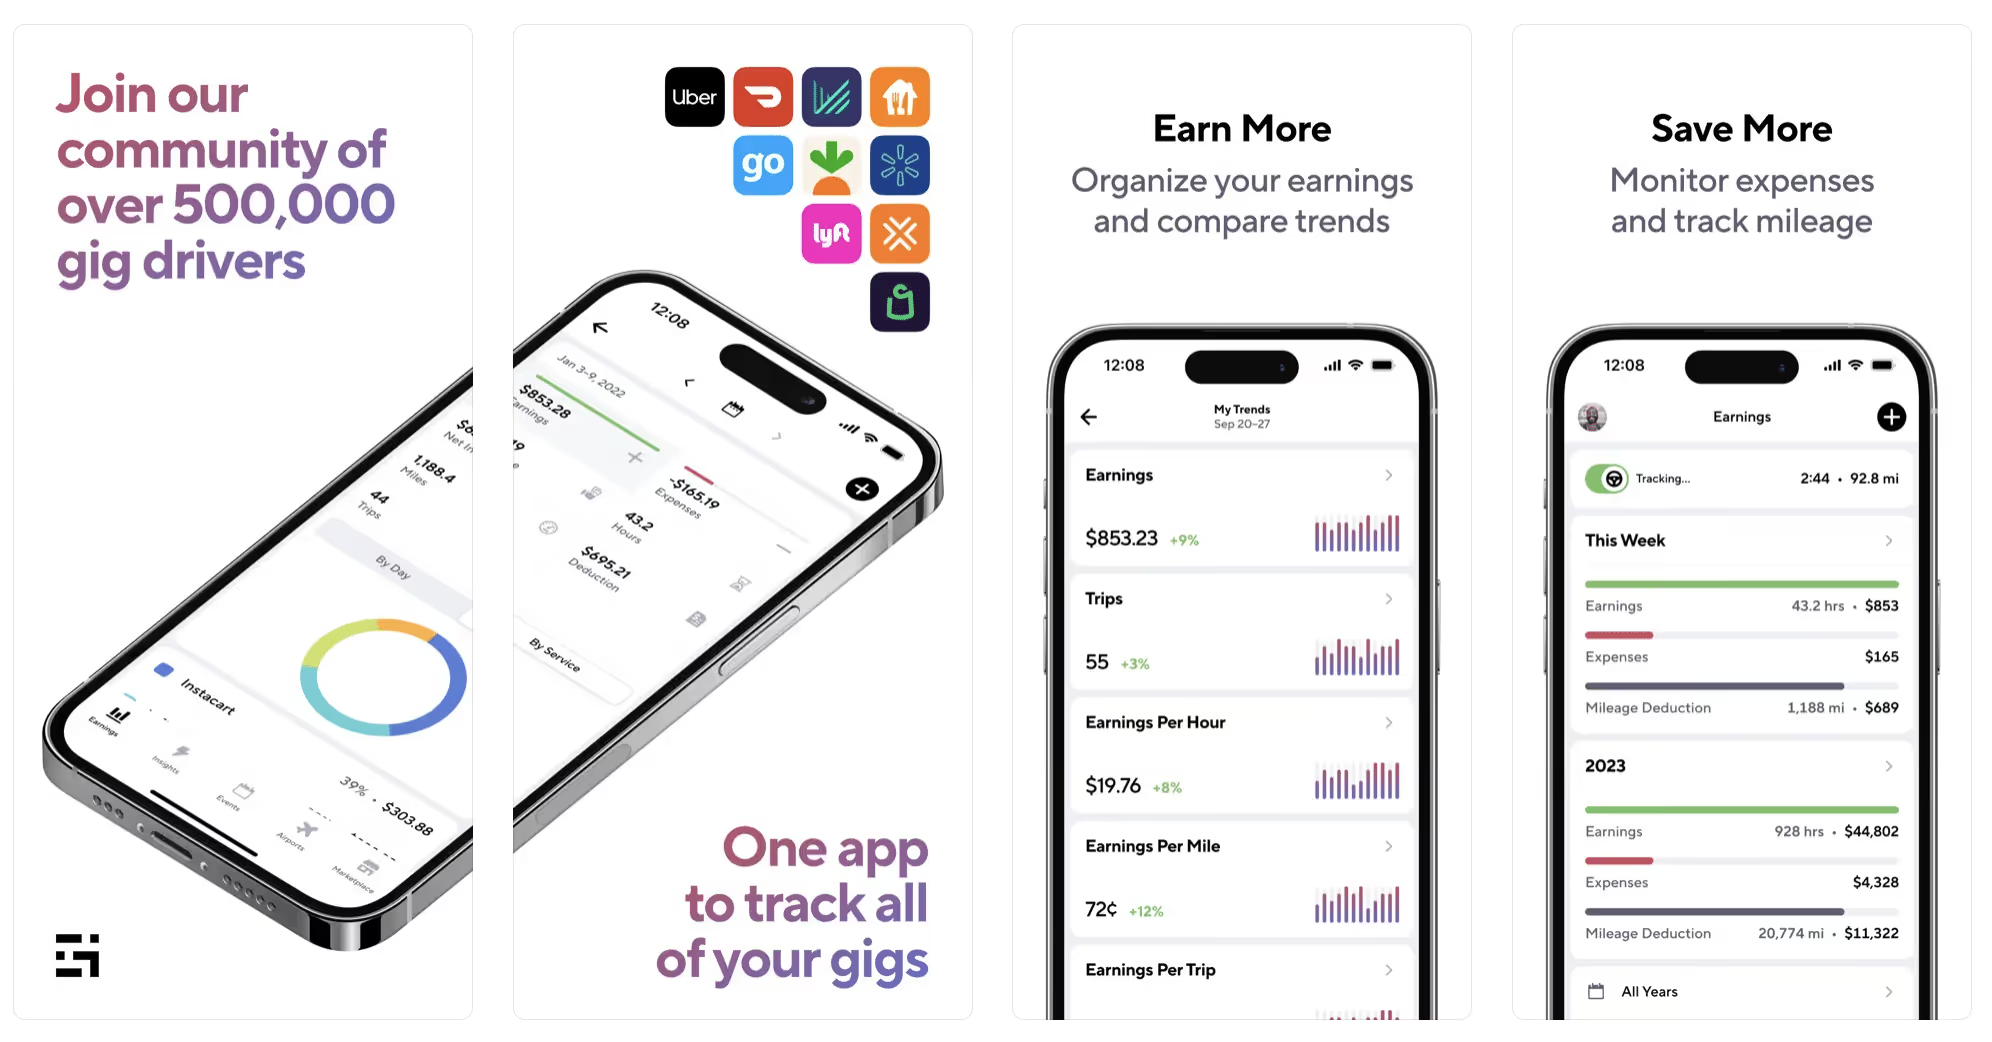
Gridwise is an essential assistant app created by gig workers for gig workers. Our mission is to support those engaged in gig work in every way possible. We understand how challenging it can be to deal with income instability, a lack of benefits, and job insecurity that often comes with gig work. The Gridwise app tracks and organizes earnings and expenses, and offers a wide array of discounts, deals, and services that make the lives of independent contractors easier and more rewarding.
We firmly believe it’s possible to make a viable living and create a gig experience that offers flexible hours, variety, and excitement. With issues such as consistent earnings and job security in mind, Gridwise is proud to offer a centralized platform that shows you how to find gig work and secure reliable opportunities. We’re proud to introduce the Gridwise Job Board.
[elementor-template id="20891"]
The Gridwise Job Board: Key features
Because Gridwise is dedicated to serving the gig worker community, we’ve filled the Gridwise Job Board with useful features that won’t waste your precious time.
- Comprehensive listings. Find part-time, full-time, temporary, and per-task work. Drive or deliver with your vehicle, utilize an employer’s vehicle, or even find non-driving gig work.
- User-friendly interface. Find the jobs that are right for you with a tap of your screen.
- Verified opportunities. We vet the jobs before they are listed to ensure you’re getting high-quality job postings.
How to get more gig work, seasonal, part-time or full-time jobs with the Gridwise Job Board
Looking specifically for “gig work apps” or “gig jobs near me?” You’re in luck. Our filters and search functions send you directly to the listings you seek.
Here’s how it works.
- Access the Job Board via the Gridwise website.
- Search for jobs by type, location, and more.
- Select the job that interests you, and read all about it.
- Scroll through the description, and if it appeals to you, click “Apply for job.”
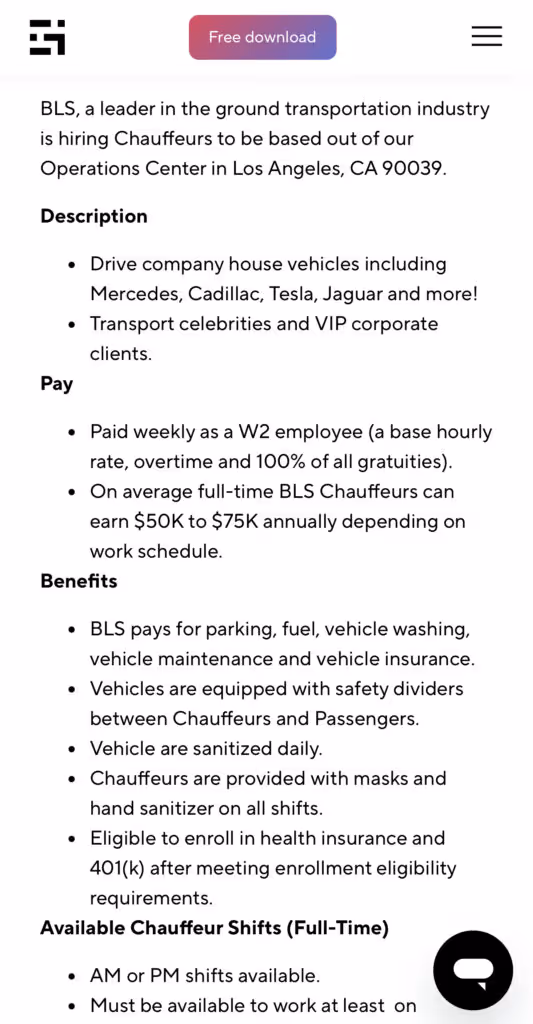
Many types of jobs are available. Adjust the search filter to see the full variety of opportunities that will let you cash in. Deliver food, set up catering, do rideshare driving, get paid for doing package delivery, and much more. You’ll find short-term gigs, long-term contracts, and part-time positions.
Perks of the Gridwise Job Board for gig workers
Gig workers who know how to make extra money will appreciate how the Gridwise Job Board lets you multiply your chances of bringing in big earnings. Here’s how:
- Increased stability. Use the Gridwise Job Board to find part-time or permanent jobs in addition to the part-time gigs you already have. Always keep a steady stream of earning opportunities flowing toward you.
- Flexibility and autonomy. Choose jobs that fit your schedule, work around other jobs and family duties, and still leave room for some fun in your life. Discover side hustles to supplement your full-time job, permanently or just for the season.
- Skill development. Find part-time work that lets you use a skill you already have, or try your hand at something new. It’s a smart way to develop a portfolio to showcase what you can do, or even to find permanent employment.
Get Gridwise and stay up to date on the Gridwise Job Board
Gig workers need plenty of information and assistance, and Gridwise is here to give it to you. Download the app and get essential features such as
- seamless earnings tracking
- mileage tracking
- expense recording, including notes
- low-cost and no-cost insurance benefits
- access to affordable medical, dental, vision, mental health, and alternative care
- professional services including legal and financial help
- deals and discounts
- weather, events, and traffic reports
- inside information on where and when to drive
[elementor-template id="20936"]
More to know about gig work:

5 Best Mileage Trackers For Gig Drivers
Many drivers ask, “Do I really need a mileage tracking app?” The answer is simple: only if you want to have an accurate count of all the miles you can legally deduct from your taxable income! You might think your rideshare or delivery driving app has got you covered. After all, they do quite a good job of logging the miles you drive while you’re on a trip or delivery. But, if you want to have the best app to track mileage for Uber, Lyft, Doordash, Instacart, or the other apps you may use, you need more. Why is that?
Without a separate tracker, you’re missing the miles you drive in between pings. Did you realize that all the miles you drive, from the moment you begin your shift until it’s over (as long as you don’t drive several miles on a break to hang with your friends), are tax deductible! That means you need something besides your driving app to keep an accurate count of your travels. Read this Gridwise post to see how important it is to keep track of every deductible mile.
You won’t be surprised to hear that there’s an app for tracking miles. In fact, there are several of them. Here, we’re going to tell you about five top mileage tracking apps, and help you figure out which one is best for you.
Before we get to the list and identify the best mileage tracker app, let’s clarify what exactly a mileage tracking app is. According to G2.com’s technology glossary, mileage tracking is done for the purpose of keeping a log of mileage that is either reimbursable or tax deductible.
And yes, of course you can track your miles simply by taking readings on your odometer. But are you really prepared to account for how many miles you drove for personal reasons and subtract them from the total to get your business mileage? Even if you can remember all that and do the arithmetic, if you want an accurate reading of the miles you drive for business, and can therefore deduct, a mileage tracking app will save you a lot of trouble and prevent you from making costly errors.
Plus, as a gig driver, you have specific needs when it comes to a mileage tracker. Ideally, you’d be able to handle mileage tracking and several other functions all in one app. It can be maddening enough to deal with driving apps, particularly if you’re an avid multi-apper. You would want your mileage tracker app to help you keep account of other aspects of your business, including income, expenses, and inside information about the art of gig driving.
Not all mileage apps are equal, to be sure! Let’s look at five of the best apps to track mileage and figure out which is the best app to track mileage with Uber and Lyft, or what mileage tracker app is best for DoorDash.
[elementor-template id="20891"]
1. Zoho Expense
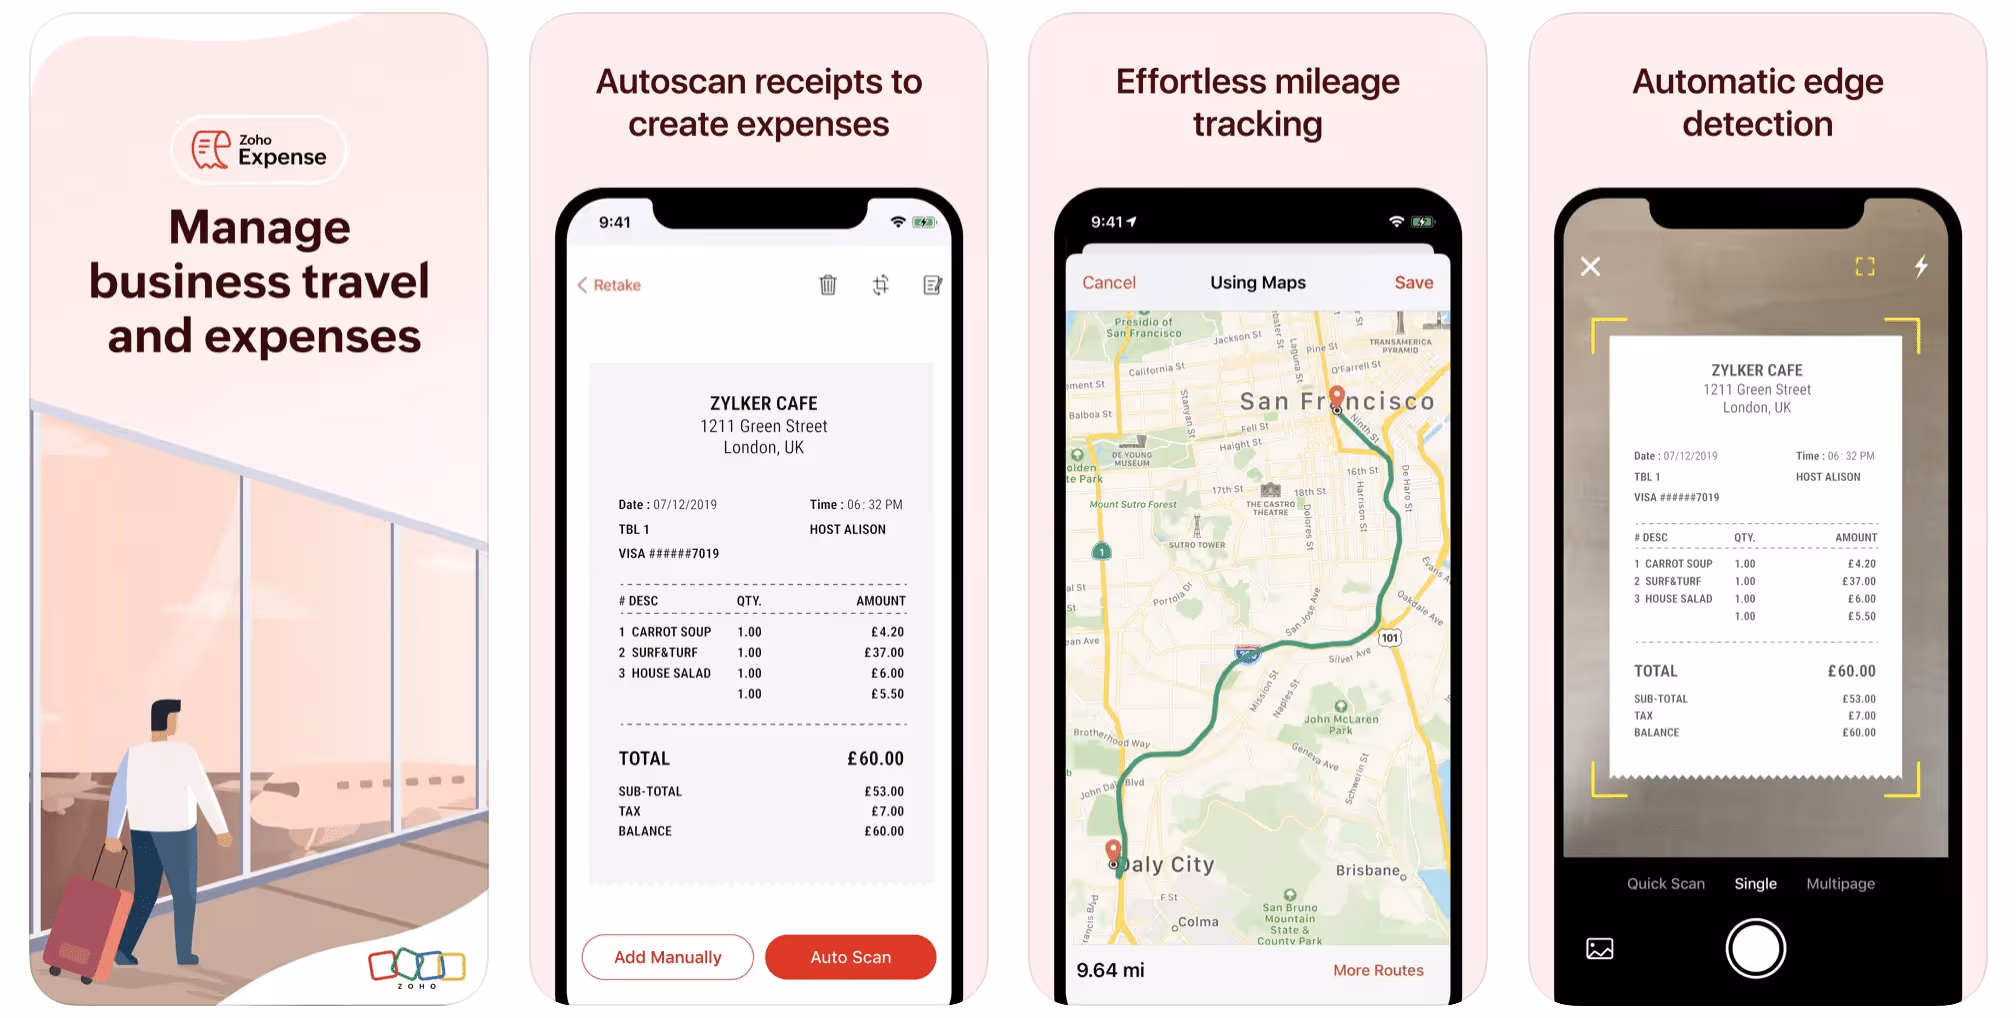
First up is Zoho Expense, which does exactly what its name says. This app is designed to allow companies to give employees a uniform way to create and submit expense reports. It can be used by individuals, including gig drivers, as well.
It includes a mileage tracker, as well as features that let you track other deductible expenses, including the ability to scan and record receipts.
Available on Android and Apple: Yes
Ratings: 4.8 stars on App Store, 4.7 stars on Google Play
Free Version: Yes
Subscription price: $3 per month, billed annually
Created specifically for gig drivers: No
2. Quickbooks Online
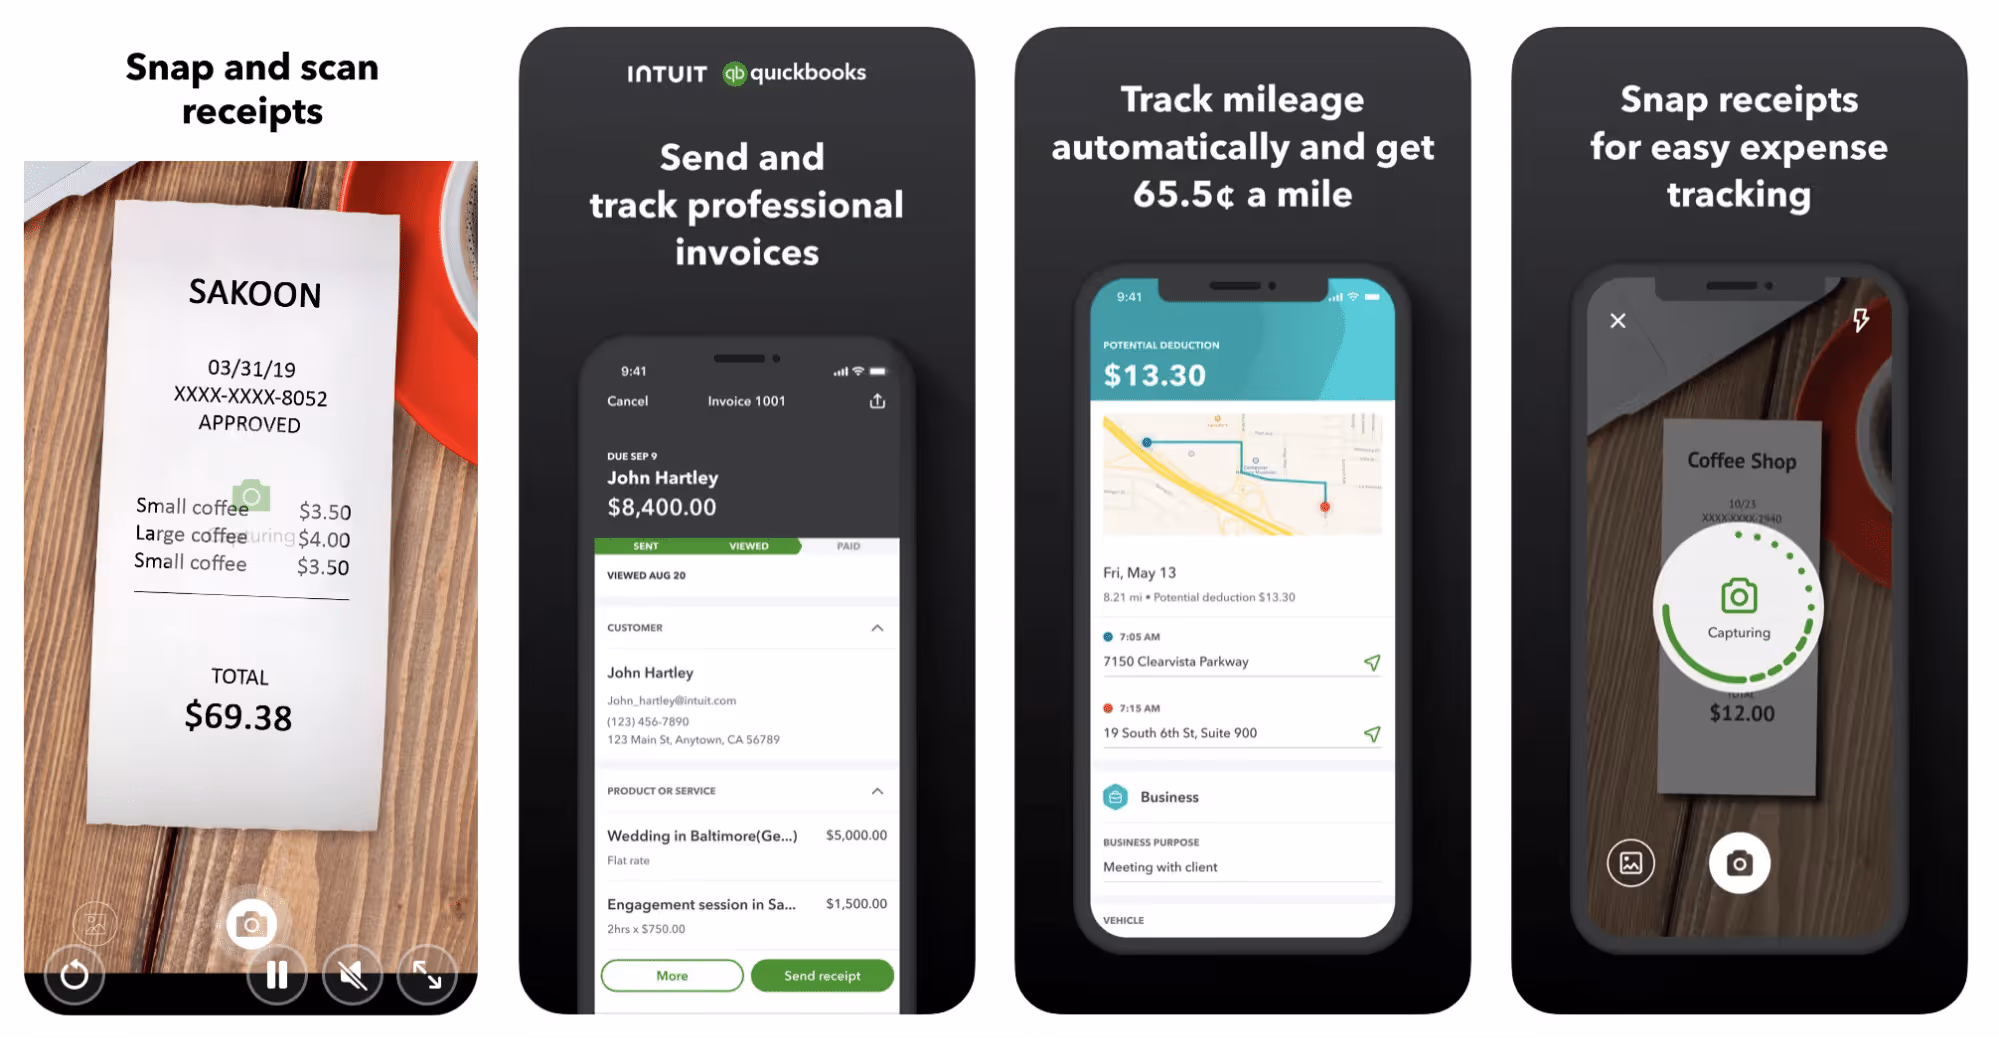
Quickbooks Online is a cloud-based app that allows you to track your mileage, earnings, and expenses. The information you enter can then be used to generate various reports that prepare you for tax time. It also allows you to create graphs that illustrate your cash flow, and includes a receipt scanner so you can instantly record deductible expenses. Quickbooks is popular, highly reliable, and designed mainly to help people keep track of their small businesses.
Available on Android and Apple: Yes
Ratings: 4.7 stars on App Store, 4.4 stars on Google Play
Free version: 30-day free trial
Subscription price: $15 per month for basic version if purchased for 3 months or more
Created specifically for gig drivers: No
Source: quickbooks.intuit.com
3. Shoeboxed
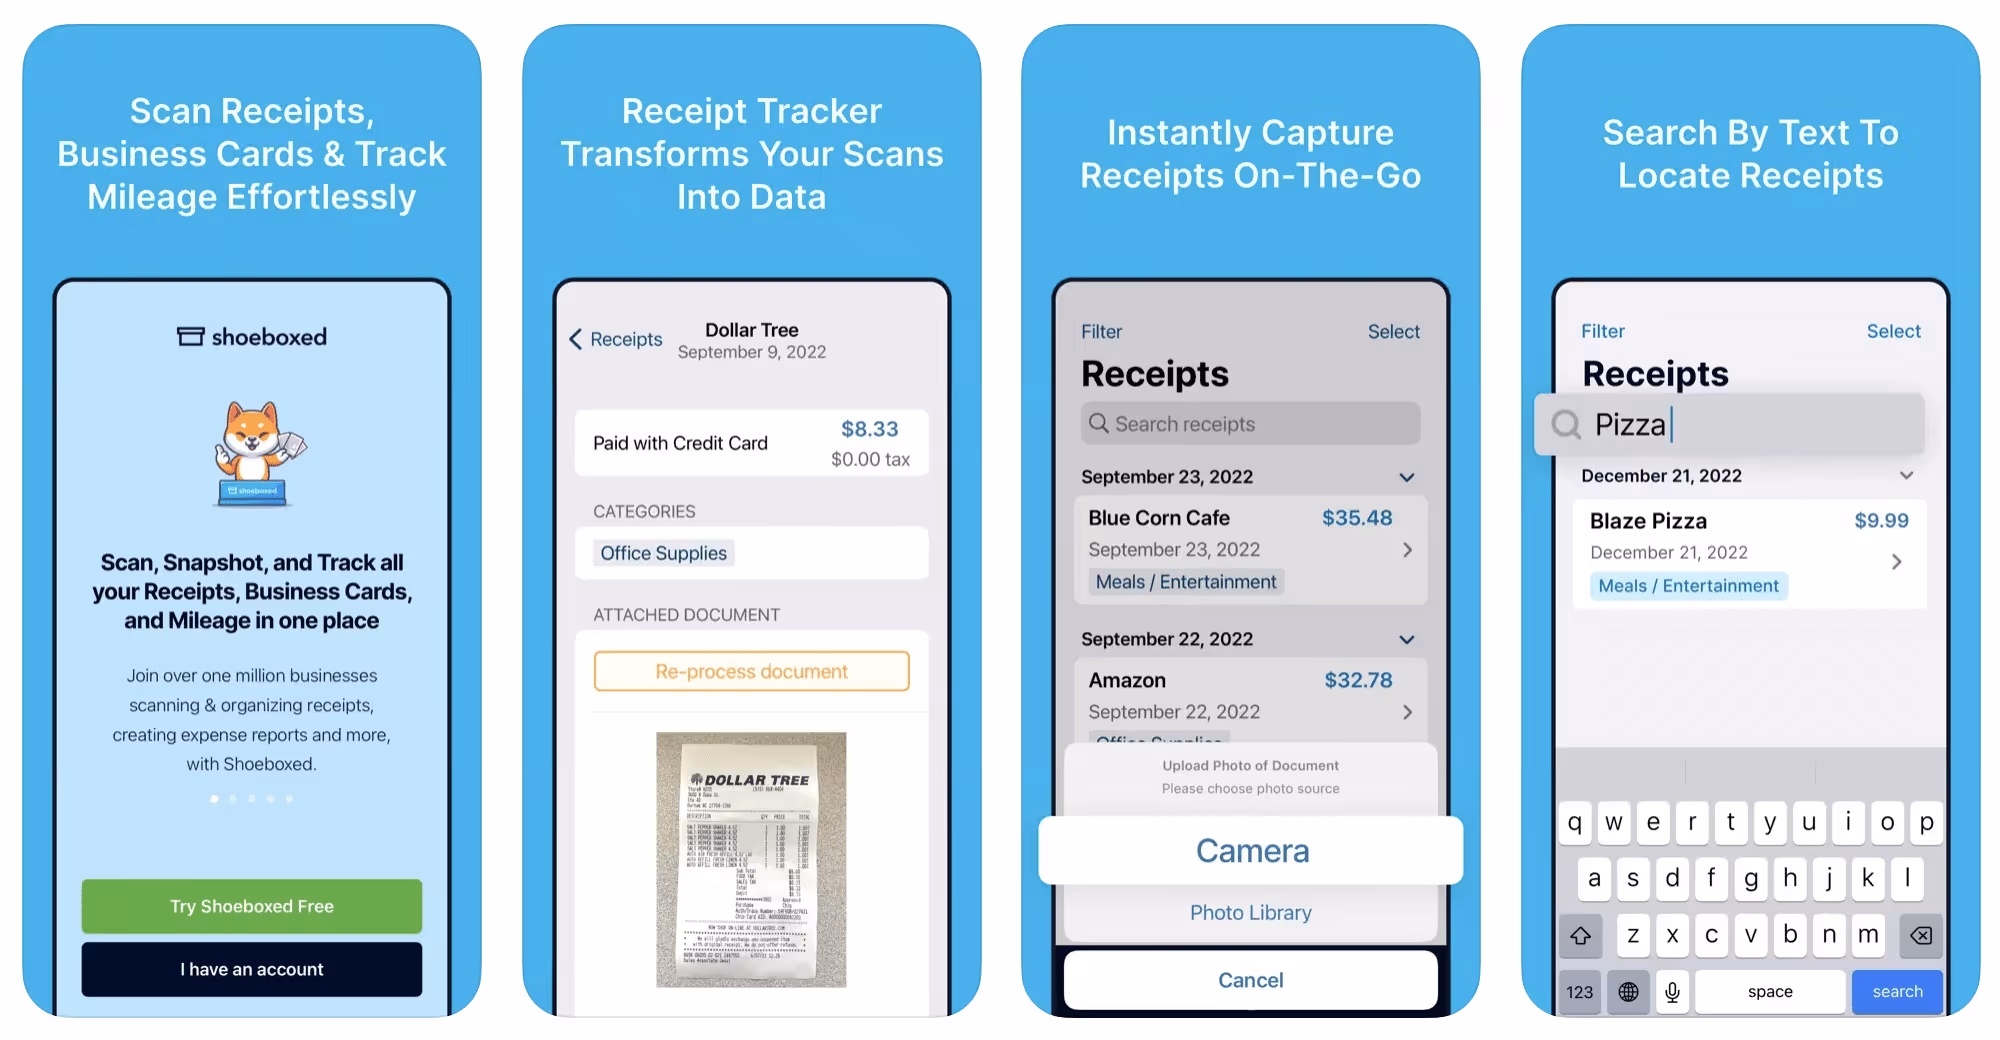
Shoeboxed started in 2007 as a service for scanning paper receipts into digital form. Now the app offers a free mileage tracker and has enabled users to scan receipts directly. It touts itself as the best mileage tracking app for DoorDash, but there are some elements missing that Dashers might like to have. While it provides features that record your expenses and prepare you for tax season, it doesn’t automatically track your earnings. The mileage tracker has a system where you can drop pins along your routes to make the tracking more precise, identifying those legs of a trip that you make for business purposes. The mileage tracker is “free” once you sign up for the basic version.
Available on Android and Apple: Yes
Ratings: 4.5 stars on App Store, 2.3 stars on Google Play
Free version: No
Subscription price: $18 per month for basic version
Created specifically for gig drivers: No
Source: blog.shoeboxed.com
4. Stride
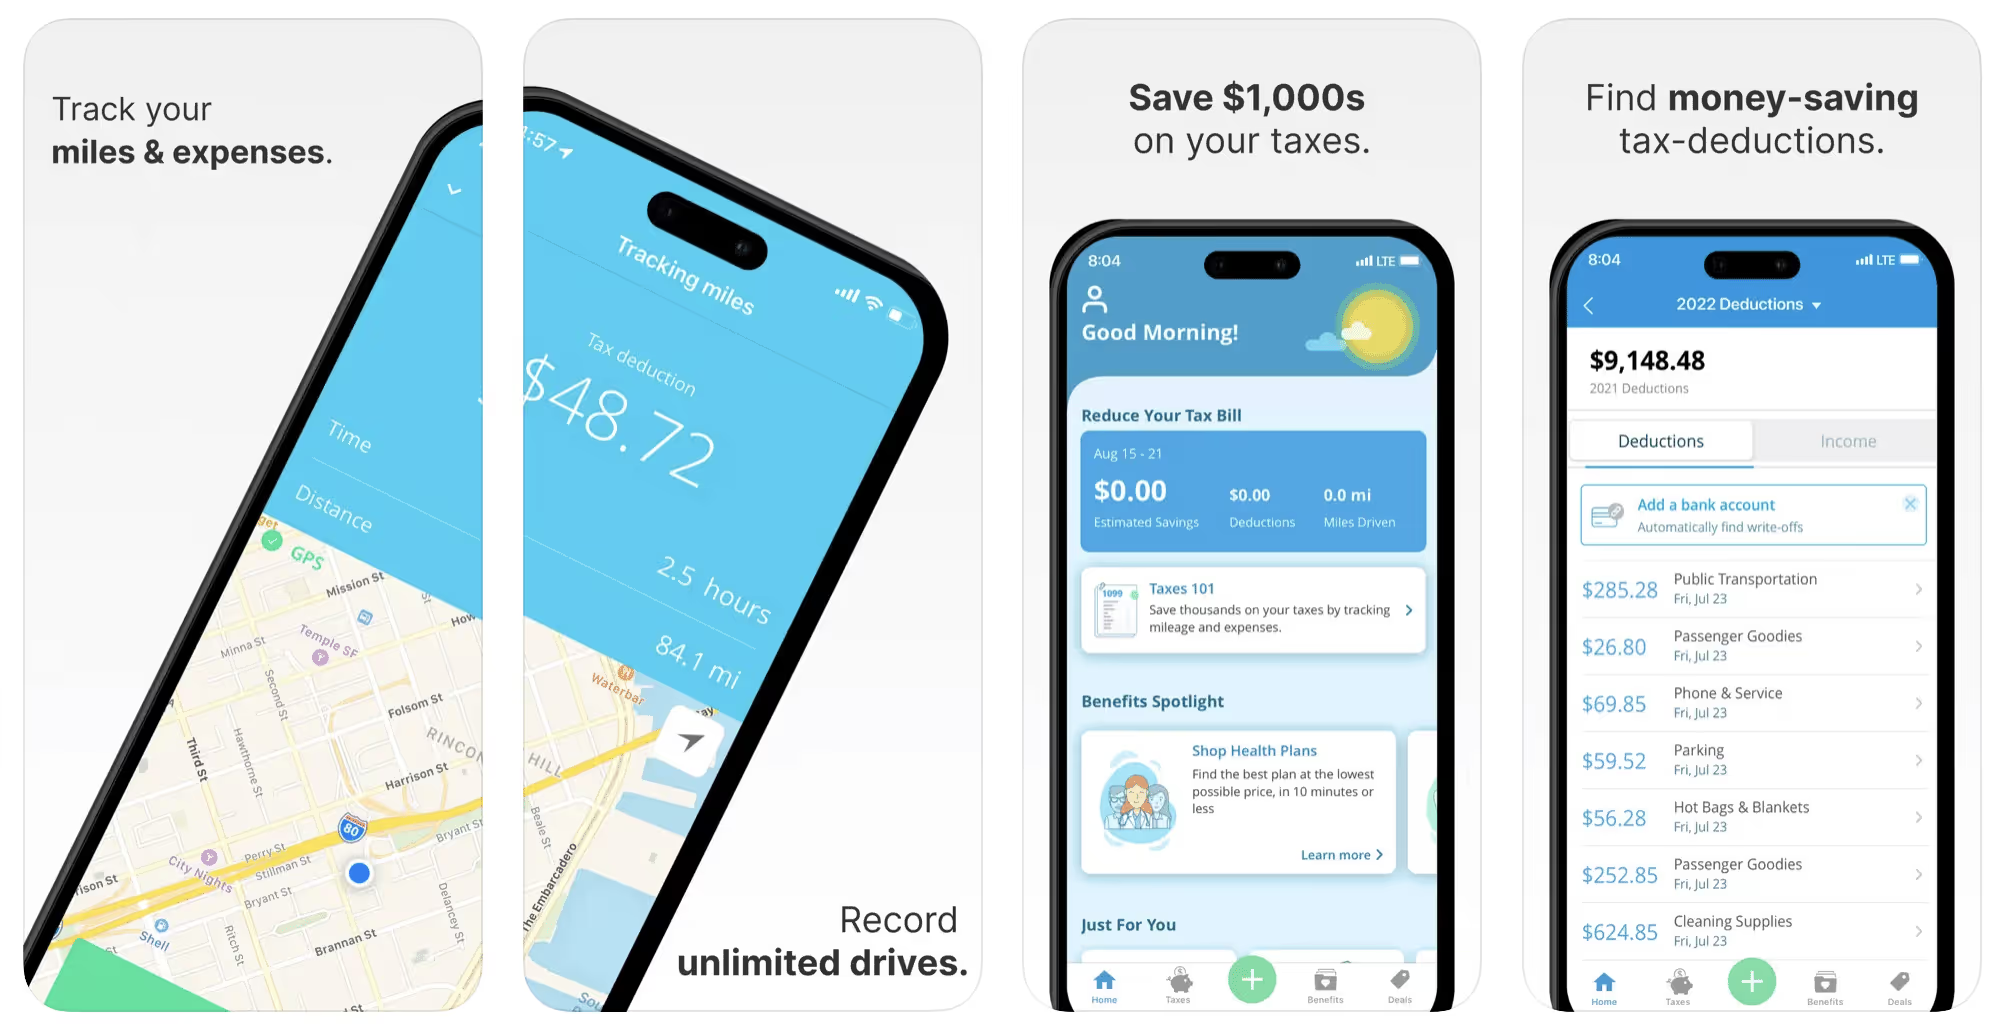
This free mileage tracker does a fair job of keeping track of the distances you rack up while gig driving, but it doesn’t automatically track earnings. It can be a big help, though, in tracking your expenses. You can link Stride to your bank account, and it will automatically scan your expenses to identify items you can potentially deduct. The app is totally free. This could make it the best free mileage tracker app, but there is a small price to pay. The app will persistently push you to consider various insurance plans that they are affiliated with. If you don’t mind that, this is a solid mileage tracker, even if it doesn’t track your earnings.
Available on Android and Apple: Yes
Ratings: 4.8 stars on App Store, 4.6 stars on Google Play
Free version: Yes
Subscription price: None. The app is free.
Created specifically for gig drivers: No
5. Gridwise
Gridwise has a free mileage tracker and free features that record your income and expenses. It gives you access to insurance and benefits, as well as insights about the best times and places to make the most money while gig driving. The Gridwise mileage tracker captures all the miles you drive while you’re on your driving shift, and it can be used if you have other trips you need to make which qualify as business travel.
Drivers love it because it is geared toward the needs of rideshare and delivery workers, providing free information about airport departures and arrivals, event start and let out times, weather, traffic, and more. The Gridwise Plus subscription adds value by providing additional insights and reports, discounts on benefits, the ability to export data in .csv format,, and more.
Available on Android and Apple: Yes
Ratings: 4.9 stars on App Store, 4.6 stars on Google Play
Free version: Yes
Subscription price: $9.95 per month for Gridwise Plus, or $95.99 per year (a $23.41 savings)
Created specifically for gig drivers: Yes!
What is the best mileage tracking app?
Now that we’ve checked them all out, we’re positive about the answer to that. Hands down, it’s Gridwise. Are we biased? You bet we are! But drivers love it too. Gridwise is the best mileage tracker app—and so much more. So many of the features are free, and the subscription to Gridwise Plus will pay for itself with additional insights to boost your earnings and deeper discounts on products and services.
Most important, Gridwise is designed specifically for gig drivers by experts who were once gig drivers themselves! Knowing what gig drivers need is a crucial step in creating an app that rideshare and delivery drivers can really use! Here are a few of the features, besides mileage tracking:
- seamless earnings tracking
- automatic, on/off toggle and manual mileage tracking
- mileage categorization
- airport, traffic, weather, and events information
- insights into where to drive and when to drive
- reports showing earnings across the platforms you use
- discounts on countless products and services for drivers
- additional resources for finding side gigs
- an informative and comprehensive blog
- affordable benefits, including insurance, medical, dental, and alternative practitioner discounts
- a community of drivers just like you
Don’t settle for just any app. Get the best mileage tracker, and so much more, from Gridwise!
[elementor-template id="21599"]

Uber vs Lyft Pay in 2026: Which Pays More for Premium Rides?
If you drive a vehicle that qualifies for Comfort or Black rides, you’ve probably wondered which platform, Uber or Lyft, will help you earn the most. These higher-end ride options come with premium fares and a more selective passenger base, which can significantly impact your overall earnings.
Recent Gridwise insights show a clear pattern: Uber drivers tend to earn more on Comfort and Black rides than Lyft drivers do. The gap is particularly high in the higher-tier ride categories, where Uber’s pricing structure and rider demand provide drivers with more consistent access to profitable trips.
For those with eligible vehicles, these findings suggest that Uber’s premium ride tiers may currently offer greater earning potential and steadier demand than Lyft’s.
[elementor-template id="20891"]
Why Compare Uber and Lyft Comfort/Black Payouts?
Comfort and Black rides pay more than standard trips, but they also attract a different type of passenger and require vehicles that meet specific standards. Many drivers buy or lease higher-end cars with these premium categories in mind, knowing they can open the door to better earnings opportunities.
If you’ve made that kind of investment, it makes sense to understand where your time brings the best return. Comparing Uber and Lyft payouts helps you decide which app deserves more of your focus, especially since both companies regularly adjust pricing, incentives, and market strategies.
When you understand how these payouts differ, you can make informed decisions about which trips fit your goals and how to get the most from the vehicle you’ve worked hard to qualify.
Vehicle Requirements: Are They the Same?
For Comfort and Black rides, Uber and Lyft set very similar standards for the vehicles that qualify. Both platforms prioritize newer cars with high-quality interiors and extra passenger comforts, such as additional legroom, smooth rides, and premium finishes.
Comfort rides usually include mid-sized sedans or SUVs that are only a few model years old and consistently receive high passenger ratings. These cars are meant to offer a quieter, more comfortable ride without being full luxury vehicles.
Black rides are in a different class. They require luxury models with black exteriors and interiors, as well as drivers who maintain a professional appearance and provide a higher level of service. These trips often appeal to business travelers and passengers who expect a top-tier experience.
If your car qualifies for Uber Comfort or Black, it almost always meets Lyft’s requirements for the same categories. In other words, the type of vehicle you drive probably won’t limit your earning potential on either platform. The real difference comes down to how each company structures its pay and how demand for premium rides varies in your market.
4. Uber vs Lyft: 2024 vs 2025 Earnings Comparison
The table below shows what we found after analyzing pay from both platforms. These averages represent total gross earnings per trip, including all rider payments, for Uber and Lyft Comfort and Black rides throughout 2024 and into 2025.
While both platforms saw fluctuations throughout the year, the overall trend is clear: Uber drivers consistently earned more per trip than Lyft drivers across the Comfort and Black tiers. The gap is especially noticeable in the higher-end ride types, where Uber’s pricing model and passenger demand helped boost payouts.
Lyft drivers still performed well in some areas, particularly during seasonal peaks, but Uber’s stronger, more consistent earnings suggest it has an edge in the premium market right now.
For drivers who already qualify for these higher-tier categories, this can be an essential factor when deciding where to focus their time.
Average gross pay per ride in Q3, 2024 vs 2025 (Uber vs Lyft).
Ride TypeQ3 2024 LyftQ3 2024 UberQ3 2025 LyftQ3 2025 UberStandard$12.09$12.75$11.95$13.01Comfort$20.00$21.61$20.48$21.30Black$31.75$39.47$28.96$39.08
Driver Observations and Feedback
Many drivers have shared consistent observations about Uber’s premium ride tiers. Their firsthand insights help explain how Comfort and Black influence ride volume, fare consistency, and overall earning potential.
Uber Comfort: Higher Fares, Lower Volume
Uber Comfort offers riders newer vehicles with extra legroom and quieter experiences. For drivers, the category introduces a modest pay premium but often less consistent demand. As The Rideshare Guy notes:
“Per trip, you’ll earn more doing Uber Comfort but there is not enough demand for you to do only Uber Comfort rides.” — The Rideshare Guy
Drivers echo this trade-off in various discussions. While Comfort trips typically pay about 20 percent more than UberX rides, that higher fare is offset by fewer requests — particularly outside major metro centers.
Similarly, Ridester underscores the need for a newer vehicle and a high driver rating to qualify, both of which raise the cost of entry:
“Comfort pays higher fares than standard Uber rides, but you’ll need a newer car, a 4.85 rating or higher, and excellent passenger reviews.” — Ridester
Key takeaway: Comfort can yield better per-trip earnings, but drivers often maintain UberX access to fill downtime and stabilize income.
Uber Black: Premium Pay, Premium Costs
At the top of Uber’s service tiers, Uber Black continues to attract experienced drivers seeking higher fares and professional clientele. Yet drivers consistently highlight the steep costs and fluctuating demand that accompany this category.
“I’ve been driving for Uber Black for about two years now. On a good week, I can make upwards of $1,500. However, I also spend more on maintenance and gas for my SUV.” — Michael, Los Angeles (Apps UK)
“The tips are definitely better with Uber Black. I’ve had passengers tip me as much as $50 for a single ride. But there are also slow days where I barely make anything.” — Sophia, Chicago (Apps UK)
Driver income reports show a broad range: $60,000 to $120,000 in gross annual revenue, depending on market size and vehicle type (TinyGrab). However, Ridesharing Driver emphasizes that operating expenses — from insurance and licensing to downtime between premium rides — can sharply reduce net profits (Ridesharing Driver).
Key takeaway: Uber Black can deliver strong earnings and generous tips, but the higher overhead means profitability hinges on efficient scheduling, location strategy, and cost control.
Strategic Insights for Drivers Considering Premium Categories
Across both Comfort and Black, consistent themes emerge from driver experiences and Gridwise performance data.
1. Understand your market dynamics. Premium ride categories perform best in areas with strong business travel, active airports, and event-driven demand. Recognizing these patterns allows drivers to plan hours more strategically.
2. Measure true profitability. Higher gross fares don’t always translate to higher take-home pay. Premium vehicles and commercial insurance raise expenses, widening the gap between gross and net income.
3. Maintain a flexible mix of ride types. Many drivers find that combining Comfort or Black rides with standard requests helps stabilize revenue during slower premium periods.
4. Prioritize service quality. Professionalism, vehicle presentation, and passenger comfort often lead to stronger tips and repeat riders.
5. Rely on local performance insights. Gridwise data pinpoints when and where premium categories generate the highest returns, enabling smarter driving schedules and market targeting.
Success in premium tiers depends not just on earning potential but also on strategic planning that understands when, where, and how to make those higher fares truly pay off.
How Gridwise Helps You Earn More on Comfort and Black Rides
Driving a high-end vehicle gives you access to premium rides—but knowing when and where to drive can make an even bigger difference in your bottom line. That’s where Gridwise comes in.
[elementor-template id="20949"]
Here’s how Gridwise helps you drive smarter:
- Know exactly when and where to work. Get personalized insights that pinpoint your city’s busiest hours and neighborhoods so you can plan shifts around real demand.
- See which app pays better right now. Compare your Uber and Lyft earnings side by side to understand which platform gives you more substantial returns in your specific market.
- Track your actual performance. Monitor your hourly and per-ride averages to spot trends, adjust your schedule, and make each shift more efficient.
- Understand your real profit. Log mileage and expenses automatically so you always know what you’re actually taking home after costs.
These data-driven insights take the guesswork out of driving, helping you plan smarter routes, reduce downtime, and increase your overall earnings efficiency.
Gridwise shows your Uber vs. Lyft averages side by side, so you can see whether your own results match national trends.
Pro tip: Drivers who regularly use Gridwise’s data insights tend to earn significantly more per hour than those who rely on trial and error.
The Point?
For drivers with vehicles that qualify for Comfort or Black rides, Uber currently provides the stronger earning potential. The gap between Uber and Lyft widened slightly from 2024 to 2025, showing that Uber’s premium ride categories continue to deliver better returns for most drivers.
Still, the platform you choose is only part of the equation. What really determines your results is how you work. Understanding when demand peaks, where high-value trips start, and how your city’s ride patterns change over time can make all the difference in your weekly totals.
[elementor-template id="20936"]
More resources for drivers

The Halloween Gig Driving Guide
The gig driving guide that all drivers need for halloween!
Halloween gig driving can be lots of fun, and it’s also a great time for gig drivers to make more money. With haunting going on for several days at a stretch, parties, parades, and other events will attract lots of business for rideshare and delivery drivers alike. You can probably go out as usual and still make a little more than you normally do, but why settle for that?
In this post, we’ll tell you how to make Halloween gig driving as rewarding as it is fun. We’ll talk safety, strategy, and how to earn bigger tips.
Rideshare earnings over Halloween
Last year, when Halloween landed on a Thursday (2024), rideshare drivers saw a strong jump in earnings.
Compared with typical October weeks, earnings were 3.5% higher the week before Halloween and 7% higher during Halloween week.
On Halloween night itself (Thursday, Oct 31, 2024), hourly pay surged +14% compared to a typical Thursday in October, as riders traveled to and from parties and events.
This year’s Friday Halloween means those same surges could extend through Friday night, Saturday, and even Sunday morning, potentially boosting weekend earnings by 10–15%.
Source: Gridwise
2024’s Halloween fell on a Thursday, creating a perfect setup for extended weekend activity — giving drivers more opportunity to earn from October 31 through November 3. The data shows that rideshare drivers benefited significantly from party and event-related travel, with a strong +7% week-over-week gain.
Rideshare earnings over Halloween
Delivery drivers also saw solid seasonal growth last year — +3.5% the week before Halloween and +6.8% overall during Halloween week.
On Halloween night (Thursday, Oct 31, 2024), delivery earnings per hour jumped +12% compared to a typical Thursday, as customers ordered food and supplies for parties and gatherings.
With the holiday on a Friday this year, deliveries may peak later into the evening and continue through the weekend.
Getting in on the fun–and money–with Lyft or Uber on Halloween
From parents who want to keep their small ones dry and safe on the way to school events to hardcore party people who dive into the Halloween holiday spirit headfirst, you’ll come across many passengers during this super busy week.
Since so many will be super excited about this spooky season, the way you approach your halloween gig driving could make your customers extra generous and appreciative. Here are a few pieces of sound Lyft and Uber driver advice:
- Remain professional. Always greet your passengers as you would at any other time, and stay away from getting overly dramatic about acting like a scary zombie, axe murderer, or vampire, especially with young kids in the car.
- Offer treats. Even jaded business travelers on the way to the airport might enjoy a sweet Halloween treat. Put a smile on passengers’ faces by ensuring your offerings are in their original wrappings so they can feel safe eating them. You might want to offer bottled water, too. Super-high doses of sugar can make all goblins, big and small, mighty thirsty.
- Present your Halloween playlist. You’ll want to do this carefully, of course, but a subtly crafted sequence of songs appropriate to the season will make you stand out with your passengers, who’ll just have to tip you for your great musical taste.
- Decorate your car. A temporary Halloween wrap for the exterior or some subtle orange and white lights on the interior could make yours the car they all want to be in when they celebrate their Lyft or Uber Halloween holiday.
- Brush up on customer service skills and keep them in mind no matter what Halloween horrors you might encounter. This post from Gridwise will help.
- Check in with your company for further tips, tricks, and features you can use to make Halloween safe and profitable. Uber offers Halloween tips for drivers here, and you’ll find advice from Lyft for Halloween driving in this article on their website.
Costume and car safety tips on Halloween
Halloween costumes can be a fun way to get into the holiday spirit, but as a gig driver, safety must come first—both for you and your passengers.
- Dress up with discernment. If you decide to dress up, keep it to common-sense costume choices. Make sure your face is recognizable, and avoid makeup, clothing, or props that make seeing clearly or moving freely while driving difficult. If you don’t want to get too wildly creative, you can always assemble a Halloween costume for a Lyft or Uber driver! Slap a sign on your chest that says “Scary good driver,” and you’ll be good to go. (More tips below!)
- Costume Considerations for Safety: Avoid masks or large headpieces that block your view, and make sure your costume doesn’t interfere with the operation of your vehicle. Simple, easy-to-wear costumes like themed hats or shirts are great options. And don’t forget—your costume should still allow you to present yourself professionally to customers.
- Car Safety and Decorations: Decorating your car can add to the fun, but it’s important not to overdo it. If you’re putting up Halloween lights or adding decor inside your vehicle, ensure that none of it obstructs your mirrors, windows, or the operation of the vehicle. Opt for subtle touches like small orange lights or temporary window decals that you can remove easily after Halloween.
Delivery tricks to earn you treats
Is DoorDash busy on Halloween? You bet! People have to eat something besides candy at all those parties and parade pregaming sessions, right? This Reddit thread speaks to opportunities waiting for Halloween delivery drivers.
There’s every reason to expect delivery drivers to have their own kind of Halloween fun, and to profit from it, too. Here are some moves DoorDash, Uber Eats, Instacart, Shipt, and Grubhub drivers can make to share in this fun-filled holiday’s eerie, magical spirit.
- Carry treats for restaurant workers. You might see these people more than once a week, or you might have only one encounter with them ever. In either case, offering them a little something will keep them cheerier and get you better ratings from the restaurant.
- Follow the call of the Halloween spirit. If restaurant workers or customers seem to be celebrating, it’s fine to chime in with a spooky comment or quirky quip. But if it looks like the people you’re dealing with have no idea there’s anything special about this time of year, act like you always do, with friendliness, grace, and professionalism. Read more about how to be a 5-star delivery driver in this Gridwise blog post.
- Tread lightly through backyard Halloween displays. So many people get extremely serious about decorating their yards with blow-up ghosts, gravestones, skeletons, and witches. What’s fun the rest of the day can be downright treacherous for delivery drivers. A headlamp or other means of shining light on what’s underfoot might be called for, so you don’t hurt yourself or destroy a well-thought-out ghoulish (and garish) display. Keep your DoorDash Halloween safe and fun.
Halloween-Specific Customer Service Tips
Halloween gives drivers a unique opportunity to stand out and create a memorable experience for passengers and customers. Excellent customer service is key to higher ratings and bigger tips.
- Boosting Your Ratings: Go the extra mile this Halloween by getting into the spirit with friendly, light conversation about the holiday or complimenting customers on their costumes. Passengers appreciate a driver who engages with them, especially during festive times like Halloween. However, be mindful of your passenger’s mood—if they’re not in the Halloween spirit, it’s best to keep the conversation professional.
- Seasonal Treats for Tips: Offering candy or small, sealed treats to your passengers can earn you great reviews and bigger tips. Just be sure to offer items that are pre-packaged and safe to consume. A thoughtful, themed gesture like this can leave a lasting impression and increase your chances of positive feedback.
By focusing on seasonal customer service, you can turn Halloween into an opportunity for higher earnings through great ratings and tips.
Top Halloween Events in Major Cities for Gig Drivers
Halloween is all about knowing where the action is happening, and as a gig driver, you can position yourself to take full advantage of these high-traffic zones.
- Know the Hotspots: Major cities like New York, Los Angeles, and Chicago host some of the biggest Halloween events. Parades, block parties, and haunted houses all draw large crowds and create high demand for rides. Use Gridwise’s event calendar to track these events and plan your route accordingly. By focusing on areas with heavy foot traffic and event venues, you’ll maximize your earnings from both rideshare and delivery gigs.
- Balancing the Right Zones: Don’t put all your eggs in one basket by sticking solely to high-demand areas. Popular areas will attract a lot of drivers, which could lead to oversaturation. Use Gridwise to analyze traffic patterns and mix it up by also covering nearby neighborhoods where competition is lighter but demand is still solid.
By knowing where the top Halloween events are happening, you can make sure you’re always in the right place at the right time to get the best fares.
Know where to drive and when
Keeping track of events when you’re doing Halloween driving can be tricky. That’s why you’re so lucky to have Gridwise. It’s not just the best mileage tracking app out there. Use the Gridwise events calendar to see where the parades, shows, scare houses, and public parties are happening. Having this info at your fingertips will make it easy to put together a winning Lyft or Uber driving strategy—but Gridwise has even more to offer.
Gridwise features Where to Drive and When to Drive give you real-time data on where drivers are making the most in your neighborhood. Studying the patterns in these features will tip you off as to when the peak passenger and delivery traffic is humming and where to find the most business. With Gridwise, you get all this and a free mileage tracker, too!
Stay safe and keep clean
The truth about Halloween is that it can be fun, but there are hidden dangers and inconveniences you’ll want to beware of. Consider these tips for keeping yourself and your passengers safe, and for preventing damage to your vehicle:
- Identify your passengers and delivery customers. Dress some people in a costume, and they can get downright silly and, sometimes, even dangerous. Don’t be shy about asking a passenger who appears somewhat sketchy to remove their mask, so you can make sure you’re picking up the right person. Same goes for delivery. The word “trick” is very popular this time of year, and there could be a masked imposter hoping to pilfer that awesome spread of wings, burgers, and fries you’re carrying.
- Use in-app phone safety features. In case someone is acting out a Halloween stalker movie, you don’t want to become their prey. Your app most likely includes features that let a friend or family member follow your trips and know your whereabouts, and will let you contact emergency services with one swipe or tap. Get familiar with these features, and use them. It’s better to be overcautious than to find yourself in some real trouble.
- Demand full visibility. The chowderhead in your back seat dressed in a giant lobster costume might be cute and creative, but if the oversized claws are blocking your view, you’ll need to ask that they come off till the ride is over.
- Stay alert. Halloween is a very exciting time, particularly for children. Drive slowly and carefully, looking in as many directions as possible for people who might walk right in front of or behind your car. Make sure your lights are on at all times, even in the daytime, which really does help people notice there’s a car in their vicinity.
- Try a tarp. This sounds somewhat extreme, but if you’re creative, you can turn a protective seat cover into an enticing Halloween decoration for your car. You’ll want this for more than just the messes mentioned above. Glitter, face paint, green slime, and other costume components might look fabulous on your customers, but it’s not such a great look when they get ground into your upholstery. (More tips on keeping your car clean below!)
- Choose parking spots carefully. This one is mainly for you 5-star delivery drivers, but even rideshare drivers stopping for a quick bevvy or a bio break have to park somewhere. Remember that people still use Halloween as an excuse to soap windows and smash pumpkins. Avoid parking where they might be able to make this mischief with your car.
- Read more about safety for drivers in this Gridwise article, and additional safety tips for female drivers in this Gridwise blog post.
- Keep your cool. Even if you see a clan of kids TP-ing your pine trees when you come in from a long night, try to remember Halloween is all about the fun of being just a little bit naughty. That thing about everybody being “nice” all the time is for a totally different holiday.
How to Prep Your Car for Halloween Cleanups
With the excitement of Halloween, there’s always a chance for messes—whether it’s glitter from a costume or candy wrappers left behind by passengers.
- Halloween-Specific Car Prep: Equip your vehicle with essential cleaning supplies to handle any spills or messes quickly. Paper towels, disinfectant spray, air freshener, and trash bags are a must. These items will allow you to clean up any small accidents on the go without losing valuable driving time.
- Protecting Your Upholstery: To prevent costume glitter, face paint, or other Halloween accessories from damaging your seats, consider using temporary seat covers or a tarp (mentioned above). You can even turn this practical solution into a fun Halloween decoration by choosing themed covers that fit the spooky spirit.
- Carry daycare equipment for drunks. For many of the party-prone among us, Halloween is a huge opportunity to tie on more than a costume. Carry sick bags, a roll or two of paper towels, cleaning solution, and plastic garbage bags to take care of any spills or “upheavals” that might occur. Sparkling bottled water could be convenient to have on hand at times like this, too. And remember, if they make a mess, your passengers have to pay to clean it up. Claim with your company to cover detailing costs. Read this post about how to deal with drivers who are, er, “under the influence” for further helpful hints.
By prepping your car ahead of time, you can ensure that it stays clean and presentable throughout the busy Halloween season.
Managing Drunk Passengers During Halloween
As Halloween brings out the partygoers, it’s inevitable that rideshare drivers will encounter intoxicated passengers. Handling these situations properly is key to staying safe and ensuring a smooth ride.
- How to Handle Intoxicated Passengers: If you notice your passenger is drunk, stay calm and professional. Avoid engaging in arguments or encouraging excessive conversation. If the passenger is disruptive or potentially unsafe, don’t hesitate to end the ride early or pull over to a safe location. Politely ask them to leave the vehicle if necessary, and report any concerning behavior to the rideshare platform.
- Safety Features and Claims: Most rideshare apps come equipped with safety features, such as the ability to share your trip with family or friends. Be sure to activate these when you feel uneasy. Also, keep in mind that if an intoxicated passenger makes a mess in your vehicle, you can submit a cleaning fee claim through Uber or Lyft. Keep your vehicle equipped with cleaning supplies like paper towels, disinfectant, and air freshener to handle any accidents.
Managing drunk passengers safely will help you avoid potential problems and ensure a smooth Halloween shift.
Enjoy your Halloween driving, and may you avoid tricks and get many treats, especially tips! Be sure to bring Gridwise along for the ride to track your awesome earnings during this spooky holiday time!
[elementor-template id="21599"]

New in Gridwise: Smarter Tools for Hourly and Flexible Work
The way people work is changing—and fast. In today’s economy, many workers are finding that one job just isn’t enough. Inflation, rising living costs, and unpredictable hours are pushing more people to take on multiple roles just to stay afloat. That often means combining rideshare shifts, food deliveries, warehouse gigs, retail jobs, and more—sometimes all in the same week.
This growing trend is part of what’s known as flexible work. These are jobs or shifts that people can pick up as needed, often on their own schedule and across multiple platforms. Some workers drive for Uber or Lyft. Others deliver for DoorDash, pick up hourly shifts through Instawork, or run errands via TaskRabbit. Many do several of these at once.
What all flexible workers have in common is the ability to earn across different sources—without a consistent way to track it all in one place.
At Gridwise, we’re seeing this shift firsthand. And we’re evolving alongside it to support the realities of today’s flexible and hourly workforce.
[elementor-template id="20891"]
Gridwise’s Evolution
Where We Started
Gridwise was created to help rideshare drivers earn smarter. Early on, we focused on providing drivers with tools to track their earnings, understand their performance, and decide when and where to drive for maximum efficiency. By organizing scattered data into valuable insights, we made gig driving more predictable and more profitable.
When the Landscape Shifted
During the pandemic, the gig economy changed rapidly. Demand for rideshare services dipped, while delivery apps surged. In response, we expanded to support platforms like DoorDash, Instacart, Grubhub, and Uber Eats—giving delivery drivers access to the same tools and insights that rideshare drivers were already using.
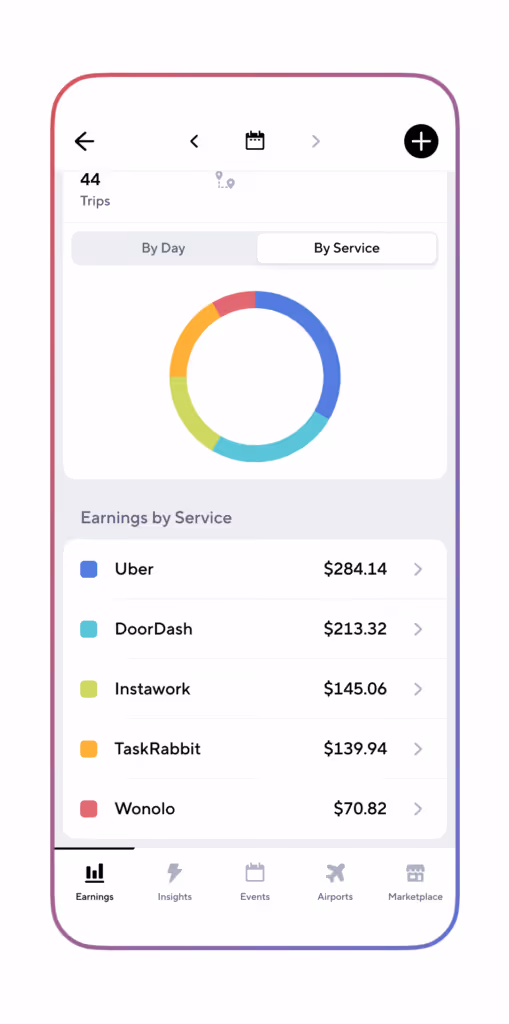
As the economy continued to evolve, so did the way people work. Many workers began mixing gig app work with hourly or shift-based jobs—sometimes across two, three, or even more platforms in a single week. To meet that growing need, we added support for services like Instawork, TaskRabbit, and Wonolo.
Where We Are Now: A Major Milestone for Gridwise
Today, we’re excited to share one of our biggest updates yet:
Gridwise now supports manual earnings tracking for more than 900 platforms!
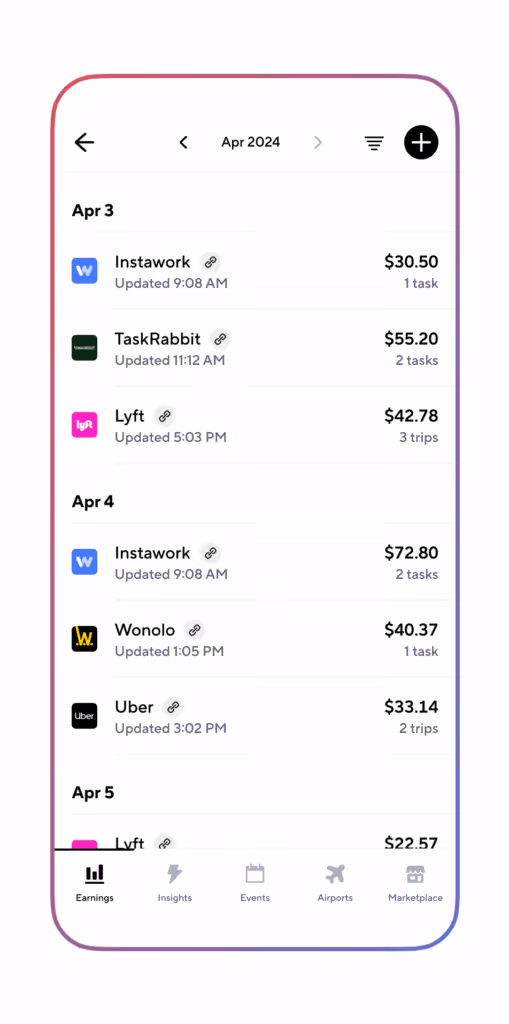
This includes not just rideshare and delivery services, but a wide range of industries where flexible and shift-based work is the norm, such as retail, hospitality, healthcare, warehouse operations, and more. Whether you’re picking up catering shifts, restocking store shelves, or driving for three different apps in one day, Gridwise can track it all in one place.
This is more than an update—it’s a transformation. Gridwise is evolving from a gig-driving tool into a comprehensive earnings hub for anyone working across multiple jobs, shifts, and platforms. Wherever you work, and however you piece together your income, Gridwise is here to give you visibility, clarity, and control.
And we’re just getting started.
What’s New in Gridwise
This latest expansion brings Gridwise closer to what today’s workers need: a flexible, inclusive tool that adapts to the many ways people earn.
Here’s what’s new:
- Expanded coverage across industries like retail, hospitality, healthcare, warehousing, and more
- Manual earnings tracking for over 900+ gig and hourly platforms
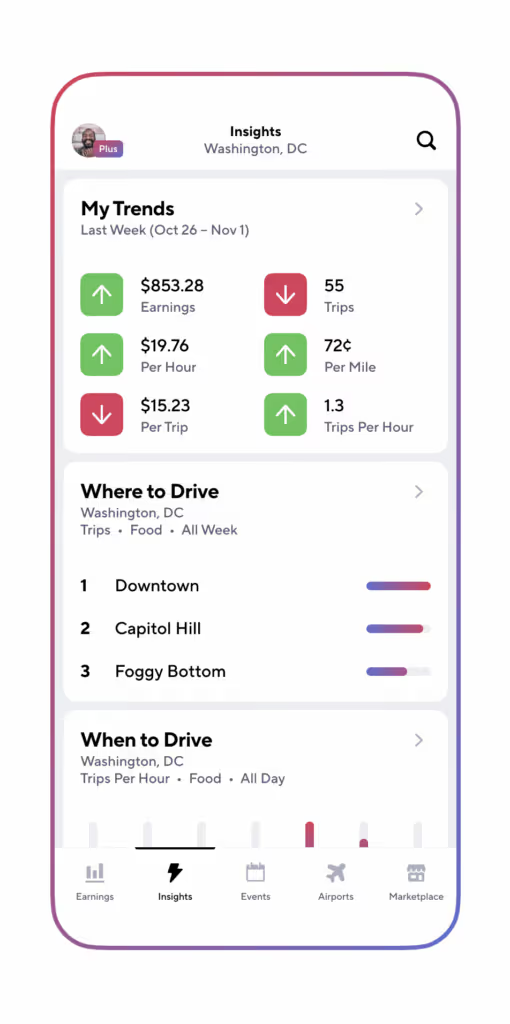
- Smarter insights that surface trends in your income, time, and location-based earnings
We’ve expanded our coverage to include a diverse range of industries where flexible and shift work are the norm. These jobs might not live in the gig app world, but they still follow the same unpredictable patterns, and workers still face the same challenges around planning, tracking, and comparing income.
With this update, you can now manually log earnings from more than 900+ platforms and services. Even if your employer or gig app isn’t yet directly integrated, you can still keep a full record of your shifts, hours, and pay. As you enter data, Gridwise highlights patterns—like which days tend to pay more, which locations yield better results, and when it makes sense to take on certain types of work.
These insights help you make more informed decisions about where to spend your time, which opportunities to prioritize, and how to optimize your schedule for steady, sustainable earnings.
Looking Ahead
This expansion is just the beginning. Gridwise is building toward a broader vision: to become the go-to platform for anyone working flexibly — whether you're clocking into shifts, picking up gigs, or combining both to make ends meet.
We know the challenges workers face aren’t limited to a single industry or app. That’s why our roadmap includes continued rollouts across new sectors, deeper earnings insights, and better tools to help you manage your time and income with more confidence.
As we grow, your feedback will be at the center of every improvement. We want to hear about how you're using the new features, what’s working, and where we can improve.
Got something to share? We want to hear from you. Get in touch here.
Your Work, Your Insights, Your Power
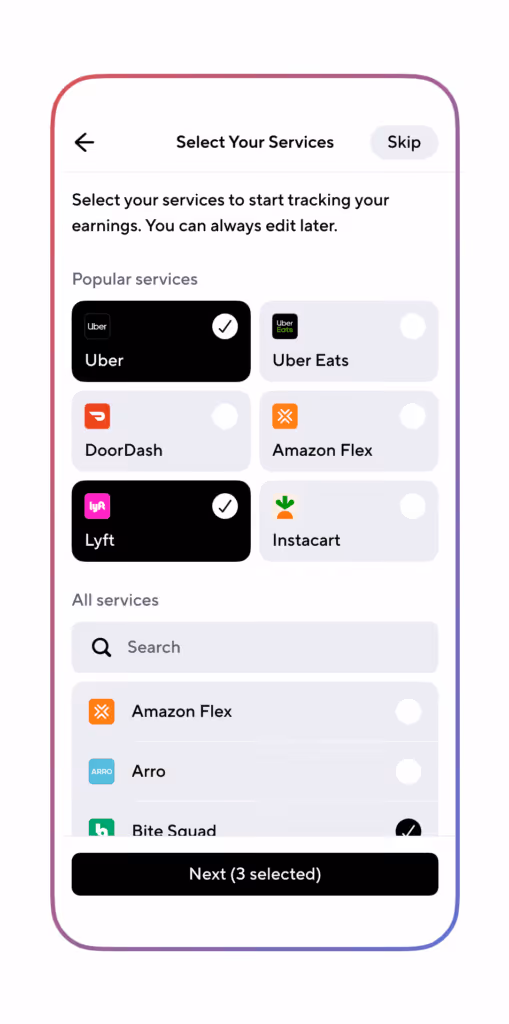
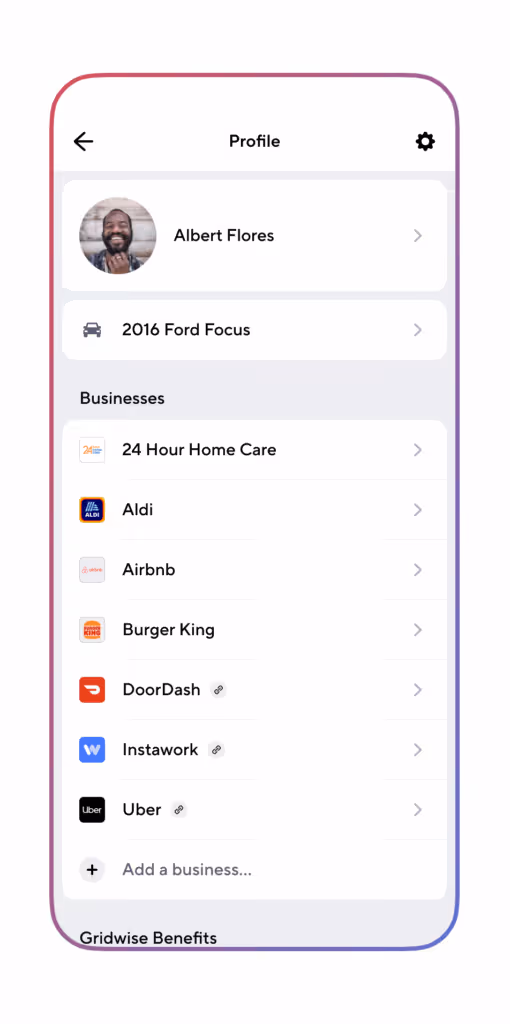
If you earn across apps or shifts, now’s the time to bring everything together in Gridwise. Start by adding all the services you use — even the ones that aren’t yet connected automatically. When you add them manually, you’re not just getting a clearer picture of your own earnings — you’re also helping Gridwise decide which services to prioritize for comprehensive automatic income tracking in the future.
Log your recent shifts, input your earnings, and take a look at the patterns that emerge. The more complete your record, the more valuable your insights become — both for your own strategy and for the improvements we continue to build.
Your experience helps shape what Gridwise becomes. By using the expanded tracking and sharing your feedback, you’re contributing to a future where flexible and hourly work are easier to manage, smarter to plan, and ultimately fairer for everyone.
Start by adding the services you use to Gridwise. If you don’t see your service listed, please get in touch with our team here.

Same Apps Different Pay: Why NYC Pay Is 2x More Than Miami
Driving for delivery apps might look the same everywhere—but earnings tell a different story.
The same hours, effort, and apps can produce very different results depending on where you work.
Why? City-specific factors like pay regulations, customer tipping habits, local demand, and even traffic patterns can make or break your bottom line.
In this post, we’ll explore how your market shapes your earnings, why some cities consistently outperform others, and what you can do to boost your take-home pay, no matter where you drive. We’ll break down real-world examples from New York City, Miami, and Philadelphia, then show you how to adapt your strategy using insights from Gridwise.
[elementor-template id="20891"]
City-to-City Pay Gaps: What the Data Shows
This chart shows how average driver gross pay per hour varied across major metro areas (NYC, Philadelphia, and Miami) on apps like DoorDash, Gopuff, Grubhub, Instacart, and Uber Eats between July–December 2024.

It highlights a key point: even with the same apps and effort, pay can vary widely by city.
In this sample:
- NYC leads across most platforms
- Philadelphia lands mid-range
- Miami trails behind
But keep in mind:
City averages don’t reflect your personal costs, idle time, or shift strategy. They also shift with the seasons or big events. That’s why they should be used as context, not benchmarks.
To really understand how you’re doing, use Gridwise to track your actual earnings by hour, app, and shift—then compare your results to local averages.
Same Job, Different Payday — The Policy Effect
Where you drive can affect your pay before you even turn the ignition—and local policy is a big reason why.
In New York City, app-based delivery workers benefit from a guaranteed minimum pay floor. As of April 1, 2025, the NYC Department of Consumer and Worker Protection mandates a $21.44/hour rate before tips, adjusted annually for inflation.
This floor boosts earnings across the board—and it’s one reason NYC consistently tops gig worker pay charts.
In contrast, Miami and Philadelphia have no minimum pay protections.
Drivers in these cities rely entirely on market forces—like order volume, tips, and competition. That means you could put in the same work and walk away with significantly less.
This policy gap helps explain why NYC pay starts high and stays stable, while pay in other cities fluctuates more,even before considering demand, traffic, or driver strategy.
Why Can Cities Differ?
Demand and Events
Local demand plays a major role in driver earnings. Cities with large travel hubs or busy event calendars create more consistent opportunities.
- Miami’s Port hit a record in FY2024, serving 8.23 million cruise passengers. Turnaround days fuel weekend delivery and rideshare spikes.
- Philadelphia International Airport (PHL) moved 30.9 million passengers in 2024, driving steady airport-area demand even during slower weeks.
- Sporting events, concerts, and conventions all create temporary demand surges that drive pay above normal.
Markets without these kinds of built-in demand engines?
They often lead to slower days, longer idle periods, and lower pay per hour.
Tip and Dining Patterns
Even if demand is stable, your earnings can still swing based on how and when people order—and how much they tip.
- Miami saw a drop in dinner orders and average tips in Q2 2024 (according to Toast POS data). Fewer high-value dinner runs cut into what’s usually a peak shift.
- Philadelphia, by contrast, had stronger morning restaurant traffic, driving up breakfast earnings and tips.
These patterns matter. Tip-heavy deliveries can double the value of a run. Miss the high-tipping windows, and you might leave serious money on the table.
Cities with a strong tipping culture—or busier meal hours—tend to deliver higher hourly earnings for the same effort.
Operating Costs
Gross pay isn’t the full picture. Your true earnings depend on what it costs to work in your market.
- Fuel prices: Pennsylvania has some of the highest fuel taxes in the U.S., raising gas costs. Prices in Florida and New York vary week to week (AAA).
- Tolls and parking: NYC’s tolls, tunnels, and scarce street parking can eat into profits fast—even a few paid spots can wipe out short-trip margins.
- Vehicle wear: Stop-and-go driving adds maintenance costs. The IRS mileage rate for 2025 is $0.70/mile, a good baseline for estimating vehicle expenses.
Two drivers might gross the same $20/hour. But if one is paying more in gas, parking, and repairs, their net earnings could be far lower.
What Now? Win Where You Are
You can’t control your city’s policies or traffic—but you can control how you work within them.
In every market, top-earning drivers don’t just hustle more.
They track performance, optimize shift timing, and cut costs wherever they can. It's not about grinding longer—it's about working smarter.
Here are five ways to do exactly that:
Driver Pay Isn’t One-Size-Fits-All
Driving for apps may seem standardized—but your results won’t be.
Every market brings different earnings potential. Some of it is out of your hands. But a lot of it isn’t.
With the right tools and data, you can outperform local averages and maximize your earnings—even in tougher markets.
Guessing Doesn’t Work. Tracking Does.
Most drivers don’t realize how much they lose to slow hours, downtime, or underperforming apps. Relying on city averages won’t reveal the full story.
Gridwise shows you exactly what’s working—no spreadsheets or guesswork. Once you link your apps, you’ll see:
- Total earnings, miles driven, and time online
- Hourly pay breakdowns by app, day, and time
- Performance trends, like: “Fridays 11am–2pm run 18% above my average”
- Event and airport demand signals to catch high-value shifts in real time
Start with your actual numbers. Then make small shifts to when, where, and how you drive. That’s how smart drivers boost their pay—no matter the city.
[elementor-template id="20936"]

Your App Choice Could Mean 30% More Pay
If you’ve been driving in the gig economy for a while, you already know one truth: no two cities are alike. The traffic patterns, the customers, the tipping culture, and even the kinds of restaurants available can all shape your earnings. But here’s the twist most drivers overlook — the app you use matters just as much as the city you’re in.
New Gridwise insights shows that the “best” platform is different depending on where you drive. In one city, Grubhub might top the charts. In another, Uber Eats or Gopuff could be the most reliable money-maker. And across multiple markets, DoorDash — despite being the biggest player — often trails the competition.
That means your earnings aren’t just about how hard you work. They’re about strategy. The right app in the right city could boost your hourly rate by several dollars, while the wrong one might hold you back.
[elementor-template id="20891"]
App Earnings Vary More Than You Think
Between July and December 2024, Gridwise analyzed average gross hourly earnings across five major platforms: DoorDash, Uber Eats, Grubhub, Gopuff, and Instacart. The numbers included everything — base pay, tips, bonuses, and even the downtime between requests.
What the data revealed was clear: platform earnings shift dramatically depending on location. In Miami, Gopuff delivered the highest hourly earnings, while in Philadelphia and New York City, Grubhub consistently outperformed the competition. Across all three cities, DoorDash paid the least per hour.
This isn’t just a slight difference. In some cases, the gap between the highest-earning platform and the lowest was $5–$6 an hour. For full-time drivers, that can add up to hundreds of dollars a month — simply by choosing the right app for the city you’re in.
A Look at Three Cities
Miami: Gopuff Wins Out
In Miami, Gopuff drivers came out on top, averaging nearly $15 an hour. Grubhub followed at about $14, while Uber Eats and Instacart hovered closer to $12. DoorDash trailed significantly at under $10 an hour.
The numbers reflect the challenges of this market. Miami drivers often face longer distances between customers, heavy traffic, and more competition for orders. That combination drags down efficiency, making platform choice even more critical. For drivers relying only on DoorDash here, the gap is striking — you could be earning 30% less than your peers who focus on Gopuff.
Philadelphia: Grubhub Takes the Lead
In Philadelphia, Grubhub drivers earned the most, averaging about $16.50 an hour. Uber Eats followed closely at $15.40, while Gopuff came in at $14. DoorDash and Instacart both hovered near $12 an hour.
The city sits in the middle compared to Miami and New York — denser neighborhoods than Miami but less intensity than New York. That balance creates steady demand without overwhelming traffic. For drivers, the key takeaway is that Grubhub and Uber Eats clearly outperform the rest here, and multi-apping between them could help minimize downtime and maximize pay.
New York City: Grubhub Dominates
In New York, Grubhub pulled far ahead of the competition, with drivers averaging $18.60 an hour. Uber Eats followed at $16.70, while DoorDash, Instacart, and Gopuff all earned just above $13 an hour.
What makes New York different is density. Short delivery distances, constant demand, and a strong tipping culture all add up to higher earnings. With so many orders packed into tight areas, drivers can complete more trips per hour, which multiplies the impact of higher per-order tips. That’s why Grubhub’s edge in New York isn’t just a few dollars — it’s a consistent advantage that can translate into hundreds of extra dollars each month for full-time drivers.
Average Hourly Earnings by City and Platform
Here’s a side-by-side comparison of how the major gig apps stacked up in Miami, Philadelphia, and New York City. These numbers include base pay, tips, and bonuses, giving a clear picture of which platforms performed best in each market.
Average Hourly Earnings by City and Platform (Jul–Dec 2024)
CityGrubhub hourly payUber Eats hourly payGopuff hourly payInstacart hourly payDoorDash hourly payMiami, FL$14.00$12.10$14.90$12.20$9.40Philadelphia, PA$16.50$15.40$14.00$12.00$12.30New York City, NY$18.60$16.70$13.40$13.20$13.20
Takeaway: The best-paying gig app isn’t the same everywhere. In Miami, Gopuff led the way, while Grubhub dominated in Philadelphia and New York City. Across all three markets, DoorDash consistently ranked lowest, showing why it’s important to compare platforms based on where you drive.
Why Platforms Perform Differently Across Markets
Several factors explain why one app pays more in one city and less in another:
- Customer demand. Each platform has different levels of popularity in different regions. If more customers in your city use Uber Eats, for example, you’ll likely see more frequent requests there than on other apps.
- Restaurant and retailer partnerships. Apps don’t all work with the same merchants. Grubhub’s strong ties with long-established restaurants in cities like New York and Philadelphia give it a steady base of high-value orders, while Gopuff’s warehouse model drives success in markets like Miami.
- Driver supply. The number of active drivers also shapes earnings. If an app is flooded with drivers in one market, wait times go up and pay per trip often falls.
- Local culture and tipping habits. Cities with higher tipping norms can boost average hourly pay on certain apps. Likewise, areas with longer delivery distances or more traffic can drag down earnings.
- Promotions and bonuses. Each platform sets promotions at the city level. Peak pay, bonuses, and challenges may look generous in one market but be nearly absent in another.
- Local pay regulations. Laws matter too. Cities like New York have set minimum pay standards for delivery workers, forcing platforms to adjust pay structures. These rules can drive up average earnings compared to cities without such protections.
The bottom line is that no single platform dominates everywhere. The app that delivers the best results in your market is determined by a mix of demand, competition, local habits, and even local laws.
How You Can Find Your Best App Match
Charts like the ones we’ve shared are a great starting point, but averages can only tell part of the story. Even in cities with minimum pay standards, such as New York, not every driver experiences the same results. Regulations can raise the floor on earnings, but they don’t guarantee you’re on the best app for your schedule, your location, or your style of driving.
That’s why it’s so important to track your own performance. Two drivers working in the same city can have completely different outcomes depending on which platform they choose, when they drive, and where they position themselves.
Gridwise makes this easy. By linking your gig accounts, you’ll see exactly:
- Which app is paying you the most per hour.
- When and where your trips are the most profitable.
- How downtime, bonuses, and tips affect your real take-home pay.
Instead of guessing whether a new law, a peak pay promotion, or a different platform is working in your favor, you’ll have data to prove it.
[elementor-template id="20936"]

Multi-Apping: Max Your Earnings With the Right App Stack
If you’re working in the gig economy and bot multi-apping, it’s time to rethink your strategy. Today’s most successful drivers don’t just sit around waiting for pings from one platform—they actively manage their day across multiple apps. This is called multi-apping, and it’s one of the most powerful ways to boost your earnings without working more hours.
By switching between rideshare and delivery services throughout the day, you can stay consistently busy, take advantage of demand surges, and avoid wasting time sitting idle. Multi-apping puts control back in your hands, allowing you to earn more every week while making better use of your time on the road.
[elementor-template id="20891"]
How Much More Do Multi-App Drivers Really Earn?
You might have heard that multi-app drivers earn more, but by how much?
According to insights from Gridwise, the answer is: a lot. Drivers who use multiple apps can earn up to 3x more per week than those who only work one platform.
This kind of increase comes from several advantages:
- Less downtime: When one app slows down, another one is still busy
- More flexibility: You can catch better offers across platforms
- Smarter stacking: Some services offer bonuses or surges at different times of day
Multi-apping doesn’t mean working nonstop. It means working smarter by knowing when and where to switch gears.
What App Combinations Are Most Common?
Not all app combos perform the same, and some pair better than others.
Based on Gridwise insights, the most common stacks for multi-app drivers include Uber, DoorDash, and Uber Eats.
Here are a few tried-and-true combinations:
- Uber + DoorDash: Rides in the morning, deliveries at night
- Uber Eats + DoorDash: A steady stream of food orders throughout the day
- Lyft + Uber: Double up on rideshare demand during peak commute hours
These combos work for many drivers because they help fill in gaps and keep trips coming in. But let’s be clear—just because these combinations are popular doesn’t mean they’re automatically the best fit for you.
What works in one market might not work in another. You might find that in your city, one app stays busy while another barely moves. That’s why it’s essential to use Gridwise insights to see what’s really working for you—in your city and on your schedule.
Timing Matters: Matching Apps to Peak Demand
The key to multi-apping isn’t just about running more apps—it’s about running the right apps at the right time.
Here’s how experienced drivers align their shifts with what’s actually in demand:
- Rideshare spikes in the morning and evening during commutes
- Food delivery jumps at lunch and dinner
- Grocery and package services tend to stay busy in the afternoons and on weekends
Multi-app drivers take advantage of these patterns. They treat their schedule like a business—adjusting in real time to what’s hot and when.
Instead of waiting around, you can use your stack to jump from one opportunity to the next. The result? More trips, more earnings, and fewer slow stretches.
Gridwise can help you identify these patterns and show you when the best hours really are in your city.
Your Best App Stack Depends on Where You Drive
This is something many new drivers overlook: what works in one city might be totally different in another.
Just because Uber Eats pays well in Dallas doesn’t mean it performs the same in Salt Lake City. Traffic patterns, local demand, population size, and even weather can change how each app performs.
To really know what’s working for you, you need personalized insights—based on your location, your shift times, and your own driving history.
When you connect your gig accounts to Gridwise, you unlock a clear view of which apps are bringing in the most money per trip, per hour, and per mile. You also get smart recommendations on when to work and which times are most profitable in your area.
How Gridwise Helps You Work Smarter (and Earn More)
Gridwise isn’t just about tracking your shifts. It’s about helping you make the most out of every hour you spend working.
Here’s what you get when you use Gridwise and connect your apps:
- Personalized performance insights across all your gigs
- Side-by-side comparisons of which apps earn you the most
- Demand heat maps that show you where the action is in real time
- "When to Drive" tools that show peak times based on your area
- Mileage tracking and income summaries to simplify taxes and planning
And here’s the best part: the more platforms you connect, the smarter your insights become.
[elementor-template id="20949"]
With Gridwise, you’re not just collecting numbers—you’re learning what actually works for you. That means no more guessing. No more wasting time on slow apps. And no more wondering whether you could be earning more somewhere else.
Smarter Driving Starts with Better Insights
Multi-apping can help you earn up to 3x more—but only if you know which apps work best for you. What’s popular in one city might underperform in another, and timing matters just as much as platform choice.
Gridwise takes the guesswork out by showing you when to drive, where to go, and which apps are worth your time. When you connect your gig accounts, you unlock personalized insights that help you earn more, every shift.
Drive smarter. Earn more. Let Gridwise guide the way.
[elementor-template id="20936"]

Grubhub vs Uber Eats Pay in 2026: Which Platform Pays Drivers More?
If you’ve ever compared your earnings across different delivery apps, you’ve probably asked the big question: Uber Eats vs Grubhub — who pays more? The answer isn’t as simple as one number. Each platform structures its pay differently, which affects both your totals and how your shifts feel.
This difference doesn’t just shape your totals at the end of a shift — it shapes how your work feels along the way.
[elementor-template id="20891"]
Grubhub vs Uber Eats Pay in Tips: What’s the Difference?
From July through December 2024, Grubhub workers earned 56% of their pay from tips, while Uber Eats workers earned just 44% from tips.

In other words, Grubhub relies more on customer generosity to boost payouts, while Uber Eats provides a steadier base (not taking bonuses into consideration). That might sound like a small distinction on paper, but it makes a real difference on the road.
- On Grubhub, a single big tip can turn a routine delivery into one of your best trips of the day — but if customers don’t tip, your totals drop quickly.
- On Uber Eats, tips are often smaller, but the stronger base pay cushions the impact, creating more predictable earnings.
Understanding this balance is essential if you want to set realistic expectations, plan your shifts, and ultimately decide which platform fits your goals best.
Why Pay Structure Matters for Gig Workers
Not all gig work feels the same. The structure of your pay doesn’t just shape your income — it shapes your strategy and even your mindset while you’re out earning.
Grubhub: High Reward, High Risk
On Grubhub, tips can make or break your shift. When customers tip generously, your pay climbs quickly. But when you’re flooded with low- or no-tip orders, your totals can stall. That volatility makes Grubhub exciting and rewarding in tip-friendly areas — and more frustrating in markets where tipping is less common.
Uber Eats: Steadier, But Lower Tips
Uber Eats is different. Base pay tends to be stronger and more consistent, which means you’re less dependent on customer generosity to maintain a decent hourly rate. The tradeoff, however, is that even when customers do tip well, the boost doesn’t have the same impact it does on Grubhub.
For workers, this matters because it changes how you think about your time. If you value predictability, Uber Eats may feel less stressful. If you’re confident about targeting wealthier neighborhoods or dinner rushes, Grubhub could deliver bigger rewards.
Uber Eats vs Grubhub: Who Pays More?
The numbers make one thing clear: there’s no single winner. The question of “Uber Eats vs Grubhub — who pays more?” depends on your city, your habits, and your comfort level with risk versus stability.
- In tip-heavy markets, Grubhub can come out on top.
- In cities with lower tipping culture, Uber Eats’ stronger base pay can deliver steadier results.
- The only way to know for sure is to track your own mix of base pay and tips across platforms.
The Next Step: Use Your Own Insights
National averages give us a picture of how apps pay, but what really matters is your market. Tip percentages, base pay structures, and customer behavior can vary dramatically between cities — and even between neighborhoods.
That’s why the smartest move is to track your personal earnings mix. How much of your pay comes from tips, and how much comes from base pay? That’s why the best way to answer “Uber Eats vs Grubhub who pays more?” is to track your own results over time.
Use Gridwise to Understand Your Earnings
Charts and averages are helpful, but the real value comes from knowing how your own shifts stack up. The first step to getting there is simple: link your accounts in Gridwise.
[elementor-template id="20949"]
Once you connect your accounts, Gridwise automatically brings your earnings into one place and gives you insights you can actually use:
- Track your total pay across Uber Eats, Grubhub, DoorDash, and more
- See how your earnings change week by week
- Compare platforms side by side to spot which one performs best in your market
- Identify local demand patterns so you know the best times and places to work
When all your results are in one place, you can finally stop guessing and start planning your shifts around what really works.
Download Gridwise today and link your accounts to unlock your personalized insights and take the first step toward smarter, more profitable driving.
[elementor-template id="20936"]
Discover more articles like this:
Uber and Lyft Earnings Per Trip Are Rising in 2025
After a challenging year in 2024, many rideshare drivers are starting to see signs of a rebound—at least on a national scale.
That kind of shift suggests the market may be stabilizing. But remember—these are national trends. Your own results may vary based on when, where, and how you drive.
In this article, we’ll break down what this rebound could mean for your driving strategy. You’ll learn why pay per trip matters, how to take advantage of higher earnings, and how to track your own performance so you can drive smarter—not just longer.
[elementor-template id="20891"]
Rideshare Earnings Per Trip Are Back on the Upswing
By late 2024, earnings began to recover—and the latest insights show some progress. In July 2025, average rideshare earnings per trip were 3.4% higher than in July 2024.
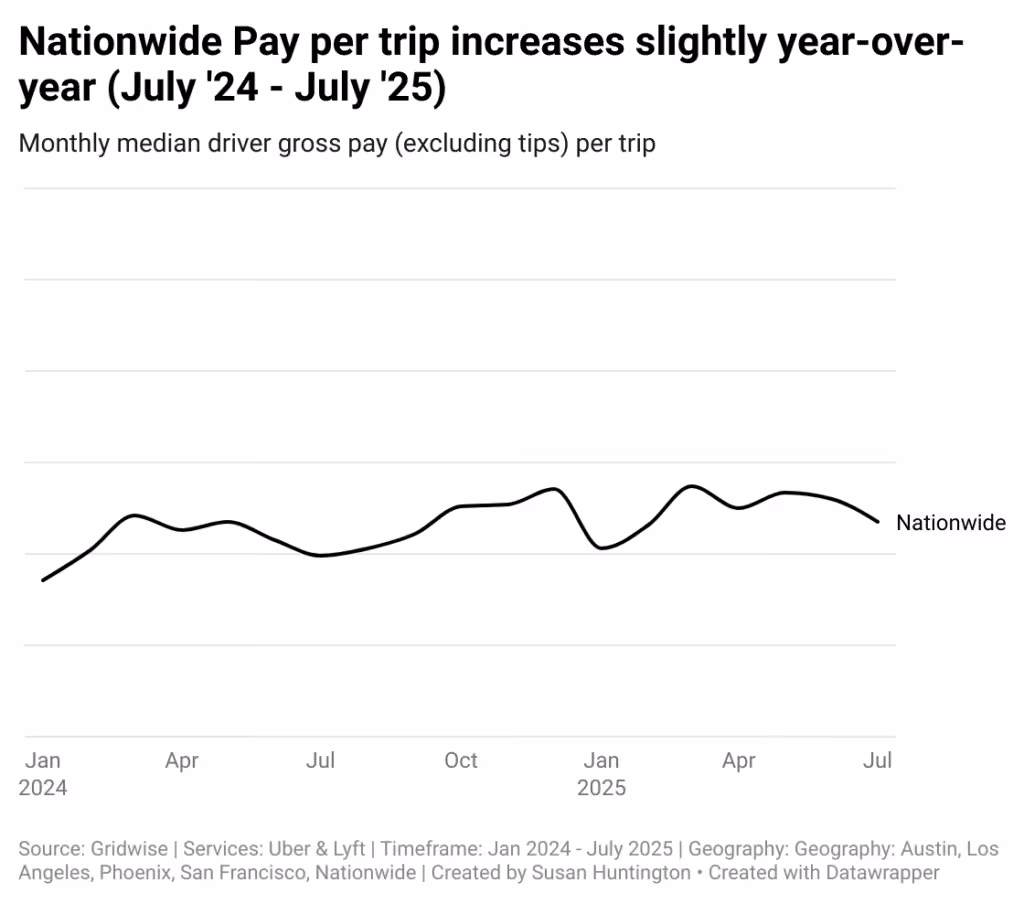
Why Pay Per Trip Matters
There are plenty of ways to measure gig earnings — per hour, per week, or even per mile — but pay per trip is one of the most meaningful. This single number reflects how efficiently your time translates into income. When pay per trip is higher, you need fewer rides to hit your goals, which means you can spend less time chasing low-value trips and more time driving when it counts.
On the other hand, when pay per trip falls, drivers are forced to accept more requests or stretch their shifts longer to make up the difference. That quickly leads to fatigue and burnout. This is why tracking your pay per trip is so important: it gives you a clear sense of whether your work is sustainable and rewarding, not just whether you’re scraping together enough hours.
What the Rebound Means for Your Strategy
The recent rebound in pay per trip gives workers a chance to rethink how they structure their shifts. Instead of feeling pressure to accept every request that comes through, you can be more selective and focus on the rides that truly make sense. With each trip paying more, it may not be necessary to chase sheer volume anymore.
For example, you might concentrate your efforts on peak demand periods like morning commutes, lunchtime rushes, or late-night crowds. Driving fewer but more focused shifts also delivers better results than spreading yourself thin across the whole week. And when promotions or bonuses appear, they now add even more value on top of improved base earnings. In short, the rebound means you can focus on quality over quantity and still reach your income targets.
Why Tracking Your Own Pay Is Essential
Of course, national averages only tell part of the story. Your pay per trip might look very different from someone else’s, even if they are in the same city. The difference often comes down to when you choose to work, which neighborhoods you drive in, the types of trips you accept, and how you structure your time online.
That’s why the most important question to ask isn’t whether rideshare pay in general is going up — it’s whether your own pay per trip is improving. Without keeping track, it’s almost impossible to know. When you monitor your earnings consistently, you can spot patterns, identify what works, and quickly adjust when conditions shift.
Use Gridwise to Unlock Personal Insights
The good news is that you don’t have to track everything manually. Gridwise makes it simple to see exactly how your pay per trip is trending. To get started, there’s one key step:
Step 1: Link Your Accounts
When you connect your rideshare accounts to Gridwise, the app automatically pulls in your trips and earnings. That unlocks personalized insights that show you:
- Your true pay per trip for every shift
- How your results compare across apps like Uber and Lyft
- Which days and hours deliver the best returns in your city
- How your performance stacks up against local trends
With these insights, you can plan smarter shifts, cut back on wasted time, and focus on the rides that actually move the needle.
Download Gridwise today and link your accounts to take the first step toward smarter driving and higher earnings.
[elementor-template id="20936"]
More Tips for Smarter Driving:
Work smarter. Earn more.
Whether you drive, deliver, or pick up shifts — Gridwise helps you track earnings, mileage, and performance so you stay in control of your work. Download the app and take charge today.
