Gridwise blog
Tips, insights, and advice to help you earn more and work smarter, whether you do gig work, hourly, or shift work.
How to Make $1,000 a Week With Uber Eats in 2026 (Tips + Hourly Data)
In this blog, we'll explore the strategies and techniques that can show you how to earn $1000 per week as an Uber Eats delivery driver. We'll cover everything from optimizing your delivery zones and schedules to maximizing your tips and customer satisfaction. Whether you're a seasoned Uber Eats driver or just starting out, this guide will provide you with the insights and actionable steps to take your Uber Eats driver earnings to the next level.
Becoming an Uber Eats delivery partner can be a lucrative opportunity, especially if you're able to consistently earn $1000 a week. By understanding the platform, optimizing your delivery strategies, and focusing on customer satisfaction, you can maximize your earnings and turn Uber Eats into a reliable source of income.
We’ll cover the following topics to provide coaching and ideas to help you push your earnings up to that $1000 per week level:
[elementor-template id="20891"]
What do Uber Eats drivers do?
Uber Eats drivers deliver prepared food most of the time, but they also might shop for and deliver goods from convenience outlets and grocery stores. The job is pretty simple. You get a request for an order, you drive to the restaurant or store to pick it up, and then you deliver it to the customer. If you already drive for Uber, you can choose to take orders for Uber Eats delivery any time.
If you’re not an Uber Eats driver yet, it’s pretty easy to become one. This Gridwise post tells you what you need to do if you want to sign up and start making money Uber Eats style. Many rideshare drivers welcome the chance to deliver food rather than people. This article from Nerdwallet covers the Uber Eats gig from that angle.
There are some sweet advantages to working with Uber Eats. In lots of cities you don’t even need to have a car. You can use a bike or a scooter, or even walk, to make your rounds. If you do use a car, Uber Eats’ requirements are a lot easier to meet than they are for Uber rideshare driving.
You also have a lot of flexibility. You can shop and deliver convenience items and groceries, but you don’t have to. And, like most driving gigs, you can choose your own hours, and map out the locations where you want to work.
Use Gridwise features When to Drive and Where to Drive to help you figure out what work hours and which specific areas will be the most profitable for you. Real data from real delivery people will show you earning patterns for drivers in your town.
[elementor-template id="20949"]
How much can you earn doing Uber Eats?
The honest answer to this question is: basically, as much as you want! It all depends on how many hours you put in and how strategic you are about your gig. Earnings vary from one area to another, as this article from Entrepreneur points out. To give you a baseline, let’s look at the earnings of Uber Eats drivers who tracked their earnings with Gridwise.
Remember that these numbers show us only average earnings. To make $1,000 a week with Uber Eats, you’re going to have to be better than average, and we’ll show you how. For now, though, it’s good to have these figures so you get a ballpark number of where to start.
How much do Uber Eats drivers make?
Gridwise data tell us the following:
- Monthly earnings average around $444.00 per month.
- Gross earnings per trip are between $9.00 and $10.00.
- Tips make up about 50% of most Uber Eats drivers’ income, which amounts to about $225.00 per month.
Is Uber Eats good money? It can be. While there are other gigs that pay more per trip, if you drive for Uber Eats, you’ll always be pretty busy.
https://datawrapper.dwcdn.net/HPAz8/3
You can also see that, unlike many other gigs, tips play a huge role in Uber Eats earnings.

With these numbers as a baseline, what can we say about how to earn $1,000 a week with Uber Eats? As we said in the introduction, it’s going to be a hustle, but it’s really possible. To figure out how to make the most money with Uber Eats, let’s start by looking at how many trips these “average” drivers made each month.
We know that average gross earnings were $444.00 per month, and drivers got around $10.00 per trip. That means they took 44 or 45 trips per month, which breaks down to 11 trips per week. That’s not a lot of Uber Eats delivery, is it?
The fact that Uber Eats drivers averaged so few trips shows us that many drivers use more than one app at the same time. This is called multi-apping, and you can learn more about it in this Gridwise post. If you want to answer the question of how much you can make with Uber Eats, then you need to stick with the app and keep plugging away at those orders. You also need solid strategies, as well as some inside tips and tricks.
How to make the most money on Uber Eats: Delivery driving tactics
Getting to that $1,000 a week with Uber Eats isn’t so hard when you remember that the drivers we saw making about $111 a week were only taking around 11 trips in the same time period. That’s not much at all! If you work the Uber Eats app like a boss, you’ll soon have many more trips than that, easily reaching the number needed to get you to $1,000 a week. Now, let’s get to some tactics you’ll need to make that kind of bank.
- Stay with the Uber Eats app, and track your earnings. Gridwise can easily do that for you. Simply sync your Uber Eats app with Gridwise, and you’ll be able to see how much you’ve earned with Uber Eats, what times were most profitable, and your average hourly pay. Racking up trips with Uber Eats has other benefits, including perks and bonuses that are awarded to top drivers.
- Leverage surge pricing and promotions. Surge pricing is applied when there is a lot of demand. When surge pricing is in effect, many of the trips you make will pay more than usual. Promotions are offered to drivers who complete a given number of trips in a certain time period. High traffic volume days, nights, and times give you these chances to get extra earnings. Challenging yourself to complete the right number of trips for promotions will add to the number of trips you can count on for big bucks, too. Learn more about Uber Eats surge pay, boosts, and promotions in this Gridwise blog post.
- Say yes to doubling up on orders. With Uber Eats, you can get back-to-back orders or receive batched orders. Back-to-back orders happen when you receive a new request while you’re on the way to deliver an original order. The Uber Eats app routes these trips automatically, so you won’t be sent out of your way.
Batched orders are Uber Eats’ way of bundling together orders from either the same restaurant, or two nearby eating establishments. You get money—and trip count credit—for all the orders you complete, plus customer tips, without having to make a bunch of separate trips.
- Turn on the charm and get bigger tips. Being nice really is part of the Uber Eats driver’s job, and getting tips is one way people who drive for Uber Eats make money beyond their basic pay.. Bring along those extra napkins and condiments, use equipment that keeps food and drinks at the right temperatures and prevents spilling, and consider your customers’ needs. If you deliver groceries, be extra careful with delicate items such as bread and eggs.
And, most important, follow your customers’ directions, and stay in communication with them if you are going to be delayed, or if you have questions about their order. This Gridwise post will tell how to get bigger tips as a delivery driver.
- Use even more charm to keep your ratings high. As an Uber Eats driver, you will be rated by the restaurant or store where you pick up the orders as well as the customers who are waiting for the deliveries. This two-way rating system is designed to keep you on your toes, so Uber can keep people satisfied with your service. Don’t worry—you get to rate them, too.
There’s another reason why your rating as a driver is important. It not only keeps you in good standing with Uber; it helps you to qualify for the Uber Eats Pro incentive program. To learn more about Uber Eats Pro, and what it takes to earn perks such as preferred services, discounts, and deals, check out this Gridwise blog post.
Smart business moves that seal the deal
Now that you know how to gobble up the deliveries you need to make $1,000 a week with Uber Eats, it’s going to be a breeze to get there. Let’s make it even easier, with business moves that boost your earnings and shrink your expenses. If you use these, it will also be easy to say yes when people ask, “Can you make good money with Uber Eats?”
Minimize expenses. Avoid racking up big fast-food bills by bringing your own food and beverages. You might not think you’re hungry when you first start your Uber Eats run, but once the aroma of pepperoni pizza, premium cheeseburgers, and piping hot fries start wafting through your car, that might change. Bring a sandwich or other healthy food from home, and buy bottled water in bulk to save tons of cash compared to what it costs to buy single servings.
Maximize tax deductions. Another way to minimize your expenses is to maximize your tax deductions. Start by tracking mileage with Gridwise.
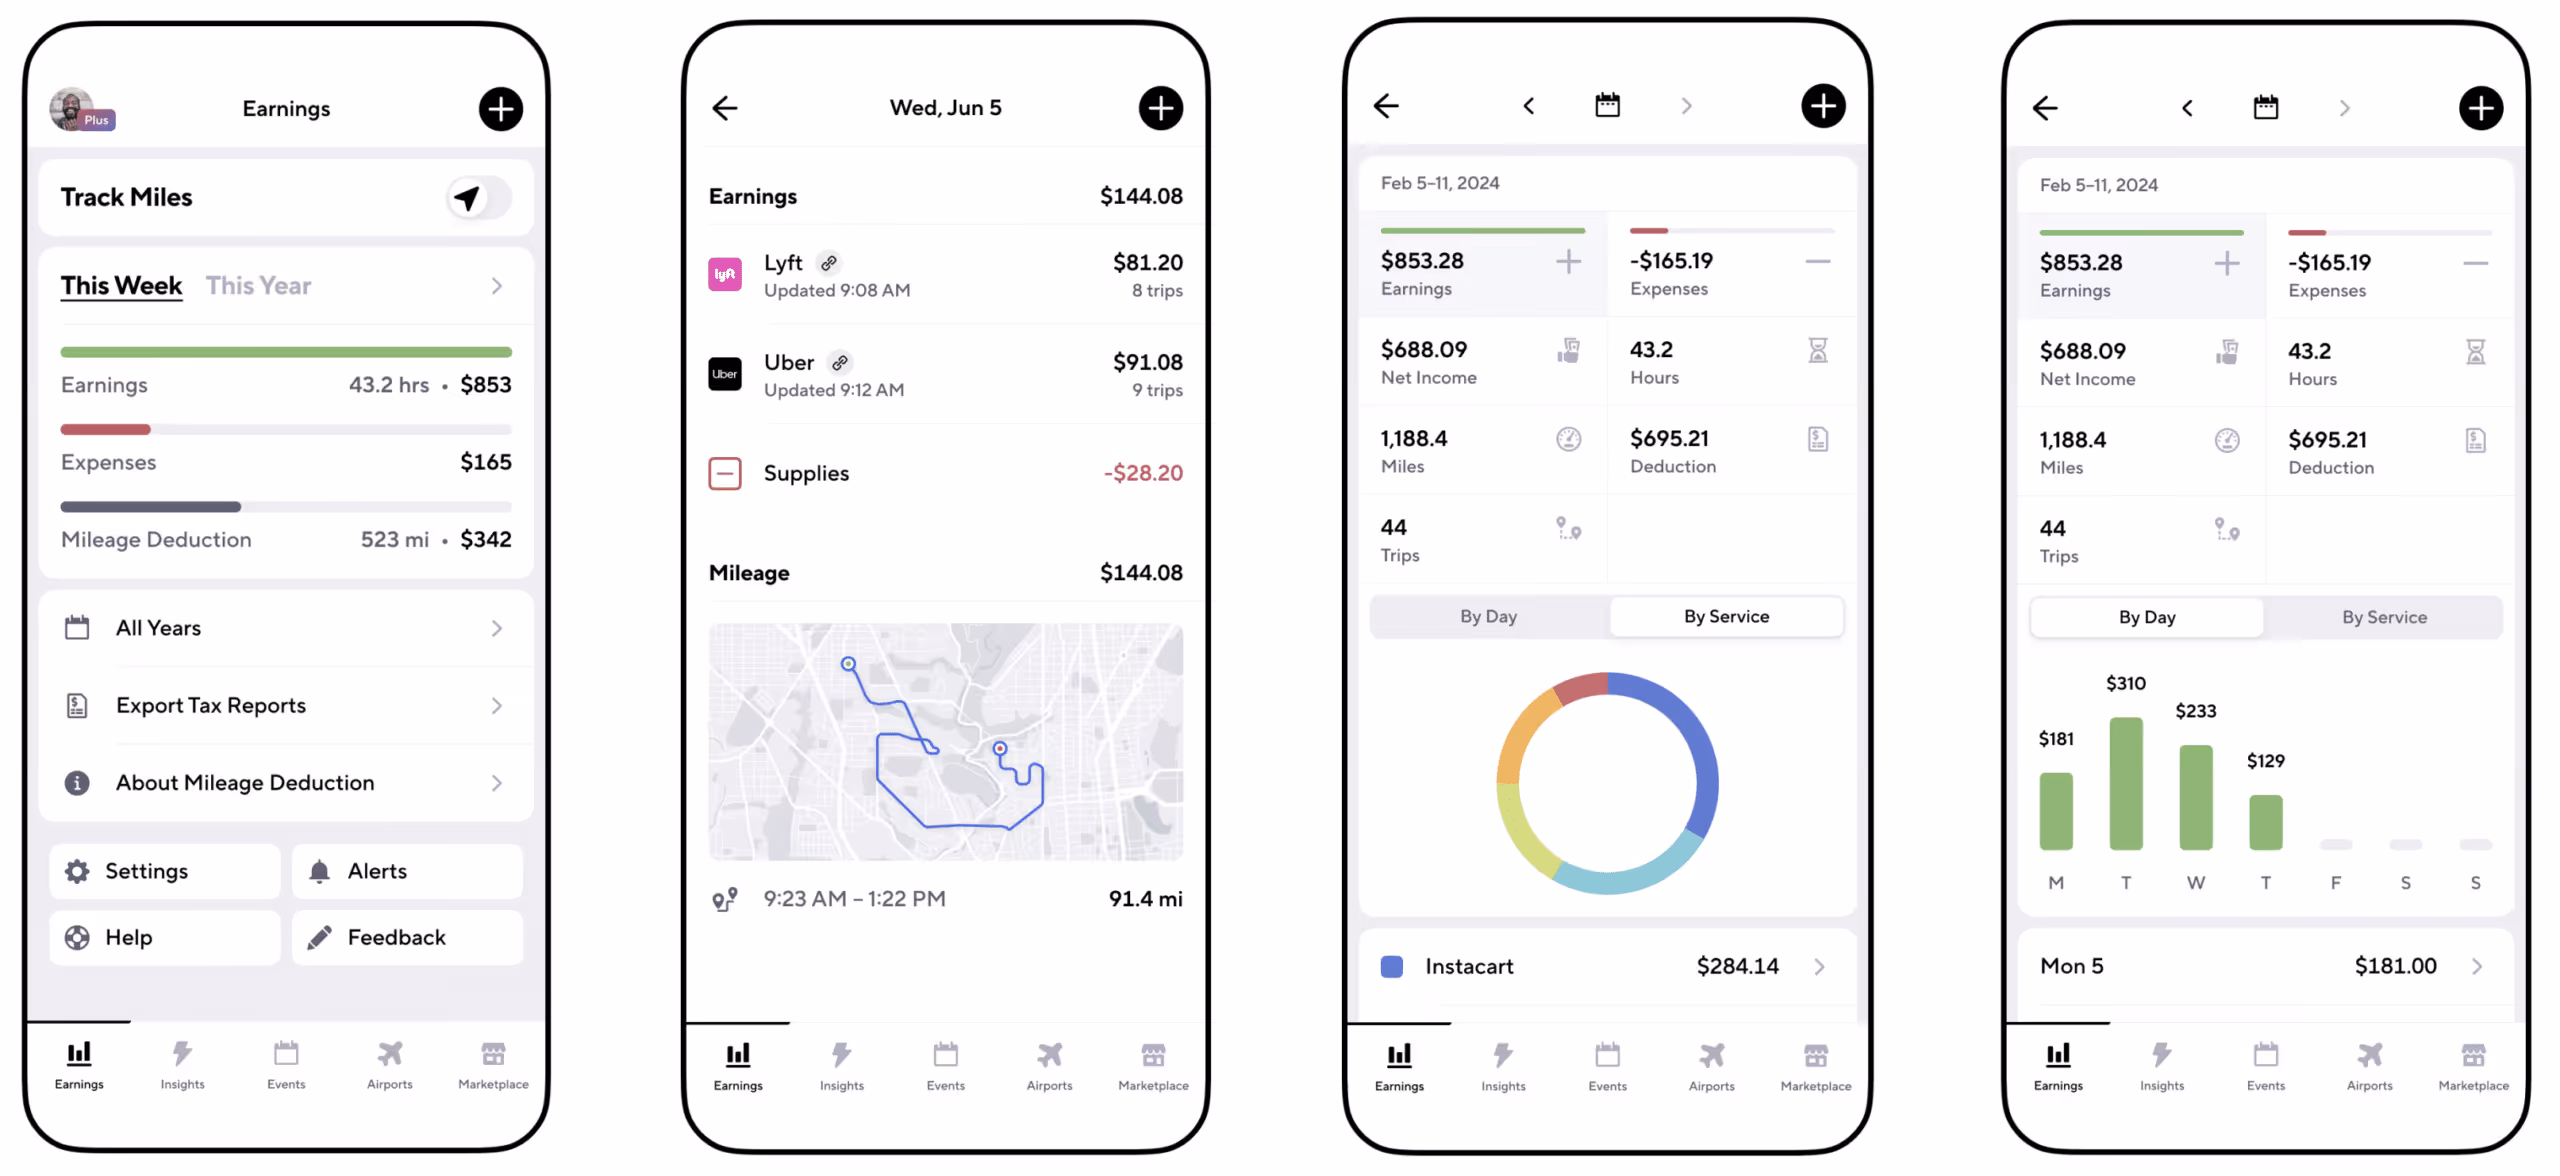
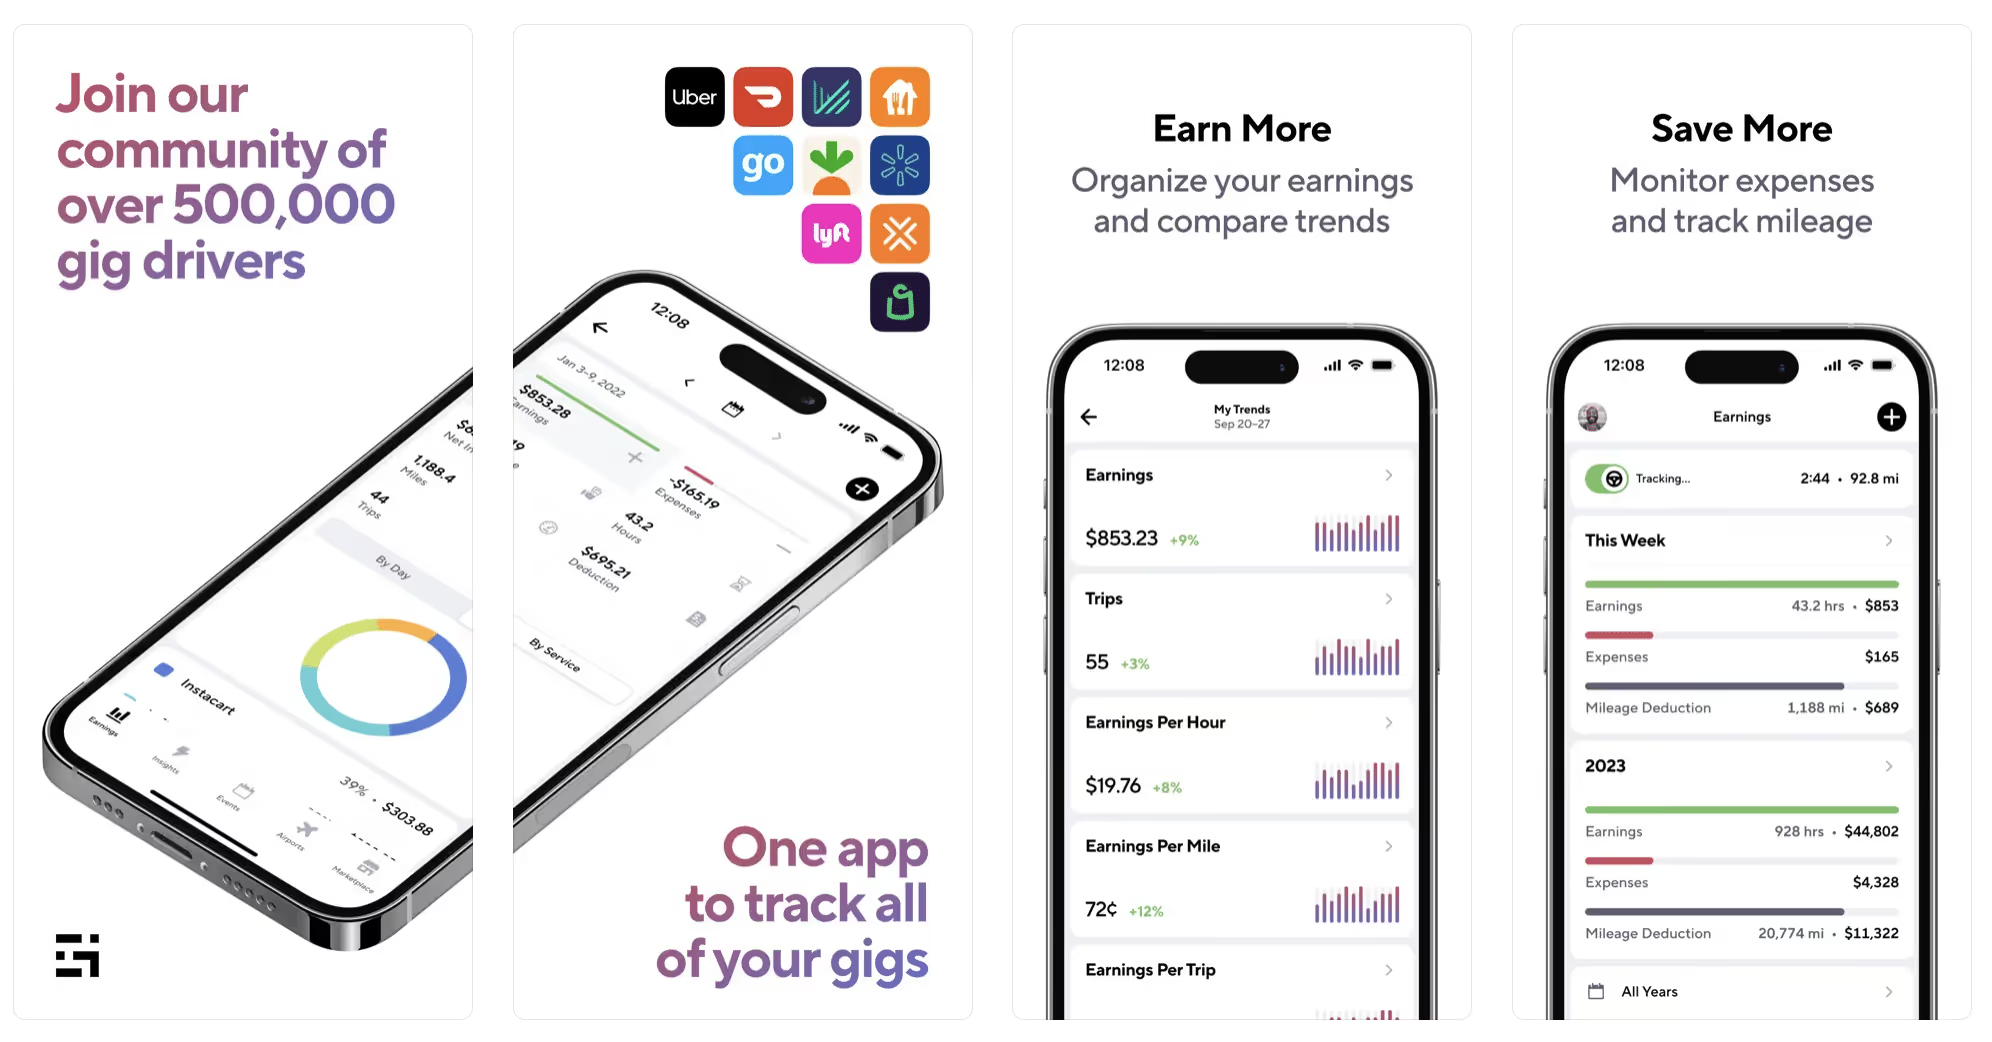
Gridwise App
Gridwise captures every deductible mile you drive, including the distance you cover between the trips your driving app records. Know what expenses you can deduct, and put them to work for you when tax time comes. Learn more about tax deduction strategies in the Gridwise Tax Guide for drivers.
Boost earnings with referrals
As an independent contractor, you’re probably looking for ways to make even more money than you can with Uber Eats. And most gig workers like you enjoy getting passive income. With Uber Eats, there’s a really easy way to do that—referrals!
All you need to do is find friends and encourage them to deliver for Uber Eats. If they make a certain number of deliveries within a specified time, you will get paid for doing nothing more than having them sign up under your referral code! Rates of pay vary by city, so check your Uber Eats app to find out what the current deal might be, and learn more about the referral program on the Uber Eats website.
Also remember: “friends” don’t have to be your best buds. Many delivery people carry cards with a QR code linking to their referral information, so just about anyone you encounter can join Uber Eats and boost your earnings. You could meet a source of passive income at the gas station, on social media, or at your high school reunion. The more you hustle, the more there is to gain, right?
Master the art of self-employment
As an Uber Eats driver, you’re an independent contractor. That means the company isn’t going to withhold your taxes, provide insurance, keep track of your earnings, or tell you about tax deductions. You’ll have to do all these things for yourself.
If you want to maximize your tax advantages, open an official business entity. You can incorporate (create a corporation) or you can work as a limited liability corporation (LLC). You can also work with a DBA (Doing Business As) arrangement, but the corporation or LLC will do a better job of protecting you from liability.
Establishing a corporation or LLC offers better tax advantages than being a sole proprietor. For instance, if you simply collect your earnings into your private account, you’ll be charged self-employment taxes in most states. And paying extra taxes is something we all want to avoid, within legal limits, as much as possible.
Every Uber Eats driver needs to learn about self-employment, and there are some great resources you can review. Check out the CareerOneStop website about self employment which will help explain the basics. You can also check with a professional tax accountant, or look other websites to learn more about actually creating a business.
Scope out your market
Look at the area around you to see where you’re likely to get the most deliveries. Where are all the restaurants? Where might people be more inclined to order deliveries? What hours do you want to drive? What activities might be going on around those times? Think about late-night and after-school times as well as breakfast, lunch, and dinner times.
Be realistic about the potential for your area and aware of new services opening up. For example, in New York, there is already a tab on the Uber Eats app that allows customers to order groceries. In our article about the best food delivery service to work for you’ll see that Uber Eats stacks up well against other delivery companies, mainly because of its potential for expanded opportunities for drivers to earn.
So, is Uber Eats good money? As we said, it isn’t an automatic guarantee that everyone will make $1,000 a week with Uber Eats. Trying out the suggestions we give you here, though, should put you on the right track! Go out there and start stacking up those orders and raking in some impressive earnings!
[elementor-template id="20936"]
Get more inside information on Uber Eats in these posts from the Gridwise blog:
- The delivery driver guide: Using the Uber Eats app
- Everything you need to know about driving for Uber Eats
- Uber Eats Pro: What drivers need to know
- Looking for a different gig, part-time or full time job? Check out the Gridwise Job board.
Uber Eats FAQ
How does the Uber Eats platform work for drivers?
Uber Eats is a food delivery service that connects customers with local restaurants and independent delivery partners. As an Uber Eats driver, you'll receive notifications of nearby delivery requests, which you can accept and complete. The platform provides flexibility, allowing you to work on your own schedule and earn money based on the number of deliveries you complete.
What are the requirements to become an Uber Eats delivery partner?
To become an Uber Eats delivery partner, you'll need to meet certain requirements, such as having a valid driver's license, a registered vehicle, and passing a background check.
How can I choose the right delivery zone to maximize my earnings?
Selecting the right delivery zone can significantly impact your earnings, as some areas may have higher demand and better-paying orders. It's important to research and identify the zones in your area that tend to have the most consistent and lucrative delivery opportunities.
How can I take advantage of peak delivery hours and surge pricing?
Understanding peak delivery hours, such as mealtimes and weekends, and taking advantage of surge pricing can boost your earnings. Be aware of when demand is highest in your area and adjust your schedule accordingly to capitalize on these peak periods.
What are some tips for maximizing tips and customer satisfaction?
Providing excellent customer service and going the extra mile to ensure a positive experience can lead to more tips and repeat business. Prioritize communication, timeliness, and attention to detail to keep your customers happy and satisfied.
How can I set realistic weekly goals to reach my $1000 target?
To make $1000 a week with Uber Eats, it's essential to set realistic weekly goals and track your earnings and expenses. Start by determining your target earnings and breaking it down into achievable daily or weekly goals. This will help you stay on track and make adjustments as needed.
What are some strategies for efficient route planning and navigation?
Effective route planning and navigation can save you time and fuel, allowing you to complete more deliveries. Utilize mapping apps and take advantage of features like real-time traffic updates and turn-by-turn directions to find the quickest routes.
How can I balance my Uber Eats deliveries with other commitments?
Develop a schedule that allows you to capitalize on peak delivery hours while still maintaining a healthy work-life balance. Consider using tools like calendar apps to plan your availability and track your hours to ensure you're maximizing your earning potential without sacrificing your personal life.
What are the key considerations for maintaining my vehicle as an Uber Eats driver?
Keeping your car clean and well-maintained is crucial for maximizing your Uber Eats earnings. Regularly scheduled oil changes, tire rotations, and other preventive maintenance can help extend the life of your vehicle and minimize downtime. Additionally, budgeting for vehicle-related expenses, such as fuel, insurance, and repairs, will ensure you're accounting for these costs and maximizing your net earnings.
What are the tax obligations and legal considerations for Uber Eats drivers?
As an Uber Eats delivery driver, it's essential to understand the tax obligations and legal considerations that come with being an independent contractor. This includes properly reporting your earnings, deducting eligible business expenses, and making quarterly estimated tax payments. Additionally, you'll need to ensure you have the appropriate insurance coverage, such as personal auto insurance and possibly commercial auto insurance, to protect yourself and your vehicle while on the road making deliveries.

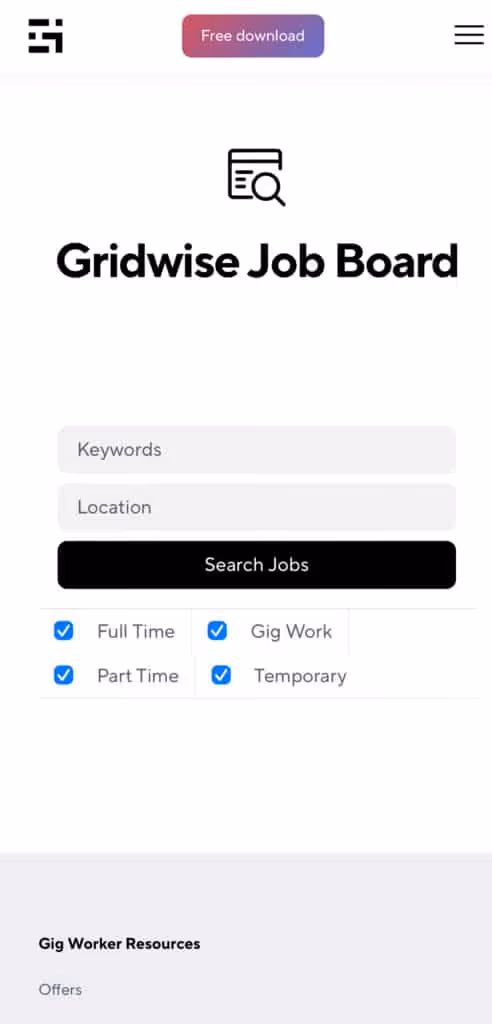
The Gridwise Job Board: Find Your Ideal Job or Gig Work
Gridwise is an essential assistant app created by gig workers for gig workers. Our mission is to support those engaged in gig work in every way possible. We understand how challenging it can be to deal with income instability, a lack of benefits, and job insecurity that often comes with gig work. The Gridwise app tracks and organizes earnings and expenses, and offers a wide array of discounts, deals, and services that make the lives of independent contractors easier and more rewarding.
We firmly believe it’s possible to make a viable living and create a gig experience that offers flexible hours, variety, and excitement. With issues such as consistent earnings and job security in mind, Gridwise is proud to offer a centralized platform that shows you how to find gig work and secure reliable opportunities. We’re proud to introduce the Gridwise Job Board.
[elementor-template id="20891"]
The Gridwise Job Board: Key features
Because Gridwise is dedicated to serving the gig worker community, we’ve filled the Gridwise Job Board with useful features that won’t waste your precious time.
- Comprehensive listings. Find part-time, full-time, temporary, and per-task work. Drive or deliver with your vehicle, utilize an employer’s vehicle, or even find non-driving gig work.
- User-friendly interface. Find the jobs that are right for you with a tap of your screen.
- Verified opportunities. We vet the jobs before they are listed to ensure you’re getting high-quality job postings.
How to get more gig work, seasonal, part-time or full-time jobs with the Gridwise Job Board
Looking specifically for “gig work apps” or “gig jobs near me?” You’re in luck. Our filters and search functions send you directly to the listings you seek.
Here’s how it works.
- Access the Job Board via the Gridwise website.
- Search for jobs by type, location, and more.
- Select the job that interests you, and read all about it.
- Scroll through the description, and if it appeals to you, click “Apply for job.”
Many types of jobs are available. Adjust the search filter to see the full variety of opportunities that will let you cash in. Deliver food, set up catering, do rideshare driving, get paid for doing package delivery, and much more. You’ll find short-term gigs, long-term contracts, and part-time positions.
Perks of the Gridwise Job Board for gig workers
Gig workers who know how to make extra money will appreciate how the Gridwise Job Board lets you multiply your chances of bringing in big earnings. Here’s how:
- Increased stability. Use the Gridwise Job Board to find part-time or permanent jobs in addition to the part-time gigs you already have. Always keep a steady stream of earning opportunities flowing toward you.
- Flexibility and autonomy. Choose jobs that fit your schedule, work around other jobs and family duties, and still leave room for some fun in your life. Discover side hustles to supplement your full-time job, permanently or just for the season.
- Skill development. Find part-time work that lets you use a skill you already have, or try your hand at something new. It’s a smart way to develop a portfolio to showcase what you can do, or even to find permanent employment.
Get Gridwise and stay up to date on the Gridwise Job Board
Gig workers need plenty of information and assistance, and Gridwise is here to give it to you. Download the app and get essential features such as
- seamless earnings tracking
- mileage tracking
- expense recording, including notes
- low-cost and no-cost insurance benefits
- access to affordable medical, dental, vision, mental health, and alternative care
- professional services including legal and financial help
- deals and discounts
- weather, events, and traffic reports
- inside information on where and when to drive
[elementor-template id="20936"]
More to know about gig work:

5 Best Mileage Trackers For Gig Drivers
Many drivers ask, “Do I really need a mileage tracking app?” The answer is simple: only if you want to have an accurate count of all the miles you can legally deduct from your taxable income! You might think your rideshare or delivery driving app has got you covered. After all, they do quite a good job of logging the miles you drive while you’re on a trip or delivery. But, if you want to have the best app to track mileage for Uber, Lyft, Doordash, Instacart, or the other apps you may use, you need more. Why is that?
Without a separate tracker, you’re missing the miles you drive in between pings. Did you realize that all the miles you drive, from the moment you begin your shift until it’s over (as long as you don’t drive several miles on a break to hang with your friends), are tax deductible! That means you need something besides your driving app to keep an accurate count of your travels. Read this Gridwise post to see how important it is to keep track of every deductible mile.
You won’t be surprised to hear that there’s an app for tracking miles. In fact, there are several of them. Here, we’re going to tell you about five top mileage tracking apps, and help you figure out which one is best for you.
Before we get to the list and identify the best mileage tracker app, let’s clarify what exactly a mileage tracking app is. According to G2.com’s technology glossary, mileage tracking is done for the purpose of keeping a log of mileage that is either reimbursable or tax deductible.
And yes, of course you can track your miles simply by taking readings on your odometer. But are you really prepared to account for how many miles you drove for personal reasons and subtract them from the total to get your business mileage? Even if you can remember all that and do the arithmetic, if you want an accurate reading of the miles you drive for business, and can therefore deduct, a mileage tracking app will save you a lot of trouble and prevent you from making costly errors.
Plus, as a gig driver, you have specific needs when it comes to a mileage tracker. Ideally, you’d be able to handle mileage tracking and several other functions all in one app. It can be maddening enough to deal with driving apps, particularly if you’re an avid multi-apper. You would want your mileage tracker app to help you keep account of other aspects of your business, including income, expenses, and inside information about the art of gig driving.
Not all mileage apps are equal, to be sure! Let’s look at five of the best apps to track mileage and figure out which is the best app to track mileage with Uber and Lyft, or what mileage tracker app is best for DoorDash.
[elementor-template id="20891"]
1. Zoho Expense
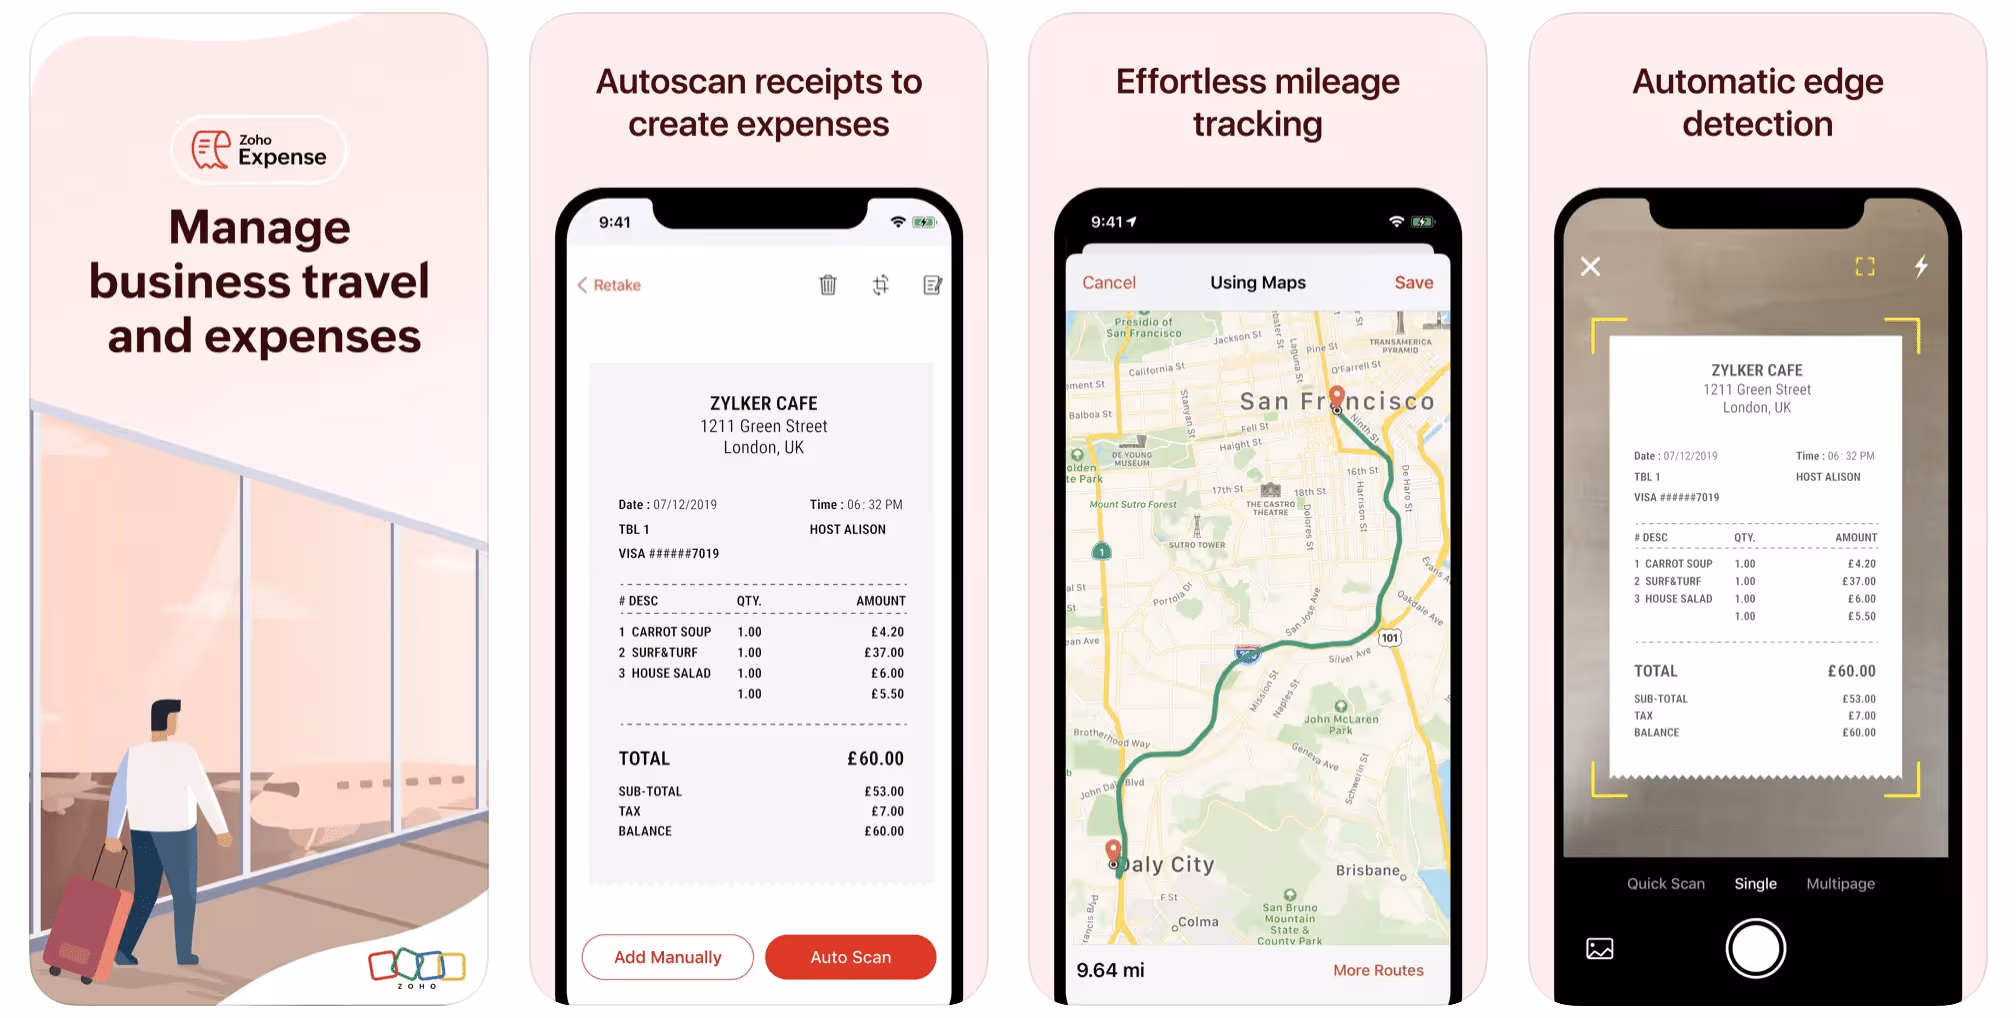
First up is Zoho Expense, which does exactly what its name says. This app is designed to allow companies to give employees a uniform way to create and submit expense reports. It can be used by individuals, including gig drivers, as well.
It includes a mileage tracker, as well as features that let you track other deductible expenses, including the ability to scan and record receipts.
Available on Android and Apple: Yes
Ratings: 4.8 stars on App Store, 4.7 stars on Google Play
Free Version: Yes
Subscription price: $3 per month, billed annually
Created specifically for gig drivers: No
2. Quickbooks Online
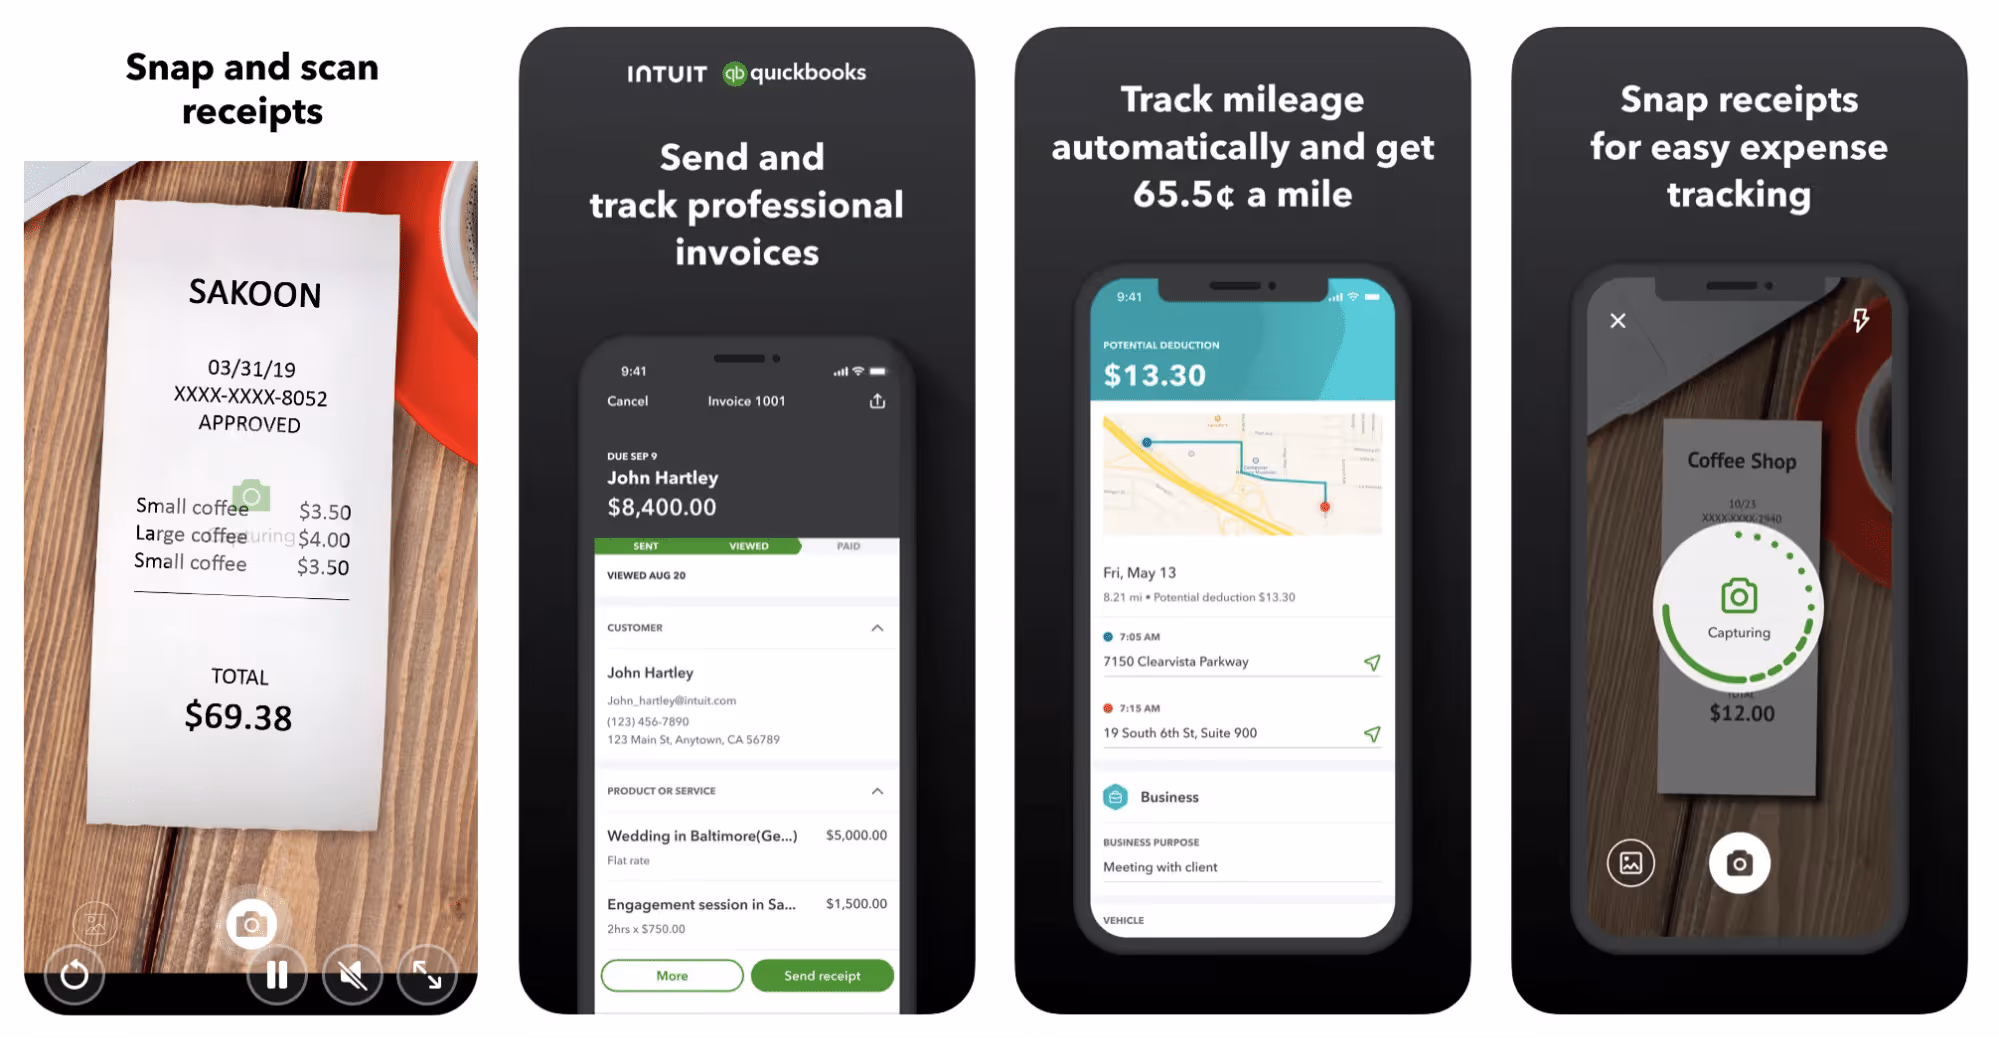
Quickbooks Online is a cloud-based app that allows you to track your mileage, earnings, and expenses. The information you enter can then be used to generate various reports that prepare you for tax time. It also allows you to create graphs that illustrate your cash flow, and includes a receipt scanner so you can instantly record deductible expenses. Quickbooks is popular, highly reliable, and designed mainly to help people keep track of their small businesses.
Available on Android and Apple: Yes
Ratings: 4.7 stars on App Store, 4.4 stars on Google Play
Free version: 30-day free trial
Subscription price: $15 per month for basic version if purchased for 3 months or more
Created specifically for gig drivers: No
Source: quickbooks.intuit.com
3. Shoeboxed
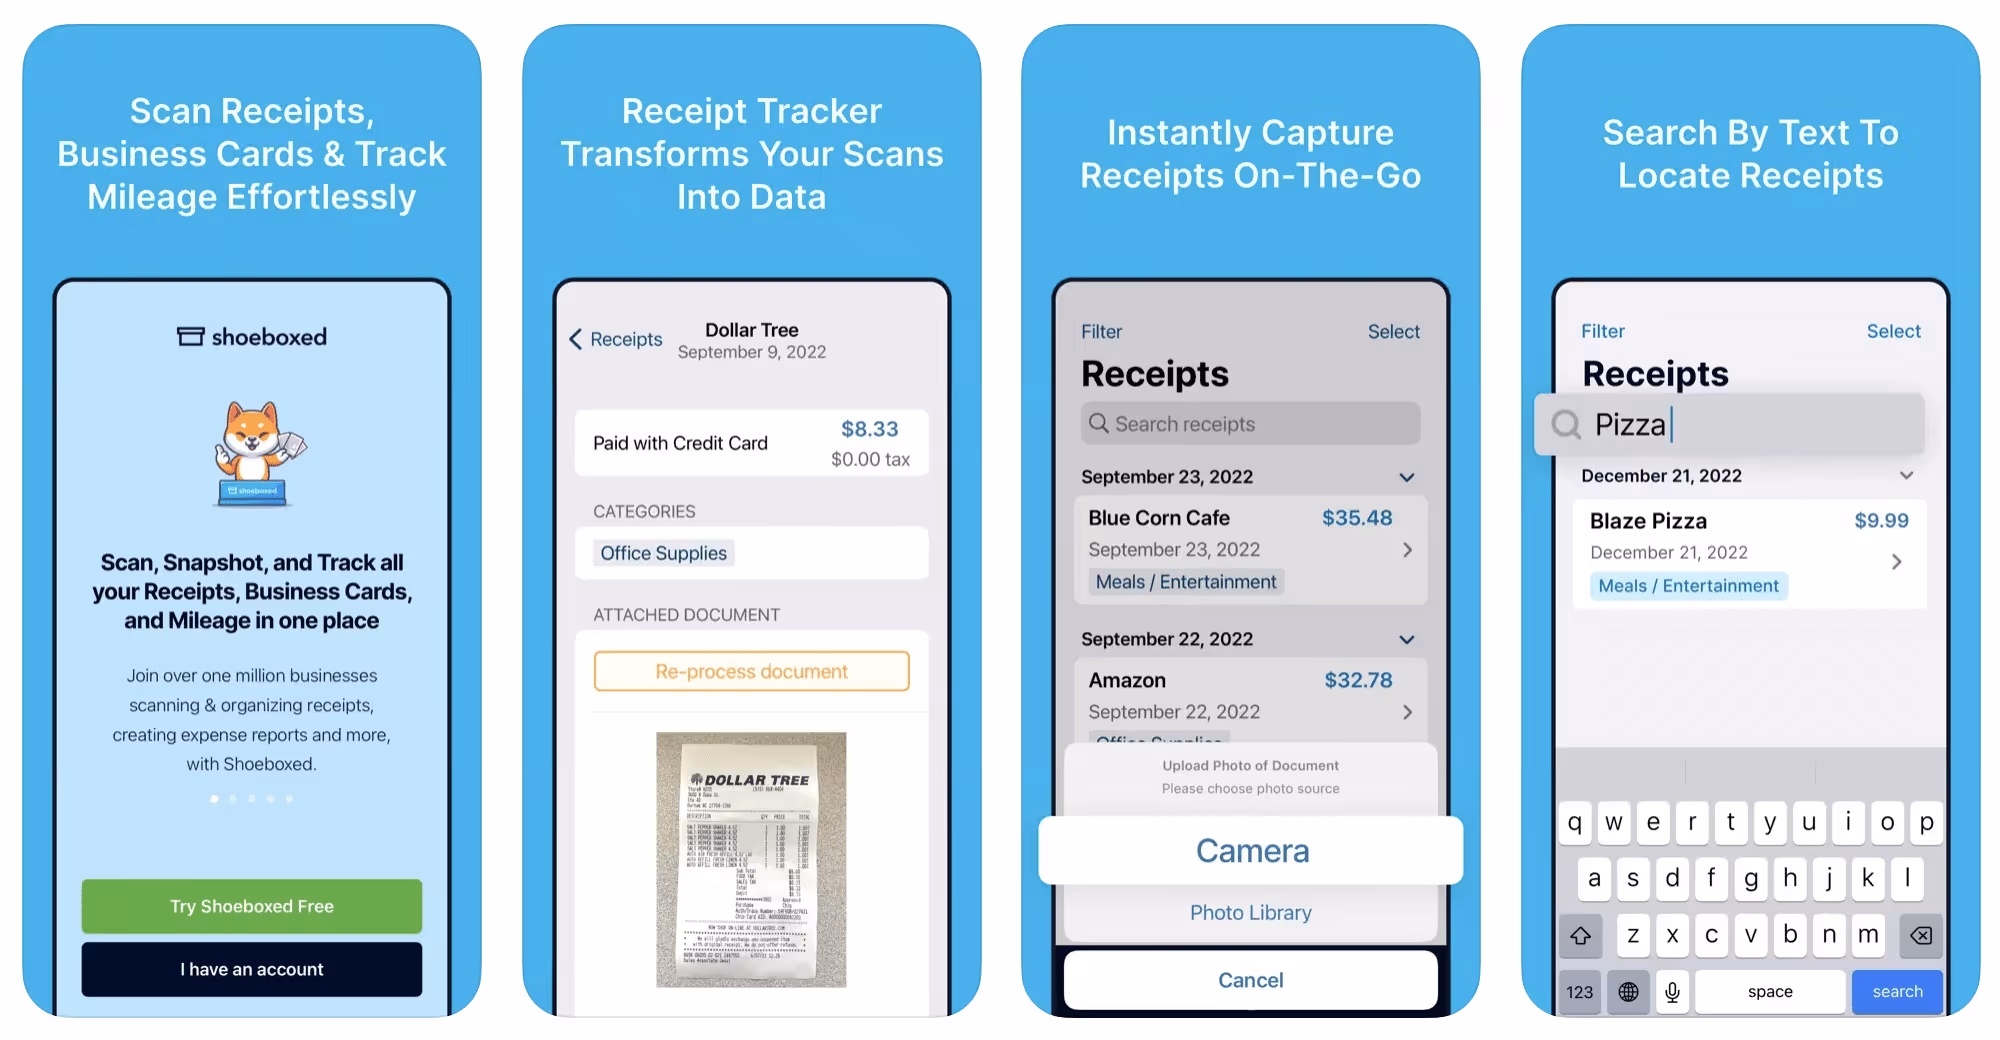
Shoeboxed started in 2007 as a service for scanning paper receipts into digital form. Now the app offers a free mileage tracker and has enabled users to scan receipts directly. It touts itself as the best mileage tracking app for DoorDash, but there are some elements missing that Dashers might like to have. While it provides features that record your expenses and prepare you for tax season, it doesn’t automatically track your earnings. The mileage tracker has a system where you can drop pins along your routes to make the tracking more precise, identifying those legs of a trip that you make for business purposes. The mileage tracker is “free” once you sign up for the basic version.
Available on Android and Apple: Yes
Ratings: 4.5 stars on App Store, 2.3 stars on Google Play
Free version: No
Subscription price: $18 per month for basic version
Created specifically for gig drivers: No
Source: blog.shoeboxed.com
4. Stride
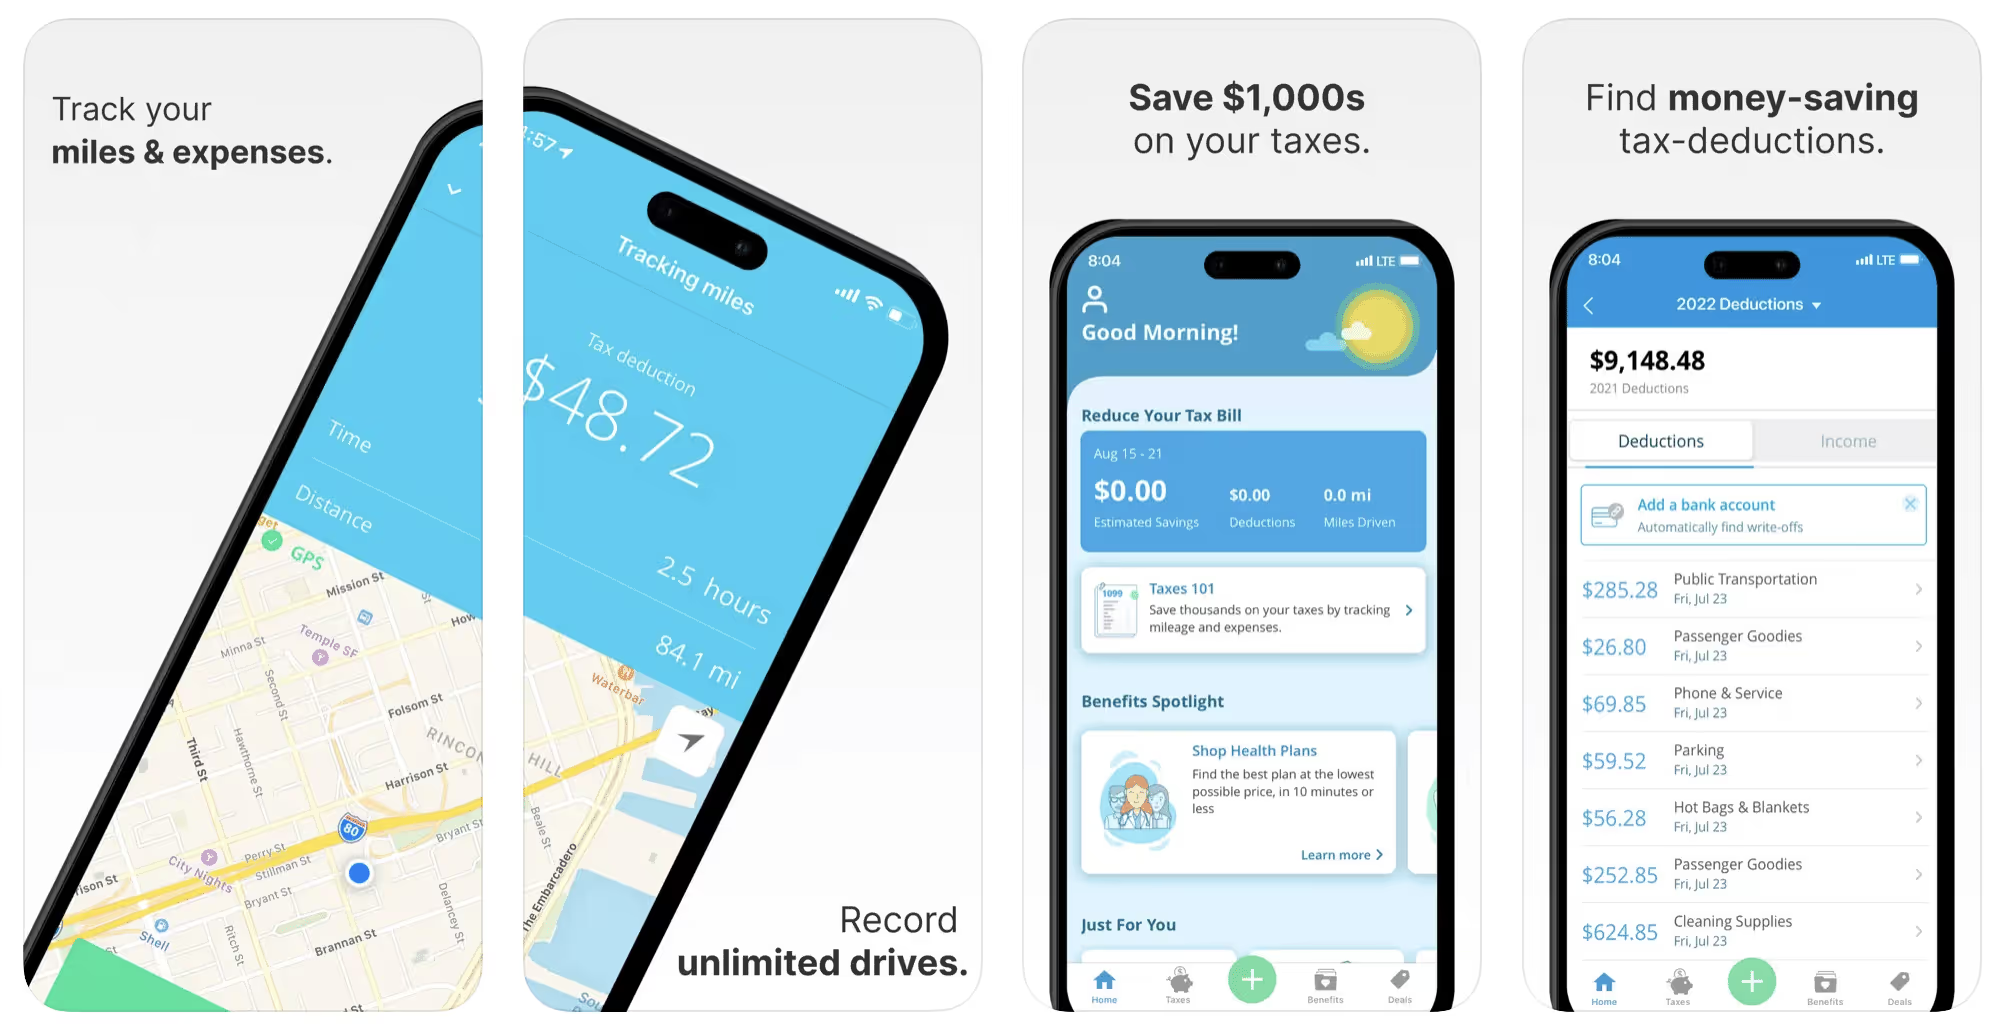
This free mileage tracker does a fair job of keeping track of the distances you rack up while gig driving, but it doesn’t automatically track earnings. It can be a big help, though, in tracking your expenses. You can link Stride to your bank account, and it will automatically scan your expenses to identify items you can potentially deduct. The app is totally free. This could make it the best free mileage tracker app, but there is a small price to pay. The app will persistently push you to consider various insurance plans that they are affiliated with. If you don’t mind that, this is a solid mileage tracker, even if it doesn’t track your earnings.
Available on Android and Apple: Yes
Ratings: 4.8 stars on App Store, 4.6 stars on Google Play
Free version: Yes
Subscription price: None. The app is free.
Created specifically for gig drivers: No
5. Gridwise
Gridwise has a free mileage tracker and free features that record your income and expenses. It gives you access to insurance and benefits, as well as insights about the best times and places to make the most money while gig driving. The Gridwise mileage tracker captures all the miles you drive while you’re on your driving shift, and it can be used if you have other trips you need to make which qualify as business travel.
Drivers love it because it is geared toward the needs of rideshare and delivery workers, providing free information about airport departures and arrivals, event start and let out times, weather, traffic, and more. The Gridwise Plus subscription adds value by providing additional insights and reports, discounts on benefits, the ability to export data in .csv format,, and more.
Available on Android and Apple: Yes
Ratings: 4.9 stars on App Store, 4.6 stars on Google Play
Free version: Yes
Subscription price: $9.95 per month for Gridwise Plus, or $95.99 per year (a $23.41 savings)
Created specifically for gig drivers: Yes!
What is the best mileage tracking app?
Now that we’ve checked them all out, we’re positive about the answer to that. Hands down, it’s Gridwise. Are we biased? You bet we are! But drivers love it too. Gridwise is the best mileage tracker app—and so much more. So many of the features are free, and the subscription to Gridwise Plus will pay for itself with additional insights to boost your earnings and deeper discounts on products and services.
Most important, Gridwise is designed specifically for gig drivers by experts who were once gig drivers themselves! Knowing what gig drivers need is a crucial step in creating an app that rideshare and delivery drivers can really use! Here are a few of the features, besides mileage tracking:
- seamless earnings tracking
- automatic, on/off toggle and manual mileage tracking
- mileage categorization
- airport, traffic, weather, and events information
- insights into where to drive and when to drive
- reports showing earnings across the platforms you use
- discounts on countless products and services for drivers
- additional resources for finding side gigs
- an informative and comprehensive blog
- affordable benefits, including insurance, medical, dental, and alternative practitioner discounts
- a community of drivers just like you
Don’t settle for just any app. Get the best mileage tracker, and so much more, from Gridwise!
[elementor-template id="21599"]

How Are Robotaxis Affecting Driver Pay in AV Cities?
Autonomous vehicles (AVs) aren’t just hype anymore—they’re part of daily rideshare life in a handful of big U.S. markets. And in those places, drivers have been raising concerns: since AVs showed up, many have noticed their earnings slipping.
We wanted to understand if those concerns were reflected in the numbers. Using anonymized and aggregated data, we looked at activity in AV launch markets and compared it to a national baseline. The results line up with what many drivers have already been saying: earnings in AV-active cities are under pressure. While nationwide trends show modest growth, AV markets are moving in the opposite direction.
The impacts don’t look the same everywhere, but the patterns are hard to ignore. In some cities, the drop shows up as lower hourly pay. In others, it’s fewer trips during high-demand periods, shrinking incentive offers or other factors that used to help boost weekly totals.
Ahead, we’ll break down what the numbers show in AV cities versus the national trend, and share practical strategies drivers can test to protect their income.
A quick note on the numbers you’ll see below: they reflect median results across large groups of drivers and are meant to show market-level trends, not any one person’s experience. Your results will vary based on when and where you drive, your app mix, and how quickly you pivot. That’s why we close each section with practical moves—and why we encourage you to lean on your own personalized insights as you test changes week by week.
[elementor-template id="20891"]
When AV services launched in each city
The timing of AV rollouts helps explain why driver earnings look different from city to city. Here’s a quick timeline of when autonomous rideshare started in the major AV markets:
- Phoenix: Waymo began full commercial service on October 8, 2020.
- San Francisco: Waymo expanded operations on June 25, 2024.
- Los Angeles: Waymo service launched on November 12, 2024.
- Austin: Waymo began operating through its Uber partnership on March 4, 2025, followed by Tesla’s limited Cybercab rollout on June 22, 2025
How driver earnings are shifting in AV cities
When you look closer at the numbers, it’s clear that AV markets aren’t following the same earnings trends as the rest of the country. Here’s what stands out:
How much are drivers in AV cities making per ride?
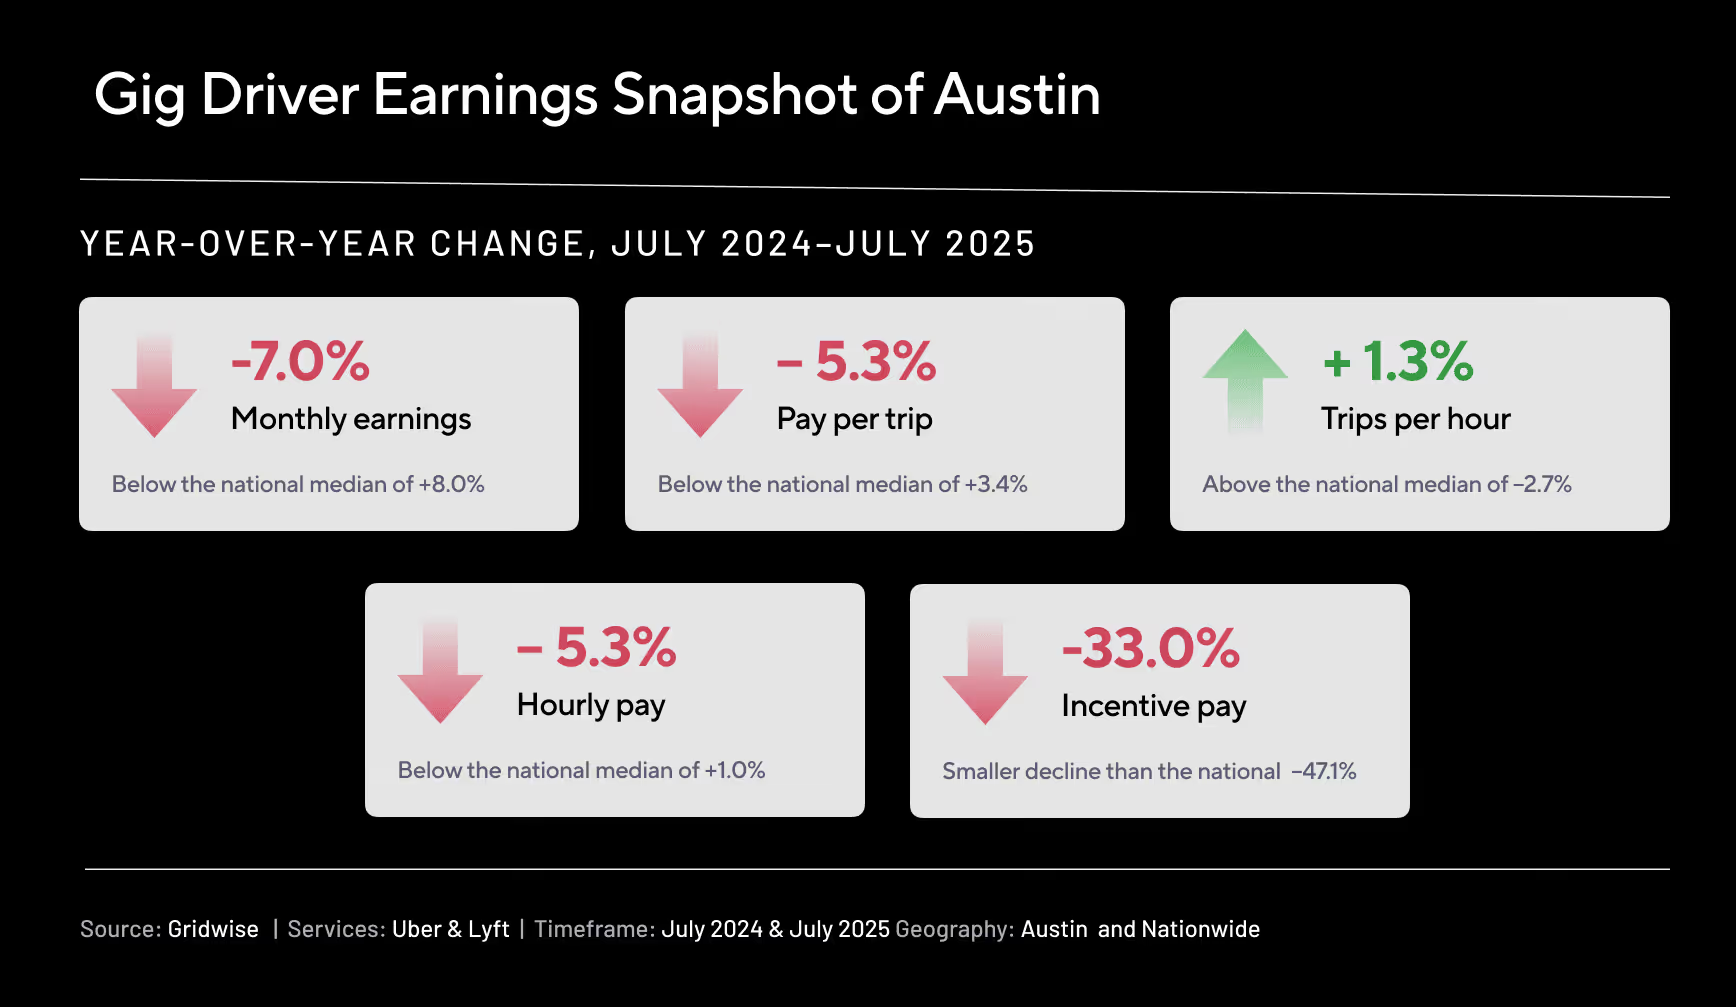
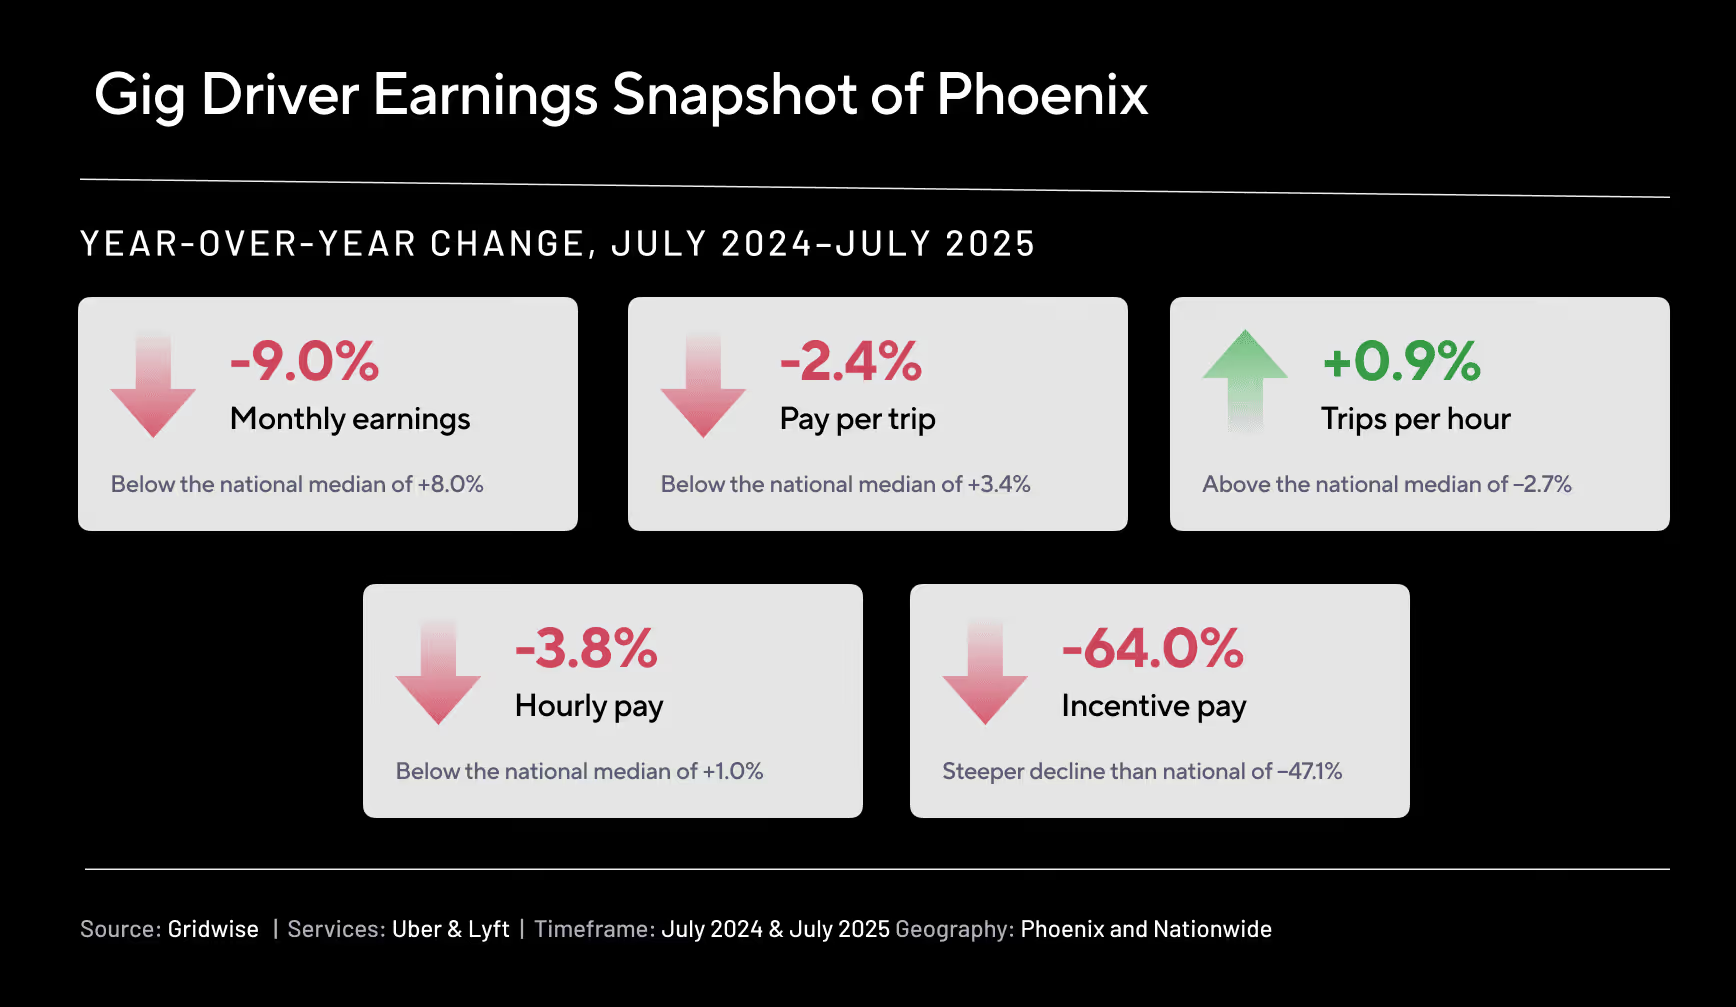
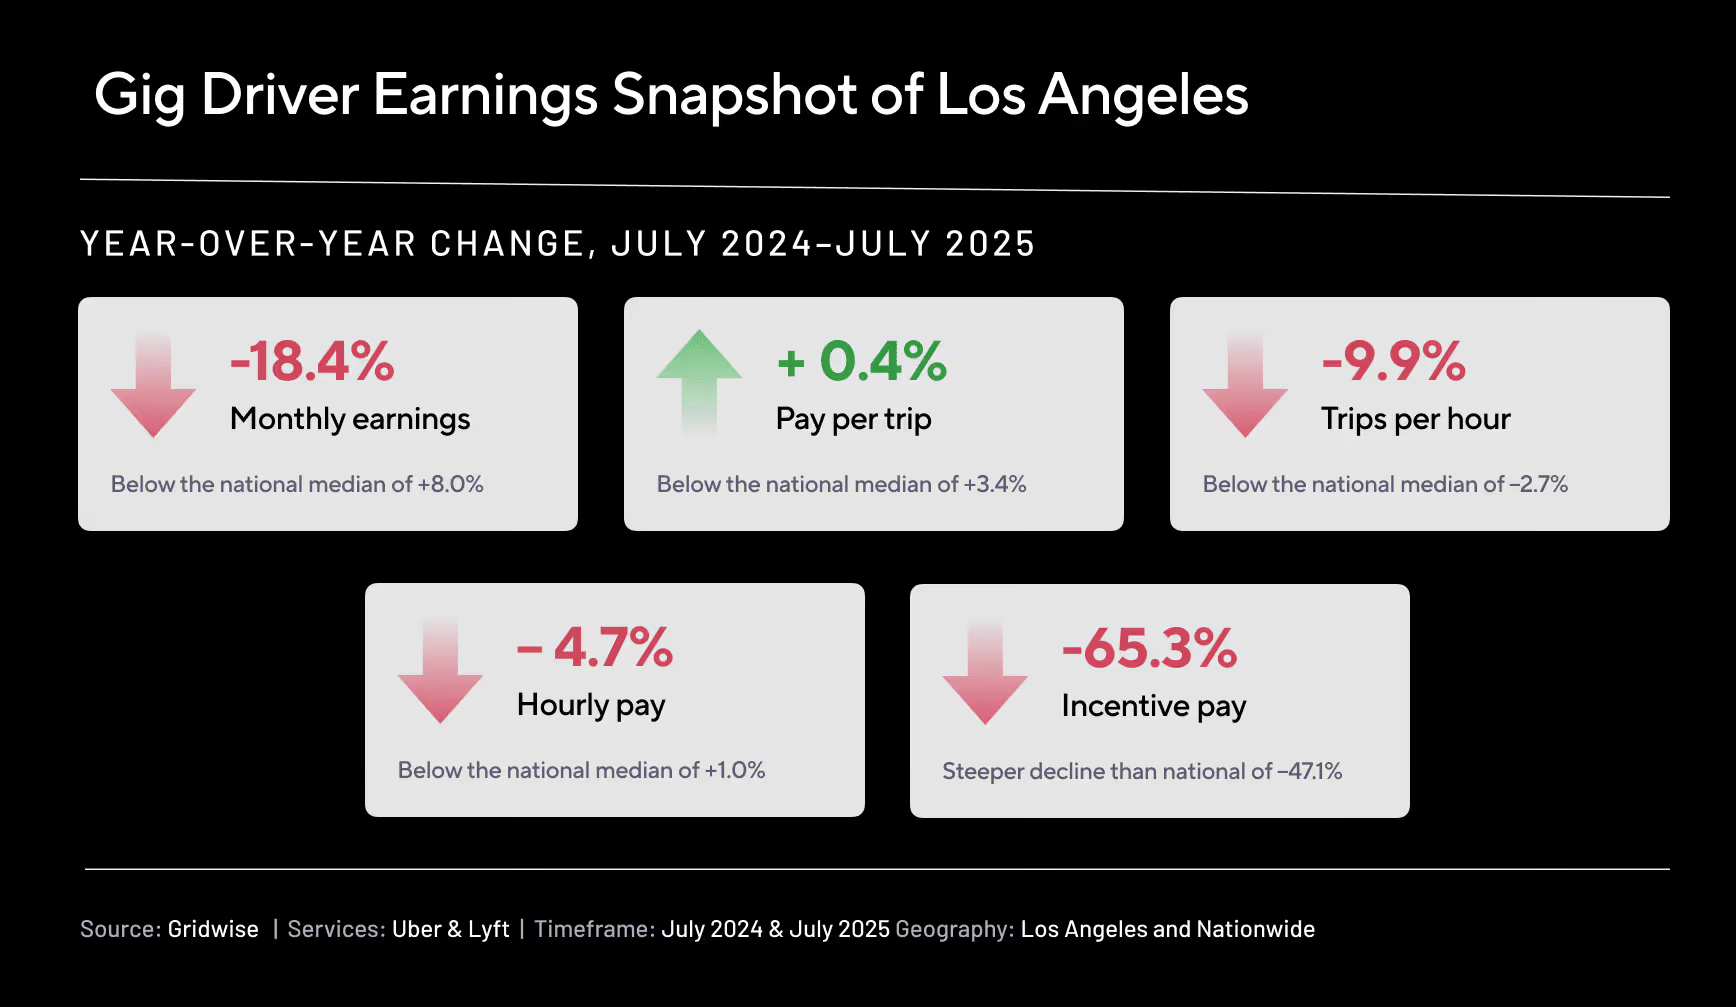
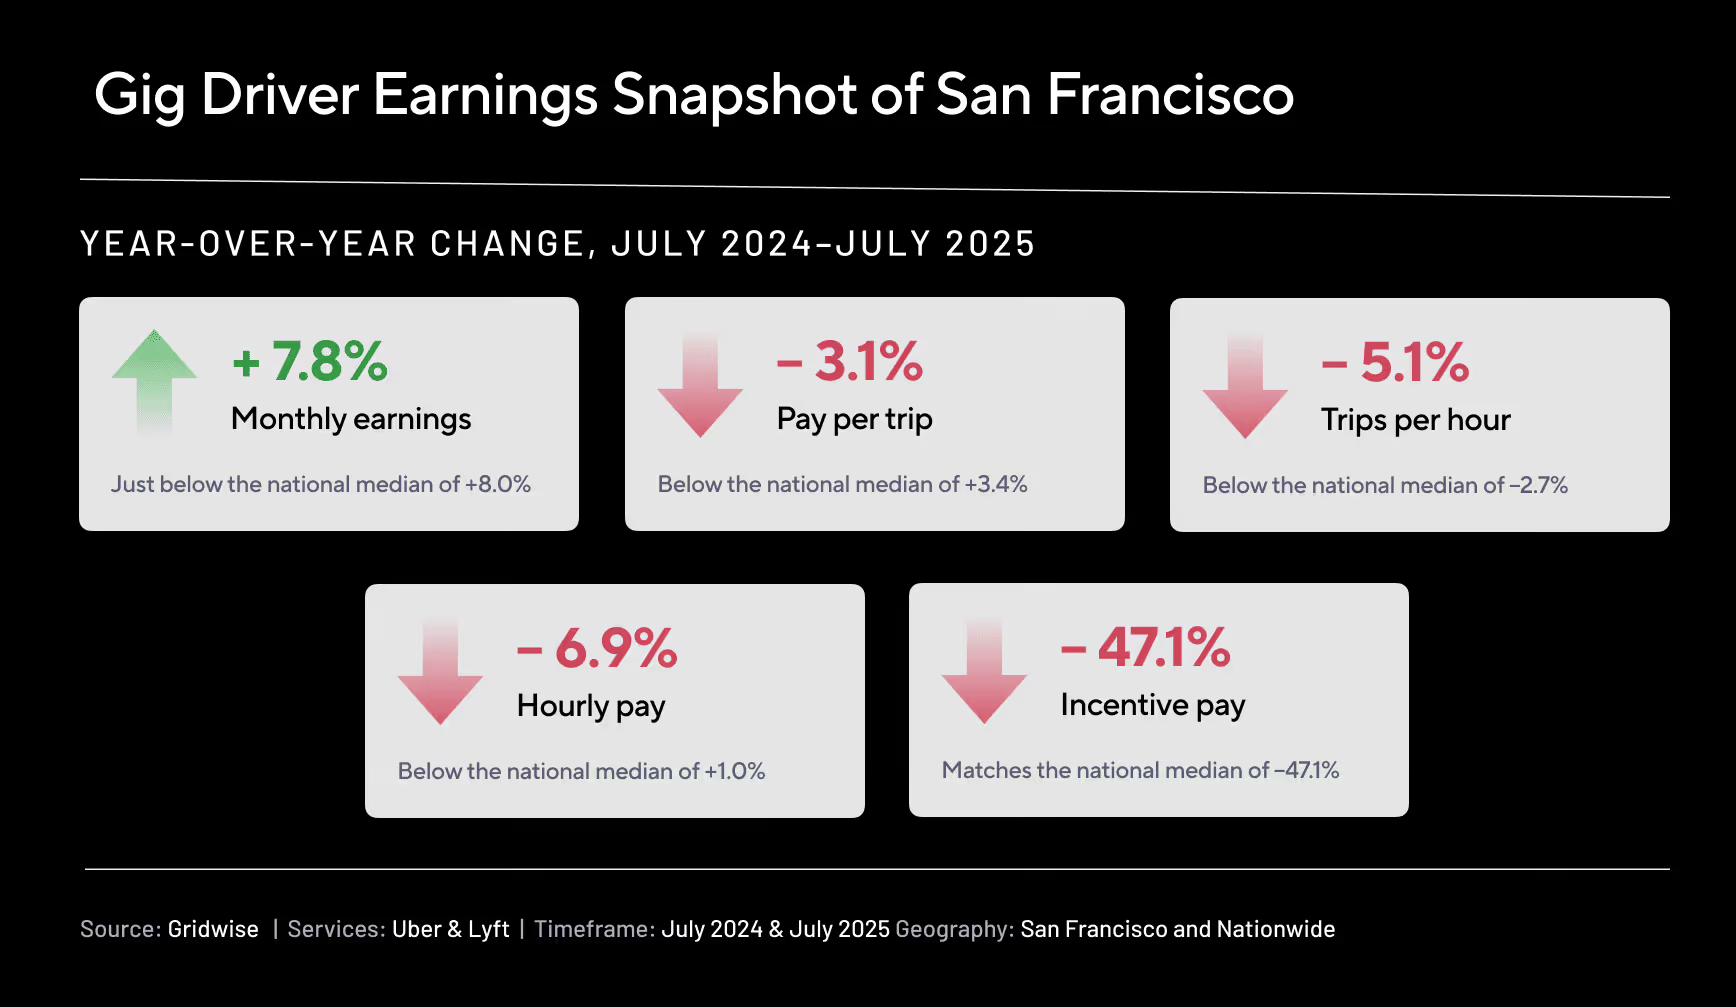
Nationwide, pay per trip rose modestly—up 3.4% year-over-year from July 2024 to July 2025. But AV cities didn’t keep pace. Austin drivers saw a 5.3% drop, San Francisco dipped 3.1%, and Phoenix was down 2.4%. Los Angeles held nearly flat with a slim 0.4% gain.

How much are drivers in AV cities earning per hour?
Hourly pay fell everywhere AVs are active, even as the nationwide average increased by 1.0%. The sharpest declines were in San Francisco (–6.9%) and Austin (–5.3%), with Los Angeles (–4.7%) and Phoenix (–3.8%) also sliding. This means drivers in those cities are making less per hour of work compared to the same time last year.

What’s happening with incentive pay in AV cities?
Platform incentives—things like streaks, quests, or non-trip bonuses—are shrinking nationwide, not just in AV markets. On average, incentive pay per trip fell 47.1% YoY. But the cuts were even deeper in Los Angeles (–65.3%) and Phoenix (–64.0%). San Francisco’s decline matched the national trend, while Austin saw a smaller, though still meaningful, drop of –33.0%. These cuts are happening everywhere, but in some AV cities they’re hitting harder.

What’s happening to monthly earnings in AV cities?
When you zoom out to total monthly pay, the picture is uneven. Los Angeles (–18.4%), Phoenix (–9.0%), and Austin (–7.0%) all saw meaningful declines, while San Francisco actually posted a 7.8% increase—close to the nationwide gain of 8.0%. That increase in San Francisco may come from drivers putting in more hours, since both hourly pay and trips per hour have declined there.

How many trips per hour are drivers in AV cities getting?
Trip volume per hour also shifted in different ways across markets. Austin (+1.3%) and Phoenix (+0.9%) saw small gains, but Los Angeles (–9.9%) and San Francisco (–5.1%) dropped sharply. Nationwide, trips per hour slipped by –2.7%. In LA and San Francisco, fewer rides per hour help explain lower hourly pay. But in Austin and Phoenix, trip counts held steady or even grew—suggesting other factors, like trip length or changes in rider mix, are driving down earnings.

City snapshots: Austin, Phoenix, Los Angeles, San Francisco
Here’s how the four AV cities in our sample are trending right now. These are median year-over-year shifts at the market level, but not a judgment on any one driver. Local events, tourism, weather, app policies, and AV rollout pace all play a role—so use this as context alongside your own week-to-week numbers.
Austin
Per-trip and hourly pay are both down –5.3%, with monthly earnings –7.0%. At the same time, trips per hour +1.3% and utilization +1.3% suggest it’s a bit easier to stay busy. If this matches what you’re seeing, consider leaning into higher-value windows (airports, event nights) so the extra activity translates into stronger hourly.
Phoenix
Median per-trip –2.4%, hourly –3.8%, and monthly –9.0% point to softer pay, even though trips per hour +0.9% and utilization +1.4% nudged up. In practice, that can feel like more pings but slightly thinner rides. Timing your blocks around dinner peaks, weekends, and stadium/concert surges can lift the average ticket without adding long hours.
Los Angeles
LA shows the steepest pullback in this group: monthly –18.4%, with hourly –4.7%, trips per hour –9.9%, and utilization –8.6%. Promos also cooled more than the national trend. That doesn’t mean you’re doing anything wrong—it means conditions are tougher. The best counter is to be selective: focus on high-confidence demand (major events, airport windows) and keep a flexible app mix so you’re parked where base fares are strongest.
San Francisco
SF is mixed: per-trip –3.1% and hourly –6.9%, yet monthly earnings +7.8%. Many drivers appear to be offsetting lower hourly by shifting when (and sometimes how long) they work. If your hourly looks similar, zero in on the blocks that still deliver—then make those your anchors and trim the rest.
Quick reminder: These are market medians, not destinies. Your results can run above or below these lines depending on your hours, zones, and service mix. In the next section, we’ll distill the key takeaways and then share simple, low-lift adjustments you can test this week to protect—and potentially grow—your earnings. We will also show you practical ways the Gridwise app can help.
What this means for drivers in AV cities
We know every driver’s situation is different, and that’s why these strategies are meant as small tests, not rules. Medians are helpful directionally, but they won’t capture every neighborhood, shift pattern, or app mix.
1) AVs are a factor—but not the only one.
Where AVs are active, some metrics have shifted. But promos, seasonality, local events, tourism, weather, and app policy changes all move earnings too. If your city looks different from the national baseline, it’s more about market dynamics than anything drivers are doing wrong.
2) Nationally, the floor looks stable to slightly positive.
Per-trip, hourly, and monthly figures are up overall. That’s reassuring if you’re outside AV hotspots. Still, national averages smooth over local swings—use them as an anchor, then compare them with your own week-to-week results.
3) Incentives are lighter almost everywhere.
If bonuses feel thinner, you’re not imagining it. This goes beyond AV markets. The practical move: plan around base-fare demand you can count on and treat promos as a bonus when they show up.
4) Small strategy shifts can help offset headwinds.
In several AV cities, drivers seem to keep monthly totals steadier by changing when they drive or leaning into higher-value trips. That doesn’t mean working more hours—it means testing different blocks, staging near predictable peaks, or flexing your app mix to find steadier base fares.
5) Medians aren’t your destiny.
These are market-level medians. Your results can outperform them—especially if your schedule, zones, and app mix line up with local demand. Personalized insights will always be more powerful than national or city-level averages.
Your action plan: put this to work in your city
Here’s how to make the numbers practical. Think of these as small weekly experiments—keep what works in your city, and drop what doesn’t. Remember: these are medians and market trends, not verdicts on your performance.
1) Test one time block each week
Pick two windows you can actually drive (for example, Friday 6–9 p.m. vs. Tuesday 4–7 p.m.) and run each once. Then open Insights → My Trends to compare earnings per hour and trips per hour. Keep the winner next week and replace the loser with a new challenger. Over a few weeks, your schedule shifts toward the hours that pay you best.
2) Build around demand you can predict
When ride flow feels slow, proximity matters. Plan one shift around a major event or an airport bank. Gridwise surfaces Events and Airport signals so you can arrive early, stage just outside congestion, and chain rides while the wave lasts. If When to Drive is available in your market, layer that in to fine-tune start times—then confirm what worked in your Trends.
3) Nudge up your average fare
If per-trip pay has flattened, favor longer, higher-value trips (airports, weekend evenings, big venues). In My Trends, track average trip length alongside per-trip earnings by day and time. When a window reliably produces stronger trips from a certain zone, make it an anchor.
4) Let base pay guide your app choice
With incentives lighter, steady base fares matter more. In your best block, open Insights → Compare Services and filter to that day/time. Compare Uber, Lyft, and delivery by earnings per hour, per trip, and trip volume—then run the app that wins for that block. Quick promo check: bonus ÷ required trips. If the “extra per trip” is small and the window overlaps weak hours in My Trends, skip it.
5) Keep more of what you make
Turn on automatic mileage tracking in the Gridwise app so every mile is logged, including between trips. Record routine expenses like tolls, parking, and car washes as you go. Cleaner records help at tax time and protect your take-home when promos are thin. (For individual tax advice, consult a professional.)
Your weekly testing routine using Gridwise
- Early week: Connect services (if you haven’t), enable mileage, and set a realistic weekly earnings goal.
- Midweek: Run your two test blocks; check My Trends and keep the winner.
- Weekend: Add one Event or Airport window; arrive early and stage smartly.
- Sunday: Use Compare Services to pick the lead app for next week’s best block, lock in one reliable block, pick one new challenger, and log any missed expenses.
Final thoughts
We know earnings aren’t just numbers—they affect your day-to-day and your ability to plan ahead. Nationally, the data points to steady or slightly positive earnings overall, but drivers in AV cities are facing more mixed results and reduced incentives. And because these are medians, it’s natural that your week might look very different.
The best approach is to focus on what you can control. Pay attention to your own trends, try small adjustments, and keep the ones that make a difference for your hourly pay. Gridwise is here to help by showing you how different services compare, helping you plan around events and airports, and tracking miles and expenses so your take-home stays strong. Even small steps—like testing two changes this week and reviewing them on Sunday—can help ease some of the pressure and put more control back in your hands.
We also know AVs add another layer of uncertainty, and that’s why we’ll keep sharing what the data shows—so you’re never left guessing.

How Much Do Lyft Drivers Make in 2026? ($22.45/hr — 1B+ Trips Tracked)
If you’re wondering how much do Lyft drivers make in 2025, you’re not alone. With rising costs, evolving demand, and ongoing changes in gig economy platforms, it’s more important than ever for drivers to understand what their time on the road is really worth.
Lyft offers flexible earning opportunities—but how much you take home depends on several factors, including your location, driving schedule, ride volume, and expenses. In this post, we’ll break down the most recent earnings data, including average pay per hour, per mile, and per week. We’ll also explore the real costs of driving, the impact of bonuses and tips, and smart strategies for making the most of your time behind the wheel.
Whether you’re a full-time driver or dashing between side hustles, this guide will help you assess your earnings and find ways to work smarter—not harder—in 2025.
[elementor-template id="20891"]
How much do Lyft drivers earn per week in 2024?
Lyft drivers earn an average of $318 per week in 2024, which is noticeably lower than Uber. This could be due to fewer ride requests or shorter distances per ride compared to Uber, leading to reduced overall earnings.
How much do Lyft drivers earn per hour in 2024?
In terms of hourly wages, Lyft drivers make $23.23 per hour on average. This places them close to Uber drivers in terms of hourly pay, but their lower weekly earnings indicate that they may be working fewer hours or receiving fewer ride requests.
How much do Lyft drivers earn per mile in 2024?
Lyft drivers earn approximately $1.03 per mile, which is slightly higher than Uber’s per-mile rate. This could mean that Lyft drivers tend to have shorter, higher-paying rides compared to Uber drivers, or that Lyft’s pricing structure favors per-mile earnings more.
These numbers suggest that Lyft drivers are making comparable hourly rates to Uber drivers, though their weekly totals are lower, possibly due to fewer active hours or reduced trip frequency. On a per-mile basis, Lyft drivers earn slightly more than Uber drivers, which may reflect a different trip mix or pricing structure.
As with all gig work, these averages vary widely by market, driver availability, and overall platform demand.
Gross vs. Net: Understanding Real Income For Lyft Drivers
Your gross pay—the amount Lyft reports as your earnings—isn’t the same as your take-home pay. Net income factors in your operational expenses, which can reduce what you actually keep by 25–40%.
While $23.23/hour is the reported average for Lyft drivers, real profitability depends on how efficiently you manage time, costs, and trip strategy. Drivers who track their data, schedule smarter, and optimize expenses generally keep more of what they earn.
Expenses That Affect Lyft Driver Net Pay
Lyft drivers, like other gig workers, cover all their own vehicle-related costs. These include:
- Fuel – Often the largest weekly expense. Costs depend on mileage and vehicle efficiency.
- Maintenance – Oil changes, tire rotations, and unexpected repairs.
- Insurance – Lyft provides coverage while on a trip, but rideshare-specific insurance helps cover the app-on/no-passenger period.
- Depreciation – High mileage lowers the value of your car over time.
- Cleaning – Keeping your vehicle clean improves ratings and tips.
- Phone and data – Essential for navigating and staying connected with passengers and the app.
Tools like Gridwise make it easier to monitor and manage these costs over time, giving you a better understanding of your true take-home pay.
Do Location and Market Demand Affect Lyft Driver Earnings?
Where you drive significantly impacts how much you can earn.
For example, drivers in dense metro areas like San Francisco, Washington D.C., or Boston tend to see more ride requests, higher fares, and more surge pricing. Meanwhile, drivers in suburban or less populated areas may experience slower ride frequency, though they may also face less competition.
Gridwise’s market insights can help drivers determine the most profitable areas and compare trends across cities.
Factors That Impact Lyft Driver Income
Several factors affect how much Lyft drivers earn in any given shift:
- Time of day: Rush hours, late nights, and weekends typically see the most demand.
- Surge pricing (Prime Time): When demand outweighs driver supply, fares increase. Strategic driving during these windows can significantly boost earnings.
- Acceptance rate & cancellations: While Lyft states that declining requests doesn’t directly impact earnings, high cancellation rates can lead to deactivation or missed bonuses.
- Incentives & bonuses: Lyft often offers bonus pay for completing a certain number of rides or driving during peak times.
Using Gridwise’s “When to Drive” feature, drivers can identify optimal times to log in, helping them make the most of every hour.
[elementor-template id="20949"]
Mileage and Ride Volume
Lyft drivers’ earnings also depend on how many rides they complete and how far they drive.
- Full-time drivers often complete between 50–80 rides per week, averaging 800–1,000 miles.
- Part-time drivers may drive 300–600 miles and complete 25–40 rides weekly.
Each market has a different ride density, which influences how much time is spent driving with a passenger versus waiting for the next trip. Gridwise’s trip logs and mileage tracking can provide insight into this balance when it comes to your income and expenses.
Lyft’s Commission and Fees
Lyft uses an upfront pricing model. Passengers see a flat fare, but drivers are paid based on time and distance estimates. Lyft then deducts its platform fee and any applicable service charges.
Typically, drivers can expect Lyft to take about 20–25% of each fare as a service fee, though this may vary depending on promotions, markets, and ride types.
It’s helpful to review trip breakdowns and track earnings over time using a third-party dashboard like Gridwise to better understand how much you're keeping per trip.
Staying Tax-Ready*
As independent contractors, Lyft drivers are responsible for their own taxes. This means tracking income, mileage, and expenses throughout the year—not just at tax time.
In 2024, the IRS mileage deduction was $0.67 per mile. That adds up quickly for high-mileage drivers and can significantly reduce taxable income. To make tax time easier:
- Use an app like Gridwise to track every mile.
- Log all work-related expenses (fuel, maintenance, supplies).
- Set aside 25–30% of your earnings for taxes.
The Gridwise app also helps drivers to stay ready by providing real-time demand insights, automatic mileage tracking, and personalized earnings reports—so you’re always equipped to make smarter decisions on the road.
Insurance for Lyft Drivers
Lyft provides liability and contingent coverage when you're on a trip or on the way to pick up a passenger. However, there's a gap in coverage when you're logged into the app but haven't accepted a ride.
That’s where rideshare insurance comes in. It bridges that gap and typically costs an additional $20–$50 per month, depending on your provider. It’s worth speaking with your insurer to make sure you’re fully covered.
Vehicle Choice and Operating Costs
The type of car you drive plays a huge role in your overall profitability.
Look for vehicles that are:
- Fuel efficient – Hybrids or EVs can cut your gas costs in half.
- Low maintenance – Some brands/models are cheaper to repair.
- Comfortable and spacious – This boosts ratings and makes longer trips more pleasant for you and your riders.
Drivers with the right vehicle setup often keep a larger share of their earnings after expenses.
How Gridwise Helps Lyft Drivers
- When to Drive: Know the best times to go online—no more wasted hours.
- Where to Drive: Find hotspots and high-demand zones—no more aimless driving.
- Mileage Tracking
Log every mile automatically—no more missed deductions. - Airport Demand: See real-time flight volume and queue length—no more long waits without rides.
- Earnings Across Apps: Track Lyft, Uber, and others in one place—no more switching tabs to see your totals.
- Event Alerts: Stay informed about concerts and local events—no more missed peak earnings.
- Expense Tracking: Monitor costs in-app—no more guessing at tax time.
Final Thoughts on Lyft Driver Earnings in 2025
Lyft continues to offer flexible earning opportunities for drivers in 2025, with competitive hourly pay and room to grow depending on where and when you drive. Weekly earnings may vary, but drivers who track their data, optimize their schedules, and understand their expenses tend to come out ahead.
With tools like Gridwise, drivers gain access to the insights needed to make smarter decisions, maximize profits, and stay in control of their rideshare business—whether you're driving a few hours a week or treating it like a full-time job.
[elementor-template id="21599"]
* Disclaimer: Gridwise is not a tax advisor, accounting firm, or financial institution. Any tax-related information provided in this article is for general informational purposes only and should not be considered professional tax advice. We strongly recommend consulting a licensed tax professional or accountant for guidance specific to your situation.
More about your success in the gig economy:
- The best times to drive for Lyft
- The Gridwise Job board
- Increase Your Earnings in 2024! How to Make $1000 per Week With Uber
- How Much Do Uber Drivers Make?
- How Much Do DoorDash Drivers Make?
- Everything You Need to Know About Amazon Flex
- Walmart Spark Delivery Driver Pay: How Much Does a Walmart Spark Driver Make?
- How Much Can You Make on Instacart?
- How Much Do Shipt Shoppers Make?
- How Much Do Uber Eats Drivers Make?

Revealing Rideshare Trends: Multi-Apping and Airport Insights
Long wait times and higher fares are two of the most common reasons passengers switch between rideshare services. A recent passenger experience at LAX illustrates this point:
“We needed a larger vehicle for our rideshare,” he said, “which I knew would cost more. I checked both platforms. There was a 30% price differential between services. The distance I was going came to more than $60. I didn’t have to think twice about going to the less expensive service.”
Rideshare companies can use gig mobility data from Gridwise Analytics to address these challenges and optimize their operations. Our data provides insights into
- multi-apping trends among gig drivers
- airport-specific pricing patterns at major airports like ATL, JFK, LAX, and ORD
- comparisons between pickup and drop-off rides
- how these factors influence passenger satisfaction
Whether you're a rideshare company executive, an investor, or simply curious about the gig mobility industry, this blog delves into how Gridwise Analytics can impact gig company strategies in today's competitive market.
[elementor-template id="20891"]
Multi-apping trends: Insights from gig driver analytics
Multi-apping is the widespread gig driver practice of accepting rides from more than one gig platform. Drivers choose to multi-app based on personal preferences and money-making strategies.
Some gig drivers multi-app between rideshare services (e.g., Lyft drivers will also take Uber rides, and Uber drivers will also take Lyft rides). Other drivers multi-app between categories, such as rideshare drivers accepting food delivery orders during peak hours for that activity and then moving into rideshare in the later hours of the evening.
What percentage of gig drivers multi-app?
Data insights reveal that a sizable percentage of gig drivers from all major platforms engage in multi-apping.
Although the percentage of drivers from Lyft and Uber who multi-app is constantly changing, a distinct pattern of more Uber drivers engaging in the practice prevailed—until early 2023, when Lyft drivers started to multi-app more frequently. By Q4 2023, more than 55% of Lyft drivers multi-apped, as opposed to about 50% of Uber drivers.
Data has also revealed that over 60% of Uber Eats and Shipt gig drivers multi-apped. In the case of Uber Eats, drivers often multi-app because they can easily transition from one service to another on the app. A driver for one of the Uber services can also drive for the other without additional applications or requirements; working for both Uber and Uber Eats can be done from the same app on the gig drivers’ side. Multi-apping through other services, however, requires that the driver have multiple apps open, which can be complicated to manage.
Multi-apping rates between Lyft and Uber
In 2019 we saw that around 10% more Lyft drivers were multi-apping than Uber drivers. This percentage changed drastically in Q1 2022 when analysis showed Lyft drivers started to multi-app with even greater frequency. The number of Uber drivers that multi-apped dropped by more than 10% at the start of 2022. As of Q1 2024, Lyft rideshare drivers were multi-apping with the Uber platform at about 55%, while Uber drivers were multi-apping on the Lyft platform at a rate of just over 25%.
Airport-specific rideshare trends and pricing patterns
Airport rideshare activity presents unique challenges and opportunities for both drivers and companies. Our analysis of gig driver data from four major US airports—ATL (Atlanta), JFK (New York City), LAX (Los Angeles), and ORD (Chicago O'Hare)—reveals distinct patterns in pricing, profitability, and driver incentives.
These insights, drawn from Q4 2023 data with some projections into 2024, highlight the complex dynamics of airport rideshare services and their impact on both driver and passenger experiences.
Airport trip bonus insights
A review of Uber rideshare activity during Q4 2023 revealed that JFK airport has the highest fares for pickups and drop-offs. The only time frame when JFK fares approached equality with other airports was at night, from 9 pm to 6 am. O’Hare Airport in Chicago edged out LAX for the lowest rates.
In 2024, we see new ranges and patterns changing as the year progresses. Our granular, unbiased data allows us to predict future patterns based on years of market insights. Contact our team here.
A review of bonus activity during Q1 2023 at the same airports revealed that Lyft pays higher bonuses per trip on airport pickup and drop-off rides than Uber.
We can speculate that Lyft’s motivation for paying these higher bonuses is to increase driver loyalty, thus guaranteeing a more reliable pool of drivers to reduce their passenger average pickup time. When passenger pickup time is reduced, we can hypothesize that this results in a higher passenger satisfaction rate and could correlate to passenger loyalty.
Airport take rate insights
“Take rate” refers to the difference between what the passenger pays for the ride and what is left for the rideshare company after they pay the driver, plus any fees or other charges associated with the ride (some airports now charge a fee for every rideshare drop-off or pickup, which gets added to the passenger’s rideshare charge).
JFK pickup and drop-off take rate insights
Drop-offs were more profitable than pickups at all the airports reviewed, but JFK showed the widest variation between pickup and drop-off fares in Q4 2023. The average take rate at JFK was 28.4%.
LAX pickup and drop-off take rate insights
While showing less variance than JFK, LAX also had a bigger difference between pickups and drop-offs than other airports. Afternoons between 12 pm and 6pm during this time have a higher take rate.
O’Hare pickup and drop-off rate insights
O’Hare in Chicago shows more equity between pickup and drop-off activity. Pickups and drop-offs have similar take rates in the morning (6 am to 12 pm) and early afternoon (12 pm to 3 pm), with a slight difference of about two percentage points. Differentials are highest between 3 pm and early morning hours.
The best take rates are in the morning and early afternoon, averaging 35.7%.
Atlanta pickup and drop-off take rate insights
Rideshare pickups are more profitable in Atlanta than in other airports, with mornings and early afternoons showing the greatest profitability. Drop-off rides also exhibited higher profitability in Atlanta than in other airports.
Rideshare pickups are more profitable in Atlanta than in other airports, with mornings and early afternoons showing the greatest profitability. Drop-off rides also exhibited higher profitability in Atlanta than in other airports.
Would you like to learn more about the gig driver economy? Our 2024 Gridwise Gig Mobility Report offers numerous insights and data on gig workers, rideshare, food delivery, and other facets of the gig economy.
The impact of airport rideshare insights on passenger experience
1. Pricing and cost efficiency
Analytics show that airport rides often have variable pricing depending on the time of day and location. For example, JFK Airport has the highest fares for pickups and drop-offs, particularly outside night hours, whereas O’Hare in Chicago has the lowest rates.
Understanding these trends allows rideshare companies to adjust their pricing strategies to offer more competitive rates, which can attract cost-sensitive passengers.
2. Wait times and service availability
Competitive bonuses per trip for airport rides could ensure a more reliable pool of drivers. This strategy can lead to shorter wait times for passengers, enhancing their overall experience.
Many drivers engage in multi-apping, leading to longer passenger wait times if drivers regularly switch between platforms. Gig companies can ensure consistent service availability by addressing multi-apping through better incentives and loyalty programs.
3. Profitability and service quality
The profitability of pickups and drop-offs varies by airport. For instance, Atlanta shows the highest pickup profits, while JFK exhibits the widest variation between pickup and drop-off fares. By understanding these profitability trends, rideshare companies can optimize their operations to ensure high-quality service where it is most needed, thereby improving passenger satisfaction.
4. Tailored bonuses
Different airports exhibit unique patterns and can benefit from location-specific strategies. LAX, for instance, has higher take rates in the afternoons, while O’Hare shows more equity between pickup and drop-off activity in the mornings and early afternoons.
Tailoring bonuses and surge pricing to these trends can help rideshare companies more effectively meet passenger expectations by ensuring they have sufficient driver supply.
5. Predictive analytics
Granular, unbiased data allows companies to predict future patterns based on historical insights. This predictive capability enables rideshare companies to prepare for and meet passenger demands efficiently, ensuring a smoother and more satisfactory experience.
By leveraging these insights from gig driver analytics, rideshare companies can make informed decisions that enhance pricing strategies, reduce wait times, improve service quality, and tailor their offerings to specific airport trends, contributing to higher passenger satisfaction.
The value of granular data and unbiased insights for rideshare platforms
Passengers will continue to evolve into more savvy users of their rideshare services. Rideshare passengers are well aware of surge pricing and often take steps to avoid those extra surcharges. They can compare prices from providers within seconds.
Through careful analysis of this data, rideshare companies can develop pricing strategies and bonus structures that attract passengers and keep drivers happy and loyal to their platform. By developing strategies based on real-world driver data, gig platforms have the potential to improve their profit margins sustainably.
Gridwise Analytics: An unbiased source of comprehensive gig economy insights
Rideshare and delivery are highly competitive services. Passengers can quickly compare prices and wait times on their phones and select companies based on arrival time or cost. Gridwise Analytics insights give companies reliable data for making decisions that allow them to retain highly competent and loyal drivers and determine pricing strategies that passengers find attractive and economical.
Have a look at these articles to discover further insights:

How a Cash Advance Can Boost Your Gig Business
This post is brought to you by Ualett.
Being your own boss comes with incredible freedom. You get to choose your hours, decide where you work, and have full control over how much you want to earn. But running your own gig business also means staying on top of expenses, planning ahead, and keeping your income as consistent as possible.
Sometimes you need extra resources to keep your business moving forward. An unexpected expense, such as a flat tire, a broken phone, or a sudden repair, can bring your gig work to a halt and lead to a drop in income. Or you might be looking to invest in better tools that can help increase your earnings. In either case, having access to fast and flexible cash can make all the difference.
That is where Ualett comes in. Ualett (pronounced “Wallet”) is a financial platform built specifically for gig workers and micro-businesses. With fast cash advances, no credit checks, and a user-friendly mobile app, Ualett helps you stay in control of your gig work and get ahead financially.
[elementor-template id="20891"]
Why Cash Flow Matters for Gig Workers
Unlike traditional jobs, gig work does not come with a predictable paycheck. You get paid based on how much you work and when. That kind of flexibility is great for setting your own schedule, but it also means you need to manage your cash flow carefully.
Here are some common reasons why drivers might need quick access to funds:
- Paying for unexpected vehicle repairs
- Covering gas costs during a slower week
- Replacing or upgrading delivery gear
- Managing personal expenses between pay periods
- Taking advantage of surge pricing or bonus opportunities that require upfront costs
When you do not have the funds you need to work, you are not just covering costs but potentially losing income. Having access to a short-term cash advance can help you stay active on the road and prevent disruptions to your earnings.
How Ualett Helps Drivers Take Control
Ualett was designed with gig workers in mind. Unlike traditional loans or credit cards, Ualett offers a flexible and supportive way to get cash when you need it, without jumping through hoops or dealing with high interest rates.
Here is how Ualett works:
- Quick and easy sign-up: The process takes just minutes through their mobile app.
- Fast funding: Get access to cash in less than 24 hours, helping you get back to work quickly.
- No credit checks: Your eligibility is based on your work, not your credit score.
- Flexible remittance schedule: Ualett’s remittance system adapts to your gig earnings, so you are not stuck with a rigid schedule.
- Trusted by gig workers: Over 300,000 drivers across the United States already use Ualett.
This is not just a cash advance app. It is a financial tool built specifically for how you work and earn in the gig economy. You can explore more about how Ualett supports gig workers here.
Smart Ways to Use a Cash Advance
Using a cash advance wisely can help you grow your business, not just cover shortfalls. Here are a few smart strategies drivers use:
- Fix urgent vehicle issues quickly: Staying off the road means missing out on income. A cash advance lets you get back to driving faster.
- Fuel up before high-demand hours: Need gas to work during a big event or surge? Get ahead of the rush without waiting for your next payout.
- Buy or replace delivery essentials: Whether it is a new phone mount, thermal bag, or portable charger, small gear investments can lead to better ratings and tips.
- Plan for high-earning days: Use the cash to ensure you are ready to take advantage of holidays, major events, or peak weekends when earnings can be much higher.
A cash advance can be part of a larger strategy to make more money, especially when paired with smart planning and the right tools.
Real Stories and Trusted Results
Ualett is not just a new idea in financial services. It is already trusted by a large community of gig workers across the country. They also have an outstanding 4.9 rating on Trustpilot and thousands of reviews.
On their blog, Ualett shares real stories from drivers who used their cash advances to stay in business and boost their income. For example, in the article “Real Stories, Real Impact: How Ualett Helps Rideshare Drivers Overcome Financial Hurdles”, rideshare drivers from Orlando discuss how Ualett provided them with fast, reliable cash advances during times of financial strain, enabling them to continue working and supporting their families.
Another piece, “How Gig Workers Keep Las Vegas Running”, highlights the essential role gig workers play in the city's economy and how Ualett's financial solutions have been instrumental in helping them navigate the unique challenges of their work.
These stories are not uncommon. Ualett was created specifically for situations like this. They understand the ups and downs of gig work and offer a solution that fits the rhythm of your business.
Combining Ualett and Gridwise for Long-Term Success
A cash advance can be a powerful tool, but combining it with the right data and planning makes it even more valuable.
Here is how Gridwise can help you maximize the impact of your Ualett advance:
- Track your income and expenses: Know exactly how much you can request and remit without stress.
- Plan your schedule with “When to Drive”: Focus on high-earning hours to get the most out of your investment.
- Compare performance across platforms: Know which app is delivering the best results so you can plan your shifts strategically.
Monitor your trends: Get insights into your long-term earnings and find ways to increase efficiency.
Together, Ualett and Gridwise give you both the financial flexibility and the strategic insights you need to grow your income and stay in control.
Final Thoughts
Access to cash when you need it can be the difference between losing a weekend of work and making your best week yet. With Ualett, gig workers have a fast, flexible, and trusted way to bridge gaps, make smart investments, and stay on the road.
If you are looking for a way to smooth out your income and keep your gig business running strong, Ualett can help. And when you pair it with the power of Gridwise, you are not just surviving the gig economy—you are thriving in it.
Ready to take control of your earnings?
Explore Ualett to see how a cash advance can support your business.

How Much Do Instawork Workers Make in 2025?
Instawork is a growing platform that connects hourly workers with shifts in hospitality, events, warehouses, and more. It appeals to those looking for flexible, on-demand jobs—but the big question for most people is: how much can you really earn?
[elementor-template id="20891"]
According to Indeed, Instawork workers earn hourly wages ranging from $12.41 for roles like Food Runner to $31.67 for Site Manager, with specific examples such as Prep Cook at $17.66/hour and Bartender at $19.95/hour
Instawork promotes itself as a way to earn up to $25/hour or more, and many experienced users do hit those numbers—especially in roles requiring specialized skills or weekend availability.
How Instawork’s Pay Model Works
Instawork isn’t a delivery or rideshare platform—it focuses on matching flexible workers to shifts in hospitality, warehouse, and light industrial work.
Here's how it works:
- Workers browse and claim shifts posted by businesses
- Pay is listed upfront for each shift (typically hourly)
- Workers are paid direct deposit or Instant Pay (with a small fee)
- You are treated as an independent contractor, responsible for your own taxes and expenses
Unlike gig platforms that rely on tips or dynamic pricing, Instawork jobs offer fixed hourly pay. This can be an advantage if you prefer consistent, predictable earnings.
What Affects Instawork Earnings
Your earnings on Instawork aren’t just about availability. Several other factors can influence your take-home pay:
Location
Instawork operates in over 40 cities across the U.S., including major metros like Los Angeles, New York, Houston, Atlanta, and Chicago. Areas with higher demand for hospitality and warehouse work generally offer more shifts and higher hourly rates.
Job Type
Pay varies based on the nature of the work. For example, basic warehouse support may pay $15/hour, while bartending, event staff, or forklift operation may pay $20–$25/hour.
Shift Availability
Being available for early mornings, weekends, or overnight shifts can unlock higher-paying opportunities. Businesses often increase pay to attract workers during off-hours or on short notice.
Experience and Ratings
Workers with a high average rating and good shift-completion history are more likely to get access to premium or exclusive gigs. Some businesses prioritize workers who’ve completed jobs with them before.
Types of Jobs and Pay Differences
Instawork covers a range of industries, and the type of shift you take has a big impact on your pay. Here are a few examples:
Job TypeTypical Pay RangeFood Runner/Busser$14–$16/hourBartender/Server$18–$25/hourWarehouse Associate$15–$18/hourForklift Operator$20–$25/hourLine Cook or Prep Cook$16–$22/hourEvent Setup Crew$17–$20/hour
Picking up roles that match your skill set—or that require certifications—can increase your hourly earnings.
Tracking Your Hours and Expenses
While Instawork provides in-app access to past shifts and pay, you’re responsible for managing your finances, taxes, and mileage if applicable (for example, if you drive to job sites).
Using a tool like Gridwise helps you:
- Track total earnings across jobs and weeks
- Monitor expenses like mileage, parking, or gear
- Organize your income for quarterly and annual taxes
- Compare Instawork earnings with other gig platforms you may use
This becomes especially helpful if you’re working across multiple job types or apps and want to see where you’re making the most money per hour.
[elementor-template id="20949"]
Disclaimer: Gridwise is not a tax advisor or financial institution. Please consult a tax professional for personalized advice.
Maximizing Earnings with Smart Scheduling
To increase your Instawork income, you need more than just availability—you need strategy. Here’s what experienced workers recommend:
- Claim shifts early. New shifts drop daily. Set alerts and check frequently.
- Build a good rating. Show up on time, follow instructions, and finish your shifts. A strong profile can unlock better-paying gigs.
Target high-demand roles. Skills like bartending, cooking, forklift operation, or AV tech often come with higher hourly rates. - Work peak periods. Holidays, weekends, and event seasons (like summer festivals) tend to bring in the most jobs.
- Track trends. Use Gridwise to analyze your performance by job type, day of week, or even location.
The more informed your approach, the more consistent your earnings.
Final Thoughts on Making Instawork Work for You
Instawork offers a flexible, scalable way to earn income—especially if you prefer hourly work over task-based apps like rideshare or delivery. In 2025, average pay sits around $17–$18/hour, with room to grow based on experience, availability, and role type.
Whether you’re working part-time or building a full schedule, your success depends on treating gig work like a business. That means showing up professionally, tracking your metrics, and finding the right shifts for your goals.
[elementor-template id="20936"]
Wondering how much other gig platforms pay?
- How To Make $1000 A Week With DoorDash
- Increase Your Earnings in 2024! How to Make $1000 per Week With Uber
- How Much Do Uber Drivers Make?
- How Much Do Lyft Drivers Make?
- Everything You Need to Know About Amazon Flex
- Walmart Spark Delivery Driver Pay: How Much Does a Walmart Spark Driver Make?
- How Much Can You Make on Instacart?
- How Much Do Shipt Shoppers Make?
- How Much Do Uber Eats Drivers Make?
- Check out the Gridwise Job Board

Multi-Apping’s Role in Pay and Platform Power
The gig economy has evolved far beyond single-platform loyalty. Today's most successful drivers strategically navigate multiple platforms, maximizing earnings through what industry insiders call "multi-apping." According to Gridwise Analytics data spanning January 2024 to December 2024, this practice has become a defining characteristic of the modern gig workforce, with profound implications for both drivers and the platforms competing for their attention.
The data reveals a compelling narrative: drivers who embrace multi-apping consistently earn more in total per week than their single-platform counterparts. At the same time, specific platforms have emerged as common denominators among drivers who multi-app. Understanding these dynamics is crucial for platform operators, investors, and anyone seeking to comprehend the strategic forces reshaping gig work.
[elementor-template id="20891"]
Multi-Apping Leads to Higher Pay
It’s no surprise that drivers switch between apps to increase their earnings, but what’s It’s no surprise that drivers switch between apps to increase their earnings, but what’s striking is how effectively they do it. Gridwise Analytics data confirms that multi-apping isn’t just common, it works. Drivers who diversify across platforms earn more, and the specific combination of services they use can shape how much that income grows.
The data reveals two key dynamics:
- Earnings rise steadily with each additional app used
- Platform-specific patterns influence how those earnings scale
Together, these insights show that drivers don’t just multi-app to stay busy, they do it strategically to grow their income of course.

Multi-Apping Helps Drivers Earn More, But the Data Tells a Deeper Story
At first glance, the chart below shows that earnings rise neatly as drivers add more apps. And that’s true—to a point. Weekly pay increases as drivers transition from using one service to two, then three, and eventually four or more. But what’s happening behind the scenes is more nuanced than a clean step-by-step climb.
The bars for each app—Uber, Lyft, DoorDash, and others—don’t represent entirely separate groups of drivers. Instead, they often include the same drivers counted multiple times, just grouped differently depending on the number of platforms they used that week.
Here’s what that means:
- A driver who used Uber and Lyft in a week is inc luded in both the “Uber + 1” and “Lyft + 1” bars.
- If that same driver adds DoorDash to their rotation, they show up again in the “Uber + 2,” “Lyft + 2,” and “DoorDash + 2” categories.
- By the time we reach the “4+ apps” group, most drivers are included in nearly every bar, because working 4 or more out of the 6 listed apps means you're showing up in at least four of the bars.
So while the data shows that drivers who work across multiple apps earn more, that convergence in the “4+” tier doesn’t mean the platforms themselves are paying more equally—it just reflects that we’re mostly seeing the same high-earning drivers across each platform’s data.
In short, this isn’t a story of platform pay leveling out. It’s a story about the power of diversification, how the most active, strategic drivers stack opportunities across multiple apps to reach higher total earnings. What we’re seeing is less about parity between platforms and more about how a small, ambitious subset of drivers is pushing their income ceiling by showing up everywhere.
How Drivers Combine Apps to Earn More
The multi-app landscape reveals distinct patterns of platform affinity and strategic positioning. Gridwise Analytics data shows which platform drivers are most likely to combine, creating a map of the gig economy's interconnected ecosystem.

Uber's Central Position in the Multi-App Economy
Uber emerges as the most connected platform in the multi-app ecosystem. Lyft drivers show the highest cross-platform usage rate, with 49% also working for Uber — the most substantial single-platform overlap in the multi-app ecosystem. Uber Eats drivers also frequently pair with Uber (36%), and Instacart drivers show a notable 20% overlap with Uber Eats. There are many other services who multi-app with Uber Eats.
This positioning reflects Uber's strategic advantage as a multi-modal platform. Drivers can seamlessly transition between rideshare and delivery services within the same ecosystem, reducing friction and maximizing utilization. The data suggests that Uber has successfully created platform gravity, attracting drivers from competing services into its broader ecosystem.
DoorDash's Isolation Challenge
In contrast, DoorDash drivers exhibit low multi-hopping rates compared to other major platforms. Only 18% of DoorDash drivers also work for Uber Eats, and just 4% work for multiple apps, including Uber, Grubhub, or Instacart. This relative isolation may reflect DoorDash's market dominance in food delivery, where drivers can achieve sufficient earnings without needing to combine platforms.
However, this isolation also represents a strategic vulnerability. If DoorDash drivers begin seeking additional income sources or flexibility, they may gravitate toward other platforms.
Peak Hours Drive Multi-App Strategy
The timing of multi-apping reveals sophisticated driver strategies that align with demand patterns across different services. Gridwise Analytics data shows how multi-apping behavior fluctuates throughout the day, peaking during high-demand periods. This highlights how drivers actively balance platforms to maximize earnings during lunch, dinner, and rush-hour rideshare windows. The data reveals distinct patterns across platforms.

Rideshare Drivers Earn More Than Delivery Drivers
The earnings advantage seen in multi-apping is also reflected in the underlying economics of individual services. As shown in the table below, rideshare platforms like Uber and Lyft consistently offer higher weekly gross earnings than food and package delivery platforms, even when drivers aren't multi-apping.

Chart from Gridwise Analytics 2025 Annual Gig Mobility Report
For drivers who don’t or can’t multi-app aggressively, platform selection alone can significantly impact earning potential. Rideshare’s higher revenue per hour and per mile provides a natural earnings floor, a key factor in driver strategy, especially in markets with fewer multi-app options.
Retention Dynamics: Long-Term Platform Loyalty in a Multi-App World
While multi-apping drives higher earnings, platform retention remains a critical factor for long-term driver engagement. Gridwise Analytics data reveals significant differences in how platforms retain drivers over extended periods.
Rideshare Platform Retention Patterns
While both Uber and Lyft start with strong initial retention, the gap widens over time. By month 11 of a driver’s tenure with the service, Uber retains 33% of its drivers compared to Lyft’s 25%, a modest but meaningful edge. Still, the broader picture is clear: long-term retention across ridesharing remains low, highlighting ongoing challenges in driver engagement and platform loyalty.

Delivery Platform Retention Patterns
The delivery sector shows even more pronounced retention differences. Gridwise Analytics data tracking cohorts from January to April 2024 reveals distinct performance patterns across major delivery platforms.
Instacart emerges as the retention leader, maintaining 41% of drivers after 11 months. This superior retention likely reflects the platform's focus on grocery delivery, which offers more predictable demand patterns and higher average order values compared to restaurant delivery.
Grubhub follows with 32% retention, while DoorDash and Uber Eats show lower retention rates at 20% and 18%, respectively. These differences highlight the importance of platform design, compensation structure, and market positioning in maintaining long-term driver engagement.

Data-Driven Insights for Strategic Decision Making
Gridwise Analytics provides the operational intelligence necessary to comprehend the competitive landscape of a multi-app economy. From revealing how platform stacking boosts driver earnings to identifying where retention strategies succeed or falter, our data surfaces the trends that matter most to operators and investors. As gig platforms vie for loyalty in an increasingly fluid landscape, insights into driver behavior, peak-time strategies, and cross-platform affinities are crucial for driving growth, enhancing retention, and establishing a long-term strategic advantage.
If you want to learn how these insights can inform your platform strategy and retention efforts, connect with our team.

Maximize Your Earnings Effortlessly With Play Octopus
Do you find it’s getting harder to earn the kind of money you used to rake in as a rideshare driver? There’s no question that the robust fares, huge bonuses, and tantalizing surge pay are less plentiful than they once were. Now you have to hustle hard to make a living with Uber, Lyft, and other rideshare services. Meanwhile, your personal and business expenses keep rising, making life a hassle and a hustle.
[elementor-template id="20891"]
What can you do to keep your earnings at the levels you once enjoyed?
The answer to that might not be as complicated as you think. It’s true that you can’t reduce the take rates of the driving apps you use. It’s not possible to get companies to raise their fares when you like, and you can’t suddenly manifest high-tipping customers out of thin air, either. Getting yet another side hustle isn’t the most attractive option, given that it’s always nice to have some time left in your life to do things that don’t involve work.
What if you could have passive income—the kind of earning power that doesn’t require your full participation? What if you could have that source of passive income with you, right there in your vehicle, while you continue to drive for your gig? What if you could make a lot more money with a lot less hustle?
Engage and entertain your riders while scooping up extra earnings
All these things are possible, thanks to Play Octopus, an interactive experience for your passengers to enjoy. You get a FREE tablet that mounts on the back of your front seat, so your passengers in the back seat can be informed and entertained with interactive games, unique information, premium videos, and prizes. Your riders will be happily occupied with content that’s curated just for Uber and Lyft passengers, while you sit back, keep driving, and make more money!
How does Play Octopus helps you to earn more?
- Driving with passengers who are occupied with Octopus earns you points. The more you drive, the more money you make. Most drivers earn up to $50–$75 per month with Play Octopus. Others have brought in as much as $100 and even more. Passive income makes earning extra money as a rideshare driver so easy. To help get you started, Play Octopus gives you a $25 bonus once you start to drive with your tablet!
- When your passengers enjoy engaging with Play Octopus, you get extra tips. What they see and hear is sure to spark a convo that gets a few chuckles going between you. After your mutually pleasant connection, your customers just have to go a little deeper into their pockets to give nice, fat gratuities to their new friend—you!
- Refer your friends to Play Octopus and collect a $25 fee for each new driver.
Does Play Octopus have any costs attached?
Play Octopus is available nationwide and doesn’t cost you a cent. You get the tablet for free, and receive LTE data from T-Mobile to keep it connected at no charge. Mounting and charging equipment are also included in the package. What happens if you want to move on from your gig? If you ever decide to stop rideshare driving, and can no longer use the tablet, you simply return it, free of any fees.
To qualify, all you need to do is be a rideshare driver who’s been driving for at least two months, averaging at least 100 rides per month. Most active drivers easily qualify and can start making more money with almost no effort—right away!
Play Octopus is popular and lucrative. T-Mobile recently acquired Play Octopus, and this world-class service enables Play Octopus to offer a huge wealth of games, content, and clients to draw on. You can count on Play Octopus as a source of extra income that requires no extra work from you, well into the future!
Get started with Play Octopus
- Join the community of more than 60,000 Play Octopus drivers
- Earn extra money while you drive
- Get bigger tips
- Receive higher ratings
- Make friends with your customers
- Join a robust driver community
- Enjoy exclusive events and driver-only giveaways
Ready to apply for Play Octopus?
Simply fill out this application, and you’ll be on your way toward the kind of earnings that rideshare drivers deserve. Bring the good old days of well-paid rideshare back with Play Octopus.

Grubhub’s Crossroads: A Look at Delivery Performance and Platform Resilience
Grubhub enters 2025 as a steady presence in a volatile industry. While it hasn’t matched some competitors' headline growth or diversification, it closed 2024 with a stable market share, an increasingly base-heavy pay structure, and a clear commitment to food delivery as its core.
However, trip-level data tells a deeper story that reveals how those strategic choices shaped driver engagement, earnings patterns, and consumer behavior across food, grocery, and retail segments.
This analysis is based on Gridwise Analytics ' anonymized trip and earnings data. Unlike company reports focusing on order volume, user growth, or high-level financials, Gridwise Analytics data tracks how changes land on the road: how much drivers are earning, how long they’re working, and how shifts in platform policy impact both sides of the marketplace.
It’s a ground-level look at Grubhub’s operational model and its choices for investors, gig economy partners, and the future of delivery logistics.
[elementor-template id="20891"]
Holding Steady in a Race for Scale
Grubhub’s market share stayed at approximately 3% throughout 2024, according to Gridwise Analytics' delivery trip data. While that figure trails behind DoorDash at 67% and Uber Eats at 30%, it also highlights Grubhub’s consistent presence in a highly competitive market.

Grubhub continues to serve a meaningful volume of food delivery orders, particularly in core metro markets. For partners and investors, this sustained foothold points to a platform that remains operationally focused and strategically stable.
A Category Specialist in a World of Generalists
Between 2023 and 2024, Grubhub’s delivery mix remained 96–97% food. Grocery and retail deliveries accounted for a small portion of the total volume.

While DoorDash and Uber Eats expanded their delivery mix to include grocery and retail, Grubhub’s streamlined focus offers operational clarity and category leadership in food. This specialization may allow for more refined logistics and consistent merchant support.
How Grubhub Drivers Are Hitting Higher Weekly Totals
In 2024, Grubhub drivers earned an average of $175 per week, up 6.6% year-over-year, a more substantial earnings increase than Uber Eats, Instacart, or DoorDash.
However, this figure is more notable in how Grubhub drivers achieved this. Grubhub drivers worked more hours on average, logging 12.4 hours per week, a 13% increase from 2023, the highest year-over-year jump in work hours across all major food delivery platforms. This is despite small per-mile and hourly earnings declines.

The data tells a clear story: Grubhub’s gross earnings growth is volume-driven, not incentive-driven. Rather than relying on higher tips or bonuses, drivers are putting in more hours and likely accepting more trips to increase weekly totals. The platform’s growing emphasis on base pay suggests that Grubhub is building toward a more reliable, steady-income delivery model.
For partners and investors, that has implications: a supply base that leans into platform consistency may also offer greater predictability in availability, shift planning, and fulfillment, even if peak-time efficiency is slightly lower than on bonus-heavy platforms.
How Grubhub’s Pay Model Stacks Up Across Delivery Types
Grubhub has increasingly leaned into a pay model emphasizing stability through base pay, particularly in segments like grocery and retail, where competition intensifies and earnings structures vary significantly. Gridwise Analytics data reveals how Grubhub's compensation mix evolved in 2024 and how it compares to other platforms.
Retail Delivery: Industry-Leading Base Pay, Leaner Incentives
Grubhub led all major platforms in base pay for retail deliveries in 2024, with 73% of driver earnings coming from base rates, up from 66% the year before. That’s a full seven percentage point gain year-over-year, well ahead of peers like Uber Eats (65%) and Instacart (47%).
However, that increase came with tradeoffs. Tips made up just 25% of retail delivery earnings, one of the lowest among primary services.
Bonuses dropped from 7% in 2023 to 2% in 2024, reflecting a reduced emphasis on variable incentives.
This signals a clear strategic shift: Grubhub is actively reshaping its retail delivery model to prioritize consistent, guaranteed income over short-term earnings boosts. This could appeal to drivers seeking steadier paydays and partners looking for a more predictable supply base in a segment that often fluctuates with seasonal and promotional demand.

Grocery Delivery:
Grubhub also made significant changes in its grocery delivery earnings structure. In 2024, 59% of driver pay in grocery came from base rates, up from 46% in 2023, a 13-point increase year-over-year.
Spark still leads the category with 68% base pay share compared to peers. DoorDash comes in at 54%, and Uber Eats trails at 57%
At the same time, Tips on Grubhub dropped from 43% to 35%, and bonuses reduced from 11% to 6%
Grubhub’s approach to grocery shopping mirrors its retail strategy, emphasizing stable, fixed earnings while gradually reducing reliance on bonuses and rider tips. Grubhub aims to create a more predictable earnings experience for drivers by shifting a larger portion of compensation to base pay.

Food Delivery:
Grubhub’s food delivery segment, still the core of its business, saw less dramatic change in 2024. Base pay edged up slightly, from 43% to 45%. Tips remained strong at 51%, showing continued customer engagement. Bonuses declined from 6% to 4%.
This stability positions Grubhub closely alongside DoorDash (44% base) and Uber Eats (45% base), but still behind Spark, which leads the segment at 63% base pay.

Grubhub’s food model remains competitive and balanced, holding steady in both earnings mix and driver engagement. This steady structure suggests that Grubhub is reinforcing, rather than reinventing, its core category. It prioritizes operational continuity and driver trust in the segment that maintains the most significant brand recognition and order volume.
Toward Predictability, With Tradeoffs
Across all three segments, Grubhub is evolving toward predictable, base-heavy pay. Retail and grocery saw the most significant shifts, with double-digit gains in fixed earnings. At the same time, bonuses and tips shrank, which may reduce peak-time incentives for some drivers, especially those who value short-term spikes in pay.
This move signals a more sustainable and controlled earnings model for investors, partners, and operators. It’s a strategic choice to stabilize workforce engagement, but one that may require future refinements to ensure it remains competitive in attracting flexible supply.
Drivers on the Move
Grubhub had the highest multi-apping rate among major platforms, according to Gridwise Analytics shift data. Over 70% of its drivers used another app within the same month.

Multi-apping is a common practice across the gig economy and reflects driver flexibility. This trend may suggest that many Grubhub drivers engage with multiple platforms to optimize their earning potential.
The Value Equation: How Price and Perks Shape Loyalty
What keeps a food delivery customer coming back and what sends them elsewhere? New survey data reveals the factors that shape loyalty, the tipping points that lead to churn, and how tightly price influences behavior.
What Drives Food Delivery App Loyalty?
The Gridwise Analytics 2025 Consumer Survey shows that lower delivery fees are the top reason users stay loyal to a food delivery app, followed closely by access to promotions and rewards. Speed also plays a role, with nearly half of the respondents citing faster delivery times as a key factor, along with restaurant variety. In contrast, elements like app design or usability had a much smaller influence on retention.

Why Food Delivery Consumers Switch Platforms
When users leave one app for another, price remains the most significant reason. More than half of the surveyed consumers said they switched platforms in 2024 due to better fees or pricing. Restaurant selection was the second most common reason, followed by loyalty programs. Fewer than one in five users switched based on the app experience, suggesting cost and convenience outweigh branding or UX.

Price Sensitivity Remains a Limiting Factor Among Food Delivery Consumers
While delivery is a routine convenience for many, rising fees still pose a significant risk to usage. According to the survey, 88.1% of consumers said they would cook at home more often if delivery became more expensive or slower. Half said they would switch to pickup to save money, while only 30.4% would continue using delivery services based on convenience alone.
These responses highlight a narrow margin for pricing flexibility and suggest that even modest cost increases could reduce order volume across platforms.

What this means for Grubhub: Consumer Expectations Are Evolving
Looking at the survey results, one thing becomes clear: today’s delivery users are highly value-driven. They choose platforms based on price, rewards, speed, and restaurant access, and they’ll readily switch or churn if those expectations aren’t met.
Looking Ahead: A Stable Platform in a Rapidly Shifting Market
Grubhub’s 2024 strategy emphasized consistency: a focused service offering, a predictable base-pay model, and operational steadiness in a volatile industry. Rather than chase aggressive diversification, the platform leaned into structure, particularly in compensating food, grocery, and retail drivers.
At the same time, industry pressures are growing. Consumers remain highly price-sensitive, drivers continue to multi-app to maximize earnings, and merchants seek more flexibility and transparency. In this context, Grubhub’s approach stands out not for rapid growth but for maintaining its position through measured decisions.
Gridwise’s trip-level data brings these trends into focus. It offers a ground-level view of how strategy shows up in earnings, hours, and user behavior, and where Grubhub may need to adapt as the market moves forward.
Work smarter. Earn more.
Whether you drive, deliver, or pick up shifts — Gridwise helps you track earnings, mileage, and performance so you stay in control of your work. Download the app and take charge today.
