Gridwise blog
Tips, insights, and advice to help you earn more and work smarter, whether you do gig work, hourly, or shift work.
How to Make $1,000 a Week With Uber Eats in 2026 (Tips + Hourly Data)
In this blog, we'll explore the strategies and techniques that can show you how to earn $1000 per week as an Uber Eats delivery driver. We'll cover everything from optimizing your delivery zones and schedules to maximizing your tips and customer satisfaction. Whether you're a seasoned Uber Eats driver or just starting out, this guide will provide you with the insights and actionable steps to take your Uber Eats driver earnings to the next level.
Becoming an Uber Eats delivery partner can be a lucrative opportunity, especially if you're able to consistently earn $1000 a week. By understanding the platform, optimizing your delivery strategies, and focusing on customer satisfaction, you can maximize your earnings and turn Uber Eats into a reliable source of income.
We’ll cover the following topics to provide coaching and ideas to help you push your earnings up to that $1000 per week level:
[elementor-template id="20891"]
What do Uber Eats drivers do?
Uber Eats drivers deliver prepared food most of the time, but they also might shop for and deliver goods from convenience outlets and grocery stores. The job is pretty simple. You get a request for an order, you drive to the restaurant or store to pick it up, and then you deliver it to the customer. If you already drive for Uber, you can choose to take orders for Uber Eats delivery any time.
If you’re not an Uber Eats driver yet, it’s pretty easy to become one. This Gridwise post tells you what you need to do if you want to sign up and start making money Uber Eats style. Many rideshare drivers welcome the chance to deliver food rather than people. This article from Nerdwallet covers the Uber Eats gig from that angle.
There are some sweet advantages to working with Uber Eats. In lots of cities you don’t even need to have a car. You can use a bike or a scooter, or even walk, to make your rounds. If you do use a car, Uber Eats’ requirements are a lot easier to meet than they are for Uber rideshare driving.
You also have a lot of flexibility. You can shop and deliver convenience items and groceries, but you don’t have to. And, like most driving gigs, you can choose your own hours, and map out the locations where you want to work.
Use Gridwise features When to Drive and Where to Drive to help you figure out what work hours and which specific areas will be the most profitable for you. Real data from real delivery people will show you earning patterns for drivers in your town.
[elementor-template id="20949"]
How much can you earn doing Uber Eats?
The honest answer to this question is: basically, as much as you want! It all depends on how many hours you put in and how strategic you are about your gig. Earnings vary from one area to another, as this article from Entrepreneur points out. To give you a baseline, let’s look at the earnings of Uber Eats drivers who tracked their earnings with Gridwise.
Remember that these numbers show us only average earnings. To make $1,000 a week with Uber Eats, you’re going to have to be better than average, and we’ll show you how. For now, though, it’s good to have these figures so you get a ballpark number of where to start.
How much do Uber Eats drivers make?
Gridwise data tell us the following:
- Monthly earnings average around $444.00 per month.
- Gross earnings per trip are between $9.00 and $10.00.
- Tips make up about 50% of most Uber Eats drivers’ income, which amounts to about $225.00 per month.
Is Uber Eats good money? It can be. While there are other gigs that pay more per trip, if you drive for Uber Eats, you’ll always be pretty busy.
https://datawrapper.dwcdn.net/HPAz8/3
You can also see that, unlike many other gigs, tips play a huge role in Uber Eats earnings.

With these numbers as a baseline, what can we say about how to earn $1,000 a week with Uber Eats? As we said in the introduction, it’s going to be a hustle, but it’s really possible. To figure out how to make the most money with Uber Eats, let’s start by looking at how many trips these “average” drivers made each month.
We know that average gross earnings were $444.00 per month, and drivers got around $10.00 per trip. That means they took 44 or 45 trips per month, which breaks down to 11 trips per week. That’s not a lot of Uber Eats delivery, is it?
The fact that Uber Eats drivers averaged so few trips shows us that many drivers use more than one app at the same time. This is called multi-apping, and you can learn more about it in this Gridwise post. If you want to answer the question of how much you can make with Uber Eats, then you need to stick with the app and keep plugging away at those orders. You also need solid strategies, as well as some inside tips and tricks.
How to make the most money on Uber Eats: Delivery driving tactics
Getting to that $1,000 a week with Uber Eats isn’t so hard when you remember that the drivers we saw making about $111 a week were only taking around 11 trips in the same time period. That’s not much at all! If you work the Uber Eats app like a boss, you’ll soon have many more trips than that, easily reaching the number needed to get you to $1,000 a week. Now, let’s get to some tactics you’ll need to make that kind of bank.
- Stay with the Uber Eats app, and track your earnings. Gridwise can easily do that for you. Simply sync your Uber Eats app with Gridwise, and you’ll be able to see how much you’ve earned with Uber Eats, what times were most profitable, and your average hourly pay. Racking up trips with Uber Eats has other benefits, including perks and bonuses that are awarded to top drivers.
- Leverage surge pricing and promotions. Surge pricing is applied when there is a lot of demand. When surge pricing is in effect, many of the trips you make will pay more than usual. Promotions are offered to drivers who complete a given number of trips in a certain time period. High traffic volume days, nights, and times give you these chances to get extra earnings. Challenging yourself to complete the right number of trips for promotions will add to the number of trips you can count on for big bucks, too. Learn more about Uber Eats surge pay, boosts, and promotions in this Gridwise blog post.
- Say yes to doubling up on orders. With Uber Eats, you can get back-to-back orders or receive batched orders. Back-to-back orders happen when you receive a new request while you’re on the way to deliver an original order. The Uber Eats app routes these trips automatically, so you won’t be sent out of your way.
Batched orders are Uber Eats’ way of bundling together orders from either the same restaurant, or two nearby eating establishments. You get money—and trip count credit—for all the orders you complete, plus customer tips, without having to make a bunch of separate trips.
- Turn on the charm and get bigger tips. Being nice really is part of the Uber Eats driver’s job, and getting tips is one way people who drive for Uber Eats make money beyond their basic pay.. Bring along those extra napkins and condiments, use equipment that keeps food and drinks at the right temperatures and prevents spilling, and consider your customers’ needs. If you deliver groceries, be extra careful with delicate items such as bread and eggs.
And, most important, follow your customers’ directions, and stay in communication with them if you are going to be delayed, or if you have questions about their order. This Gridwise post will tell how to get bigger tips as a delivery driver.
- Use even more charm to keep your ratings high. As an Uber Eats driver, you will be rated by the restaurant or store where you pick up the orders as well as the customers who are waiting for the deliveries. This two-way rating system is designed to keep you on your toes, so Uber can keep people satisfied with your service. Don’t worry—you get to rate them, too.
There’s another reason why your rating as a driver is important. It not only keeps you in good standing with Uber; it helps you to qualify for the Uber Eats Pro incentive program. To learn more about Uber Eats Pro, and what it takes to earn perks such as preferred services, discounts, and deals, check out this Gridwise blog post.
Smart business moves that seal the deal
Now that you know how to gobble up the deliveries you need to make $1,000 a week with Uber Eats, it’s going to be a breeze to get there. Let’s make it even easier, with business moves that boost your earnings and shrink your expenses. If you use these, it will also be easy to say yes when people ask, “Can you make good money with Uber Eats?”
Minimize expenses. Avoid racking up big fast-food bills by bringing your own food and beverages. You might not think you’re hungry when you first start your Uber Eats run, but once the aroma of pepperoni pizza, premium cheeseburgers, and piping hot fries start wafting through your car, that might change. Bring a sandwich or other healthy food from home, and buy bottled water in bulk to save tons of cash compared to what it costs to buy single servings.
Maximize tax deductions. Another way to minimize your expenses is to maximize your tax deductions. Start by tracking mileage with Gridwise.
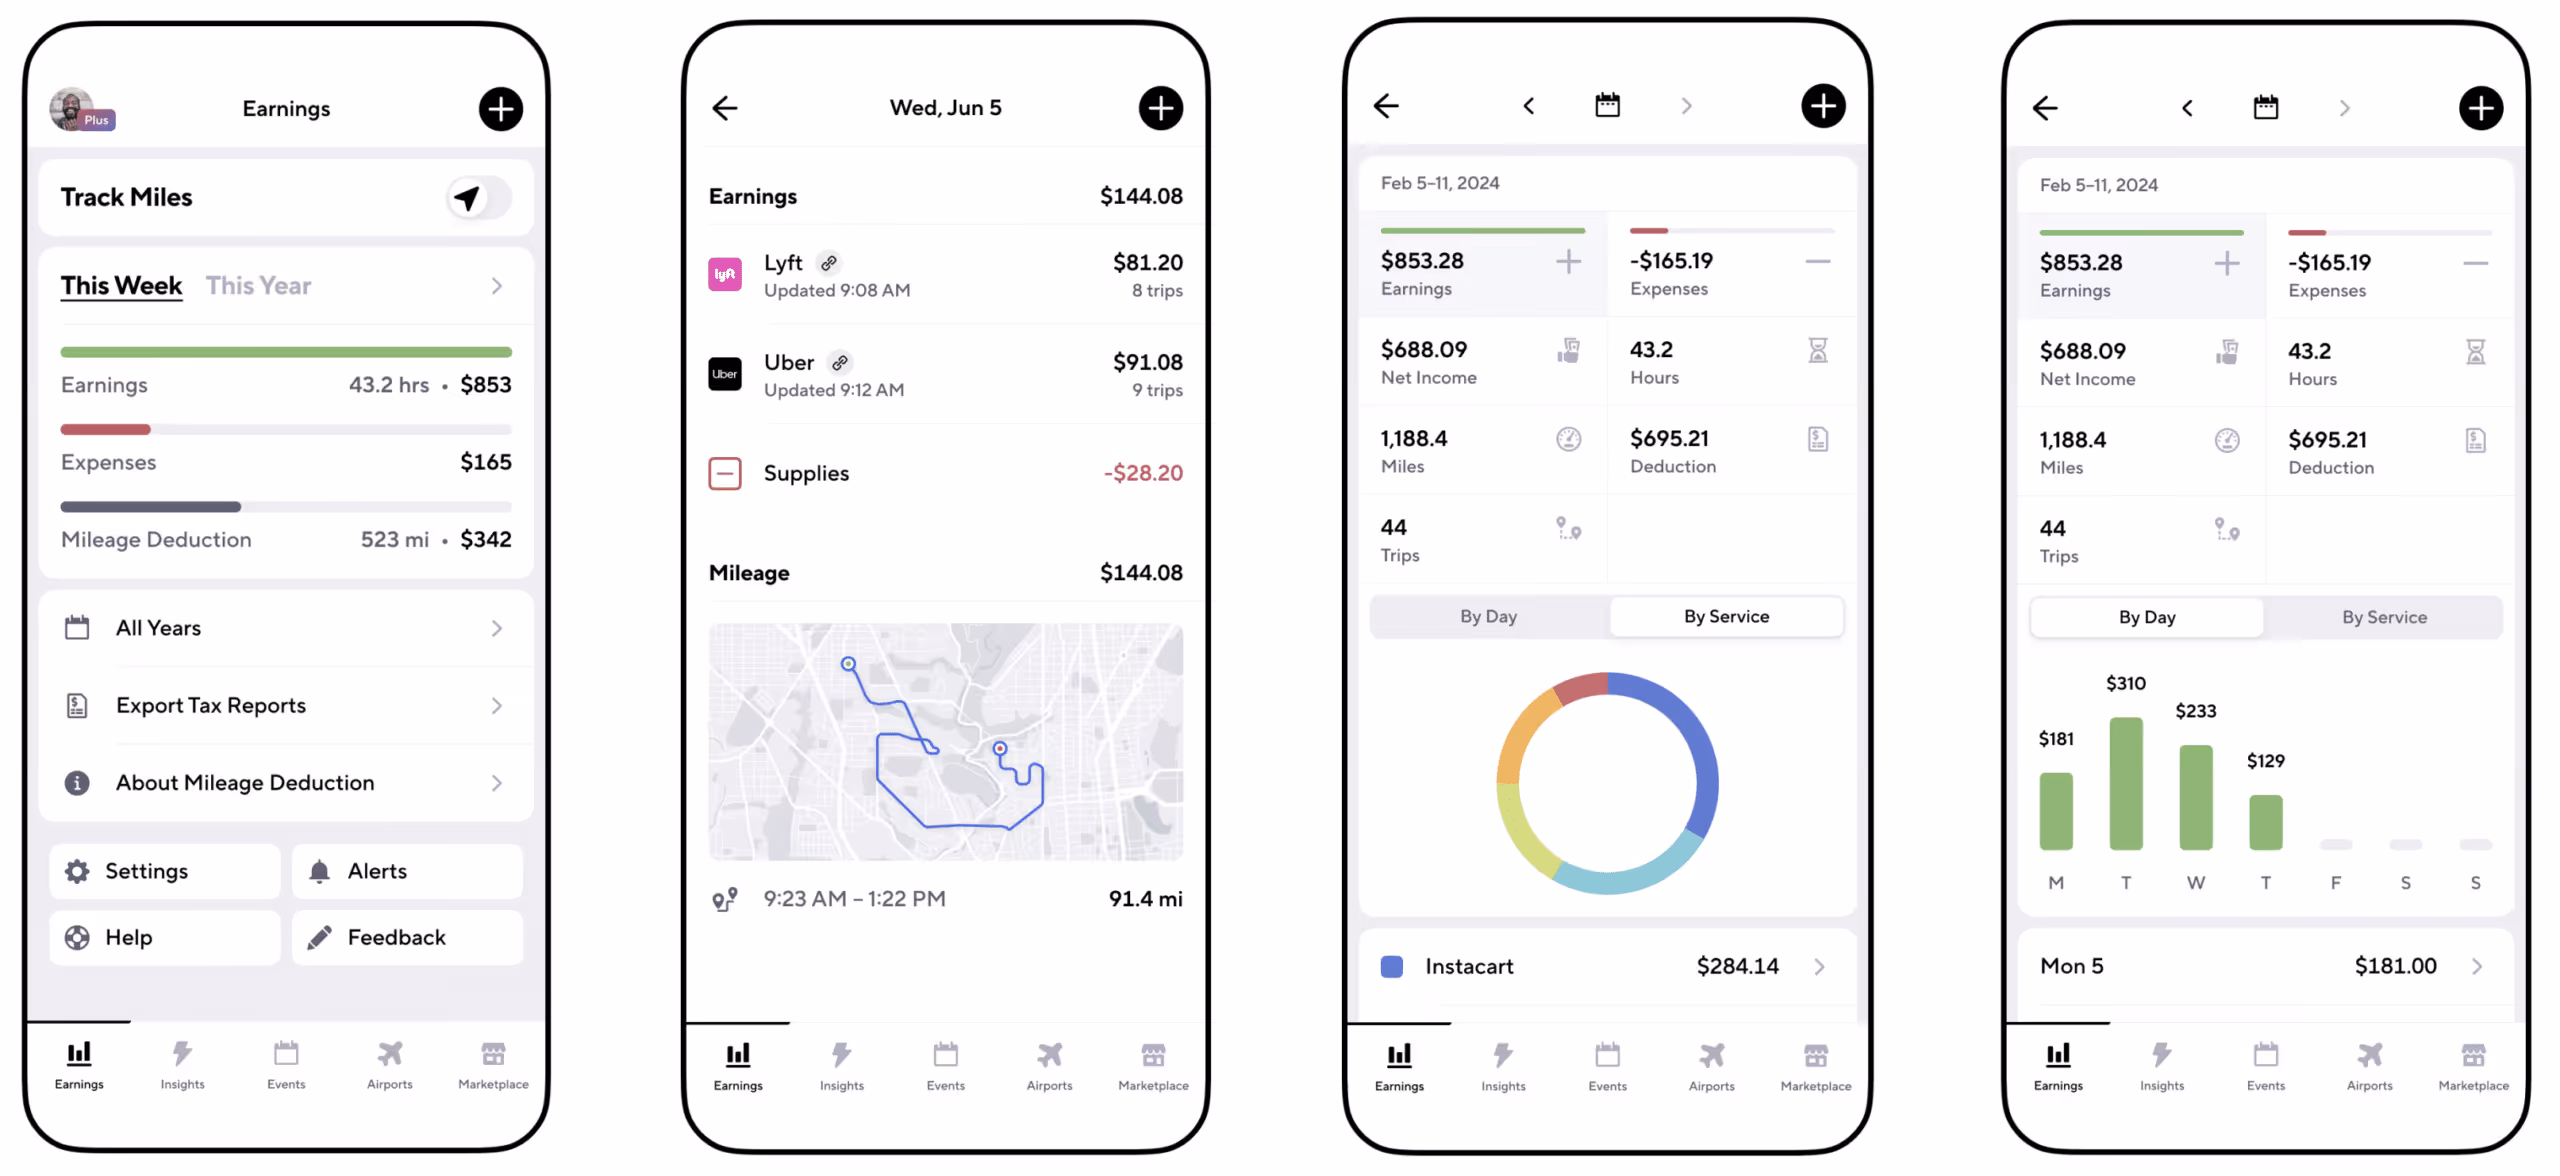
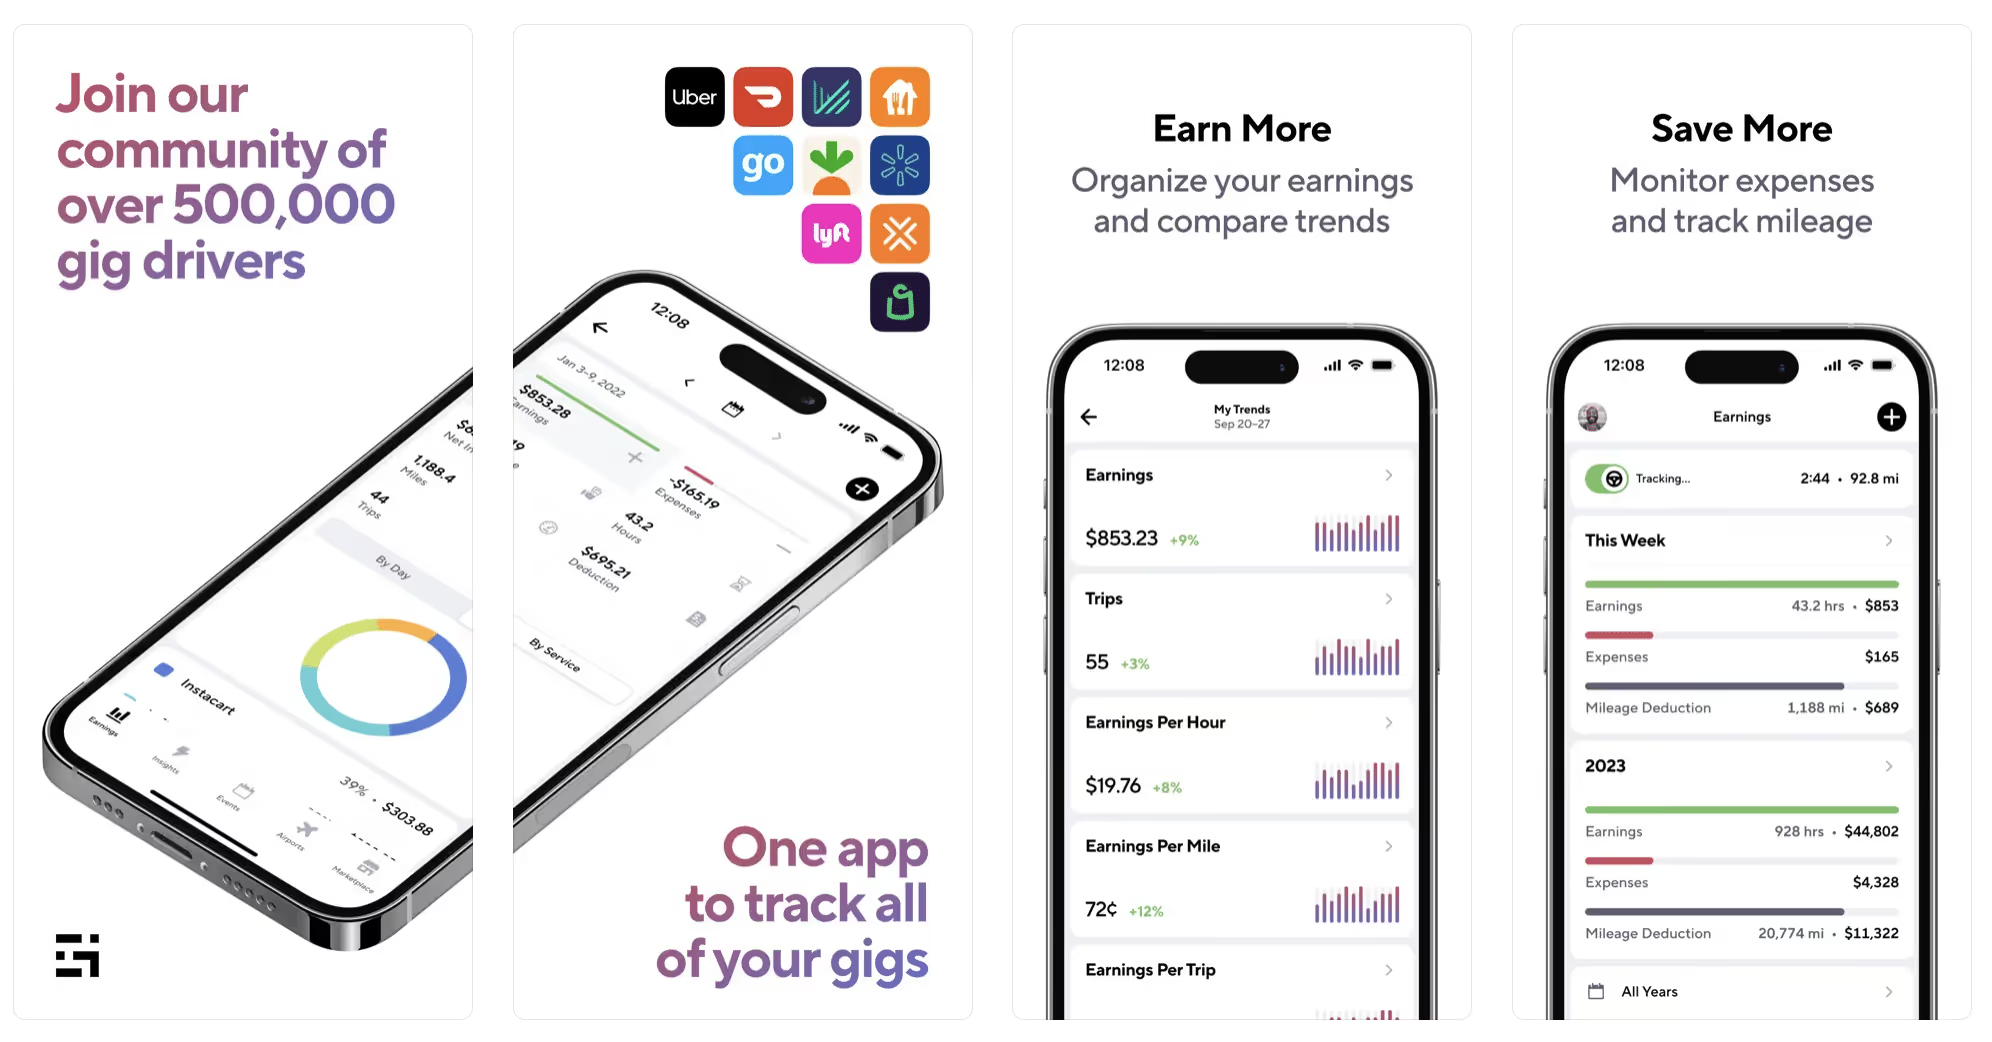
Gridwise App
Gridwise captures every deductible mile you drive, including the distance you cover between the trips your driving app records. Know what expenses you can deduct, and put them to work for you when tax time comes. Learn more about tax deduction strategies in the Gridwise Tax Guide for drivers.
Boost earnings with referrals
As an independent contractor, you’re probably looking for ways to make even more money than you can with Uber Eats. And most gig workers like you enjoy getting passive income. With Uber Eats, there’s a really easy way to do that—referrals!
All you need to do is find friends and encourage them to deliver for Uber Eats. If they make a certain number of deliveries within a specified time, you will get paid for doing nothing more than having them sign up under your referral code! Rates of pay vary by city, so check your Uber Eats app to find out what the current deal might be, and learn more about the referral program on the Uber Eats website.
Also remember: “friends” don’t have to be your best buds. Many delivery people carry cards with a QR code linking to their referral information, so just about anyone you encounter can join Uber Eats and boost your earnings. You could meet a source of passive income at the gas station, on social media, or at your high school reunion. The more you hustle, the more there is to gain, right?
Master the art of self-employment
As an Uber Eats driver, you’re an independent contractor. That means the company isn’t going to withhold your taxes, provide insurance, keep track of your earnings, or tell you about tax deductions. You’ll have to do all these things for yourself.
If you want to maximize your tax advantages, open an official business entity. You can incorporate (create a corporation) or you can work as a limited liability corporation (LLC). You can also work with a DBA (Doing Business As) arrangement, but the corporation or LLC will do a better job of protecting you from liability.
Establishing a corporation or LLC offers better tax advantages than being a sole proprietor. For instance, if you simply collect your earnings into your private account, you’ll be charged self-employment taxes in most states. And paying extra taxes is something we all want to avoid, within legal limits, as much as possible.
Every Uber Eats driver needs to learn about self-employment, and there are some great resources you can review. Check out the CareerOneStop website about self employment which will help explain the basics. You can also check with a professional tax accountant, or look other websites to learn more about actually creating a business.
Scope out your market
Look at the area around you to see where you’re likely to get the most deliveries. Where are all the restaurants? Where might people be more inclined to order deliveries? What hours do you want to drive? What activities might be going on around those times? Think about late-night and after-school times as well as breakfast, lunch, and dinner times.
Be realistic about the potential for your area and aware of new services opening up. For example, in New York, there is already a tab on the Uber Eats app that allows customers to order groceries. In our article about the best food delivery service to work for you’ll see that Uber Eats stacks up well against other delivery companies, mainly because of its potential for expanded opportunities for drivers to earn.
So, is Uber Eats good money? As we said, it isn’t an automatic guarantee that everyone will make $1,000 a week with Uber Eats. Trying out the suggestions we give you here, though, should put you on the right track! Go out there and start stacking up those orders and raking in some impressive earnings!
[elementor-template id="20936"]
Get more inside information on Uber Eats in these posts from the Gridwise blog:
- The delivery driver guide: Using the Uber Eats app
- Everything you need to know about driving for Uber Eats
- Uber Eats Pro: What drivers need to know
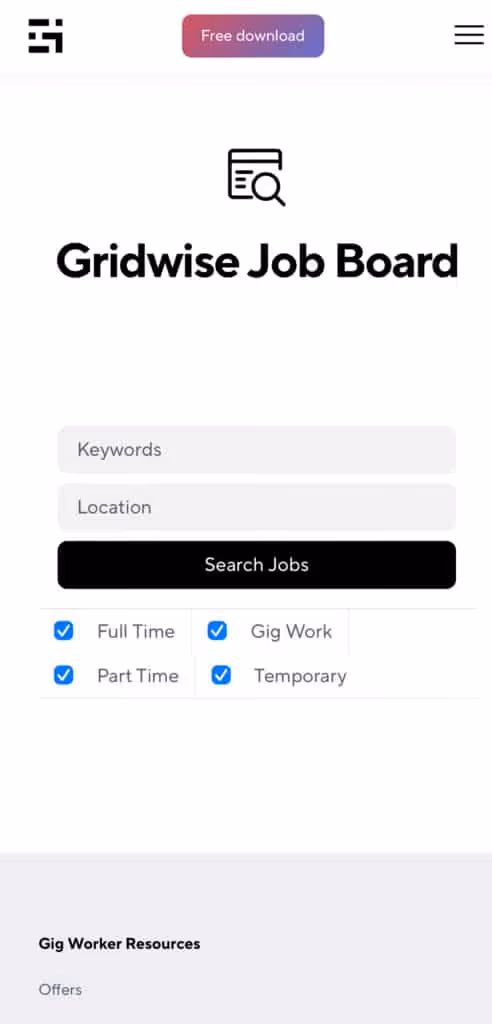
- Looking for a different gig, part-time or full time job? Check out the Gridwise Job board.
Uber Eats FAQ
How does the Uber Eats platform work for drivers?
Uber Eats is a food delivery service that connects customers with local restaurants and independent delivery partners. As an Uber Eats driver, you'll receive notifications of nearby delivery requests, which you can accept and complete. The platform provides flexibility, allowing you to work on your own schedule and earn money based on the number of deliveries you complete.
What are the requirements to become an Uber Eats delivery partner?
To become an Uber Eats delivery partner, you'll need to meet certain requirements, such as having a valid driver's license, a registered vehicle, and passing a background check.
How can I choose the right delivery zone to maximize my earnings?
Selecting the right delivery zone can significantly impact your earnings, as some areas may have higher demand and better-paying orders. It's important to research and identify the zones in your area that tend to have the most consistent and lucrative delivery opportunities.
How can I take advantage of peak delivery hours and surge pricing?
Understanding peak delivery hours, such as mealtimes and weekends, and taking advantage of surge pricing can boost your earnings. Be aware of when demand is highest in your area and adjust your schedule accordingly to capitalize on these peak periods.
What are some tips for maximizing tips and customer satisfaction?
Providing excellent customer service and going the extra mile to ensure a positive experience can lead to more tips and repeat business. Prioritize communication, timeliness, and attention to detail to keep your customers happy and satisfied.
How can I set realistic weekly goals to reach my $1000 target?
To make $1000 a week with Uber Eats, it's essential to set realistic weekly goals and track your earnings and expenses. Start by determining your target earnings and breaking it down into achievable daily or weekly goals. This will help you stay on track and make adjustments as needed.
What are some strategies for efficient route planning and navigation?
Effective route planning and navigation can save you time and fuel, allowing you to complete more deliveries. Utilize mapping apps and take advantage of features like real-time traffic updates and turn-by-turn directions to find the quickest routes.
How can I balance my Uber Eats deliveries with other commitments?
Develop a schedule that allows you to capitalize on peak delivery hours while still maintaining a healthy work-life balance. Consider using tools like calendar apps to plan your availability and track your hours to ensure you're maximizing your earning potential without sacrificing your personal life.
What are the key considerations for maintaining my vehicle as an Uber Eats driver?
Keeping your car clean and well-maintained is crucial for maximizing your Uber Eats earnings. Regularly scheduled oil changes, tire rotations, and other preventive maintenance can help extend the life of your vehicle and minimize downtime. Additionally, budgeting for vehicle-related expenses, such as fuel, insurance, and repairs, will ensure you're accounting for these costs and maximizing your net earnings.
What are the tax obligations and legal considerations for Uber Eats drivers?
As an Uber Eats delivery driver, it's essential to understand the tax obligations and legal considerations that come with being an independent contractor. This includes properly reporting your earnings, deducting eligible business expenses, and making quarterly estimated tax payments. Additionally, you'll need to ensure you have the appropriate insurance coverage, such as personal auto insurance and possibly commercial auto insurance, to protect yourself and your vehicle while on the road making deliveries.

The Gridwise Job Board: Find Your Ideal Job or Gig Work
Gridwise is an essential assistant app created by gig workers for gig workers. Our mission is to support those engaged in gig work in every way possible. We understand how challenging it can be to deal with income instability, a lack of benefits, and job insecurity that often comes with gig work. The Gridwise app tracks and organizes earnings and expenses, and offers a wide array of discounts, deals, and services that make the lives of independent contractors easier and more rewarding.
We firmly believe it’s possible to make a viable living and create a gig experience that offers flexible hours, variety, and excitement. With issues such as consistent earnings and job security in mind, Gridwise is proud to offer a centralized platform that shows you how to find gig work and secure reliable opportunities. We’re proud to introduce the Gridwise Job Board.
[elementor-template id="20891"]
The Gridwise Job Board: Key features
Because Gridwise is dedicated to serving the gig worker community, we’ve filled the Gridwise Job Board with useful features that won’t waste your precious time.
- Comprehensive listings. Find part-time, full-time, temporary, and per-task work. Drive or deliver with your vehicle, utilize an employer’s vehicle, or even find non-driving gig work.
- User-friendly interface. Find the jobs that are right for you with a tap of your screen.
- Verified opportunities. We vet the jobs before they are listed to ensure you’re getting high-quality job postings.
How to get more gig work, seasonal, part-time or full-time jobs with the Gridwise Job Board
Looking specifically for “gig work apps” or “gig jobs near me?” You’re in luck. Our filters and search functions send you directly to the listings you seek.
Here’s how it works.
- Access the Job Board via the Gridwise website.
- Search for jobs by type, location, and more.
- Select the job that interests you, and read all about it.
- Scroll through the description, and if it appeals to you, click “Apply for job.”
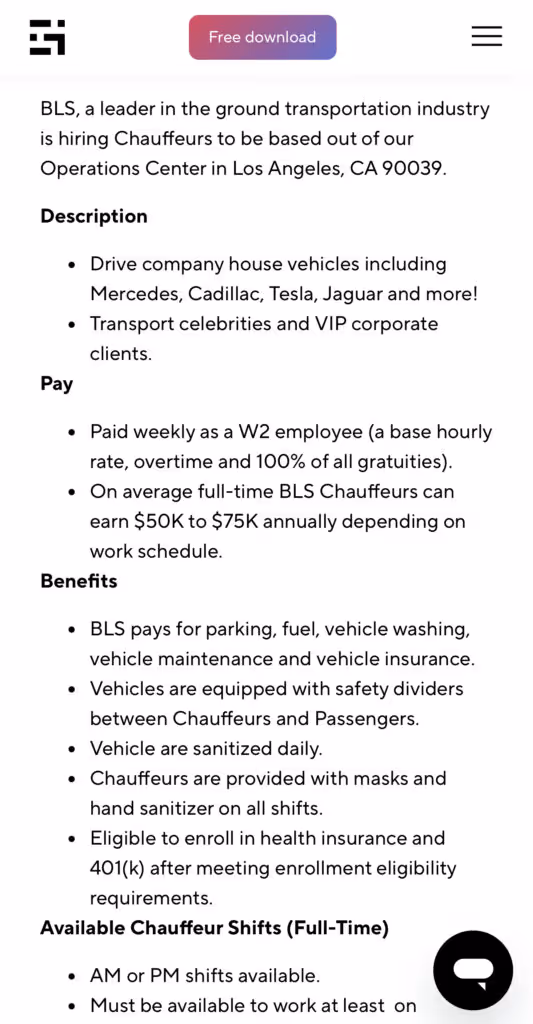
Many types of jobs are available. Adjust the search filter to see the full variety of opportunities that will let you cash in. Deliver food, set up catering, do rideshare driving, get paid for doing package delivery, and much more. You’ll find short-term gigs, long-term contracts, and part-time positions.
Perks of the Gridwise Job Board for gig workers
Gig workers who know how to make extra money will appreciate how the Gridwise Job Board lets you multiply your chances of bringing in big earnings. Here’s how:
- Increased stability. Use the Gridwise Job Board to find part-time or permanent jobs in addition to the part-time gigs you already have. Always keep a steady stream of earning opportunities flowing toward you.
- Flexibility and autonomy. Choose jobs that fit your schedule, work around other jobs and family duties, and still leave room for some fun in your life. Discover side hustles to supplement your full-time job, permanently or just for the season.
- Skill development. Find part-time work that lets you use a skill you already have, or try your hand at something new. It’s a smart way to develop a portfolio to showcase what you can do, or even to find permanent employment.
Get Gridwise and stay up to date on the Gridwise Job Board
Gig workers need plenty of information and assistance, and Gridwise is here to give it to you. Download the app and get essential features such as
- seamless earnings tracking
- mileage tracking
- expense recording, including notes
- low-cost and no-cost insurance benefits
- access to affordable medical, dental, vision, mental health, and alternative care
- professional services including legal and financial help
- deals and discounts
- weather, events, and traffic reports
- inside information on where and when to drive
[elementor-template id="20936"]
More to know about gig work:

5 Best Mileage Trackers For Gig Drivers
Many drivers ask, “Do I really need a mileage tracking app?” The answer is simple: only if you want to have an accurate count of all the miles you can legally deduct from your taxable income! You might think your rideshare or delivery driving app has got you covered. After all, they do quite a good job of logging the miles you drive while you’re on a trip or delivery. But, if you want to have the best app to track mileage for Uber, Lyft, Doordash, Instacart, or the other apps you may use, you need more. Why is that?
Without a separate tracker, you’re missing the miles you drive in between pings. Did you realize that all the miles you drive, from the moment you begin your shift until it’s over (as long as you don’t drive several miles on a break to hang with your friends), are tax deductible! That means you need something besides your driving app to keep an accurate count of your travels. Read this Gridwise post to see how important it is to keep track of every deductible mile.
You won’t be surprised to hear that there’s an app for tracking miles. In fact, there are several of them. Here, we’re going to tell you about five top mileage tracking apps, and help you figure out which one is best for you.
Before we get to the list and identify the best mileage tracker app, let’s clarify what exactly a mileage tracking app is. According to G2.com’s technology glossary, mileage tracking is done for the purpose of keeping a log of mileage that is either reimbursable or tax deductible.
And yes, of course you can track your miles simply by taking readings on your odometer. But are you really prepared to account for how many miles you drove for personal reasons and subtract them from the total to get your business mileage? Even if you can remember all that and do the arithmetic, if you want an accurate reading of the miles you drive for business, and can therefore deduct, a mileage tracking app will save you a lot of trouble and prevent you from making costly errors.
Plus, as a gig driver, you have specific needs when it comes to a mileage tracker. Ideally, you’d be able to handle mileage tracking and several other functions all in one app. It can be maddening enough to deal with driving apps, particularly if you’re an avid multi-apper. You would want your mileage tracker app to help you keep account of other aspects of your business, including income, expenses, and inside information about the art of gig driving.
Not all mileage apps are equal, to be sure! Let’s look at five of the best apps to track mileage and figure out which is the best app to track mileage with Uber and Lyft, or what mileage tracker app is best for DoorDash.
[elementor-template id="20891"]
1. Zoho Expense
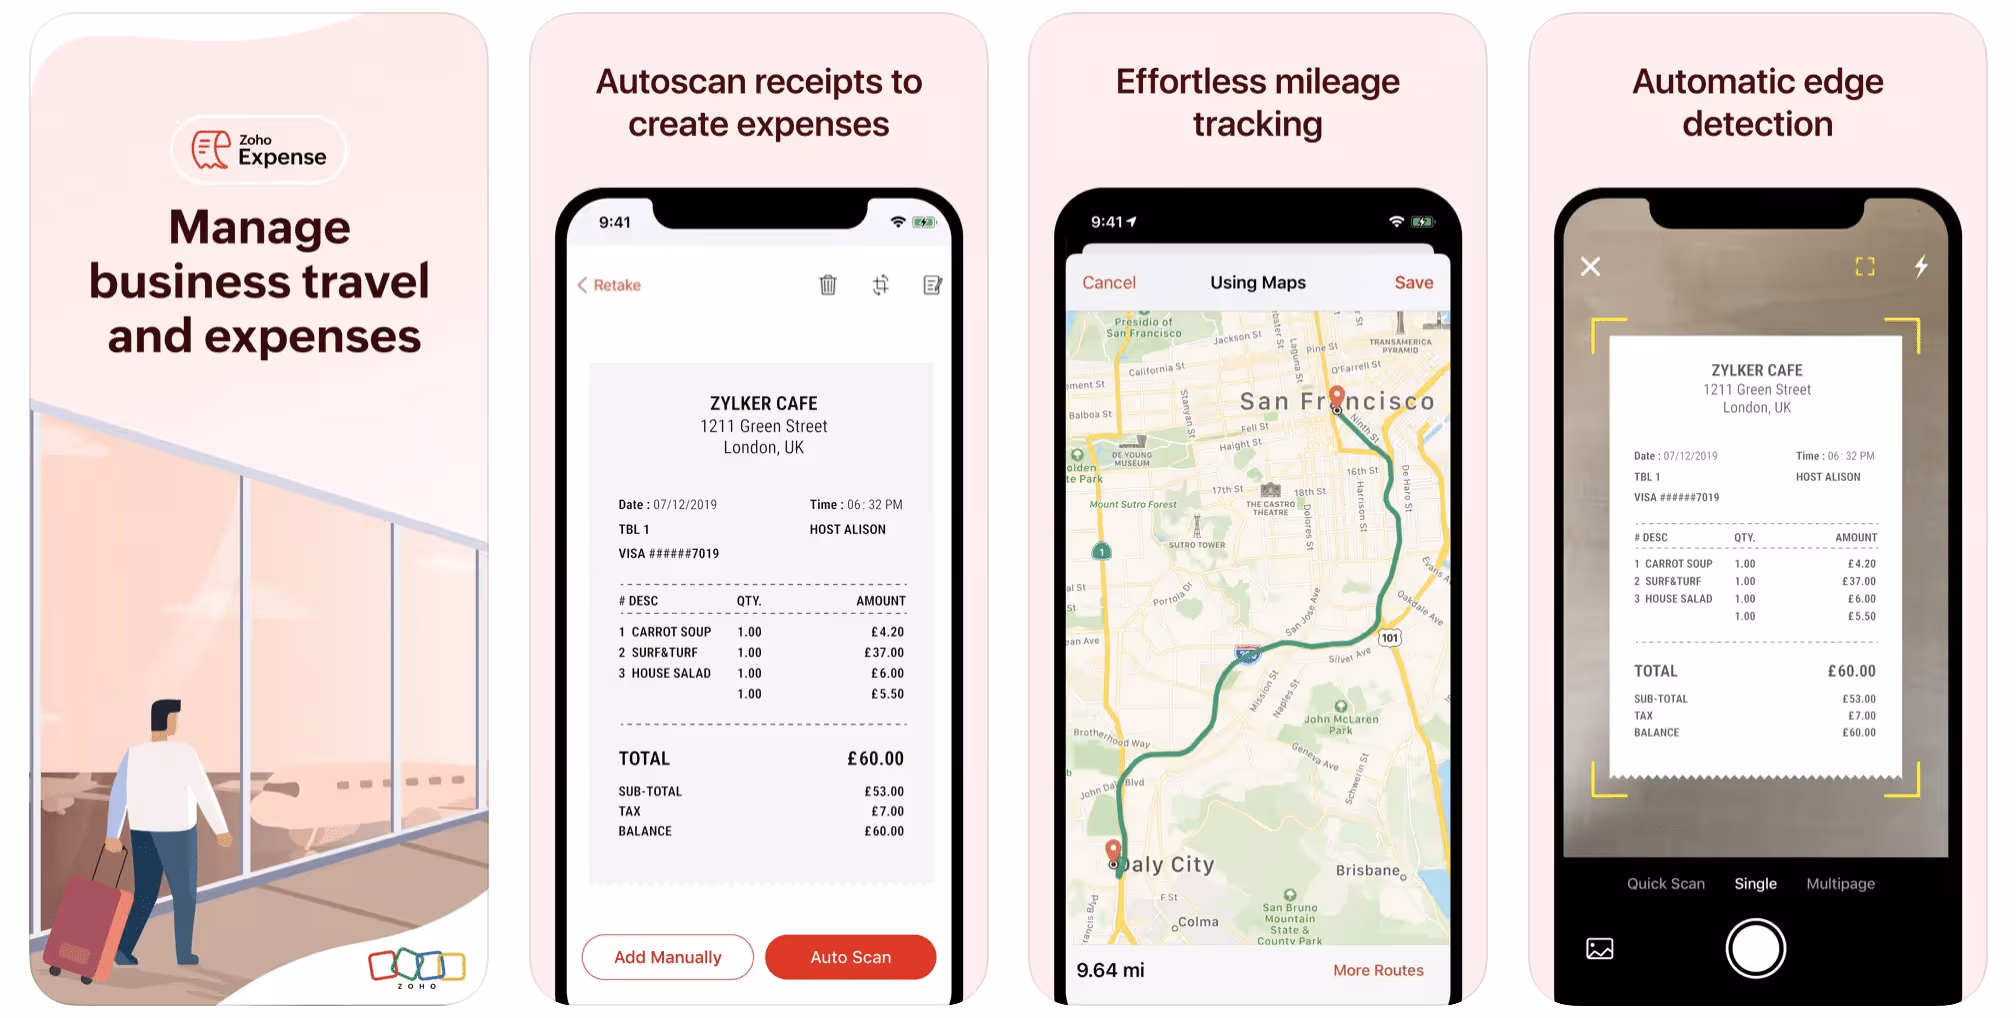
First up is Zoho Expense, which does exactly what its name says. This app is designed to allow companies to give employees a uniform way to create and submit expense reports. It can be used by individuals, including gig drivers, as well.
It includes a mileage tracker, as well as features that let you track other deductible expenses, including the ability to scan and record receipts.
Available on Android and Apple: Yes
Ratings: 4.8 stars on App Store, 4.7 stars on Google Play
Free Version: Yes
Subscription price: $3 per month, billed annually
Created specifically for gig drivers: No
2. Quickbooks Online
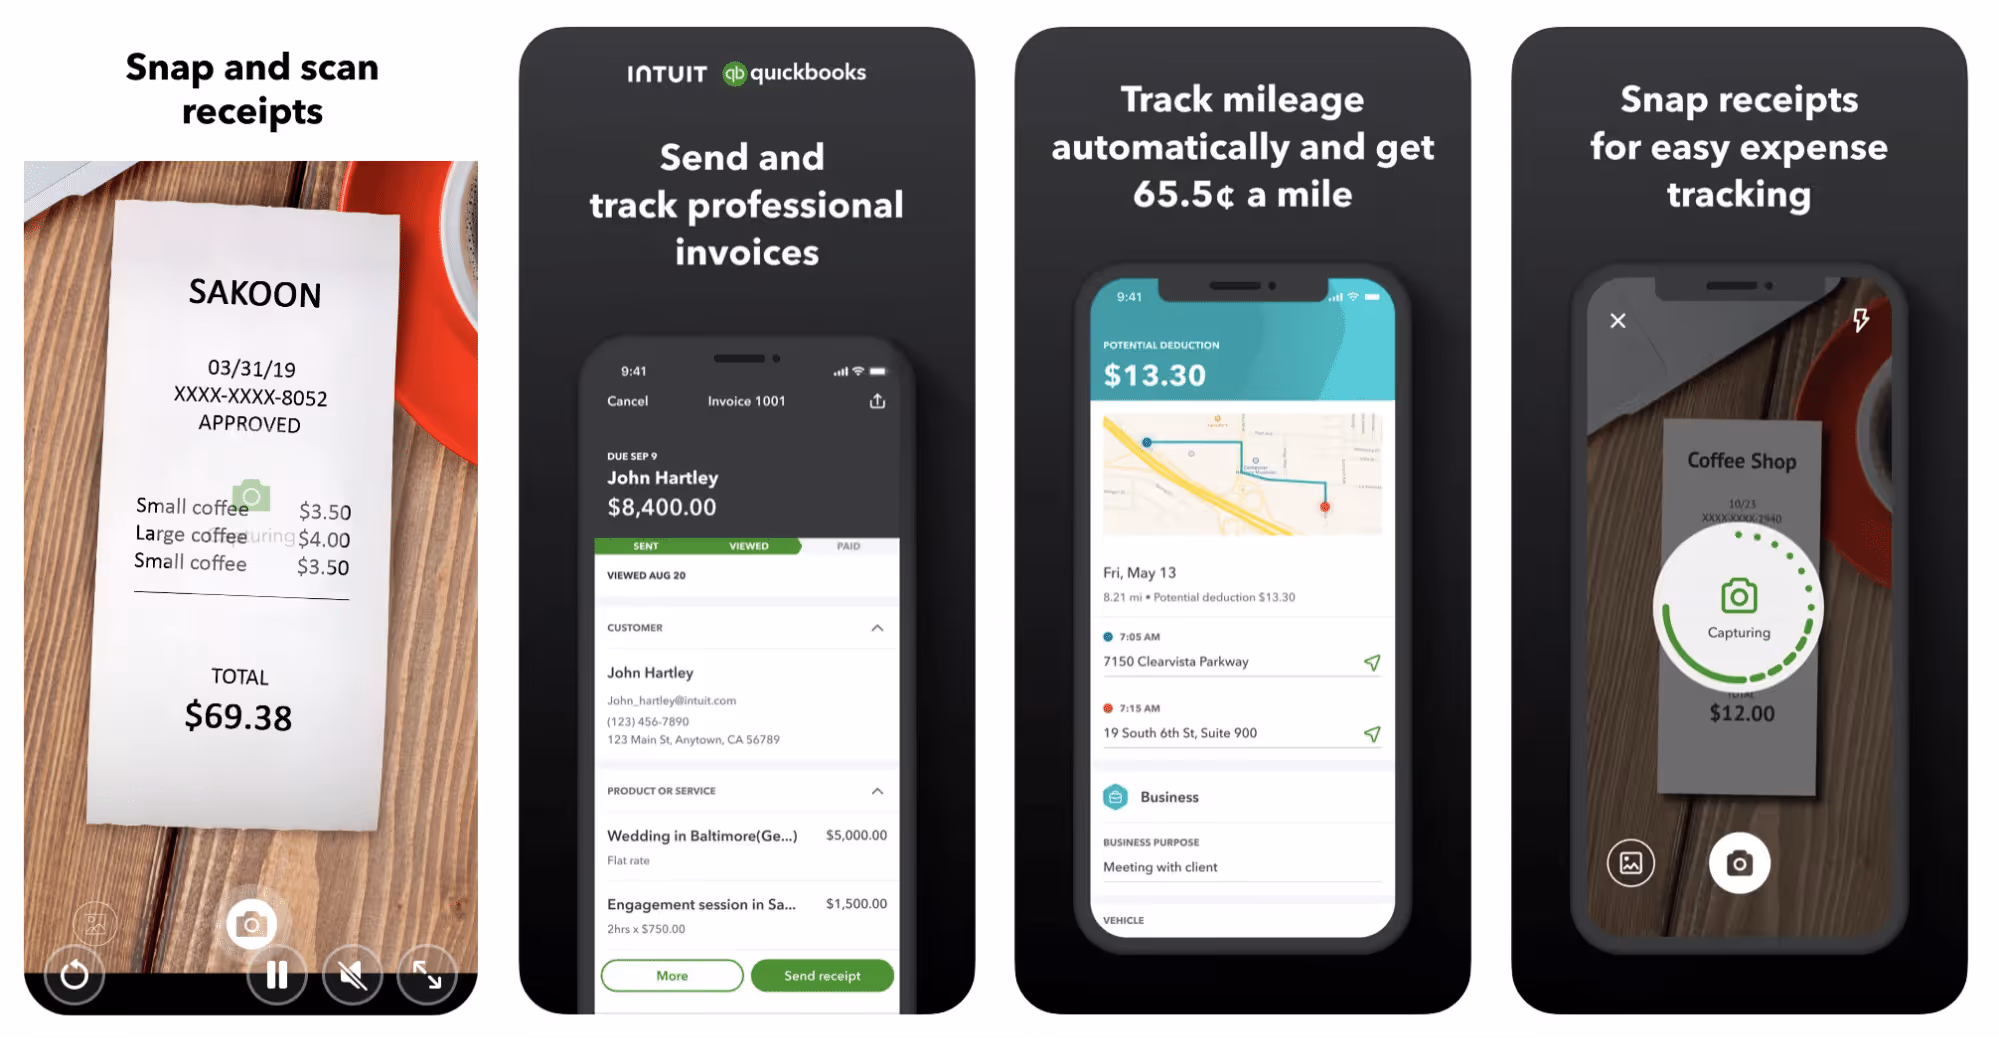
Quickbooks Online is a cloud-based app that allows you to track your mileage, earnings, and expenses. The information you enter can then be used to generate various reports that prepare you for tax time. It also allows you to create graphs that illustrate your cash flow, and includes a receipt scanner so you can instantly record deductible expenses. Quickbooks is popular, highly reliable, and designed mainly to help people keep track of their small businesses.
Available on Android and Apple: Yes
Ratings: 4.7 stars on App Store, 4.4 stars on Google Play
Free version: 30-day free trial
Subscription price: $15 per month for basic version if purchased for 3 months or more
Created specifically for gig drivers: No
Source: quickbooks.intuit.com
3. Shoeboxed
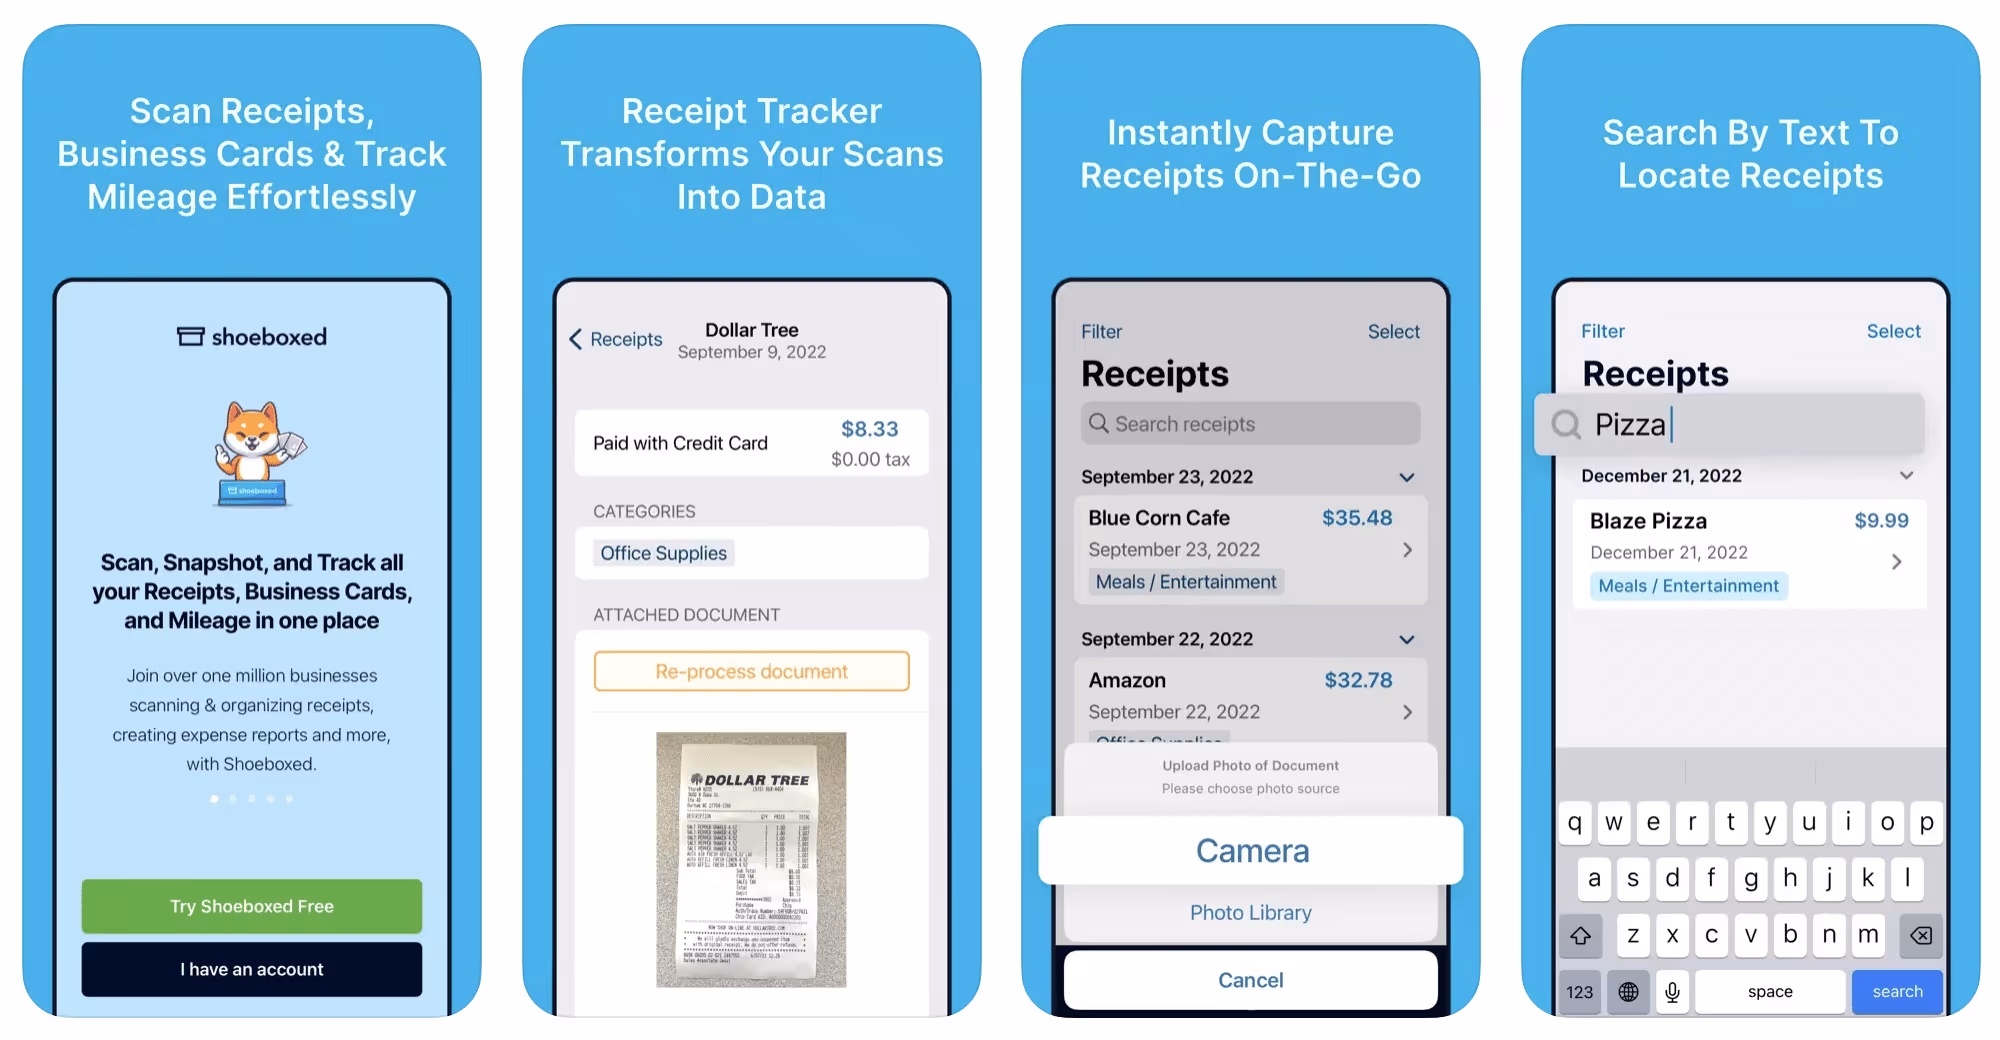
Shoeboxed started in 2007 as a service for scanning paper receipts into digital form. Now the app offers a free mileage tracker and has enabled users to scan receipts directly. It touts itself as the best mileage tracking app for DoorDash, but there are some elements missing that Dashers might like to have. While it provides features that record your expenses and prepare you for tax season, it doesn’t automatically track your earnings. The mileage tracker has a system where you can drop pins along your routes to make the tracking more precise, identifying those legs of a trip that you make for business purposes. The mileage tracker is “free” once you sign up for the basic version.
Available on Android and Apple: Yes
Ratings: 4.5 stars on App Store, 2.3 stars on Google Play
Free version: No
Subscription price: $18 per month for basic version
Created specifically for gig drivers: No
Source: blog.shoeboxed.com
4. Stride
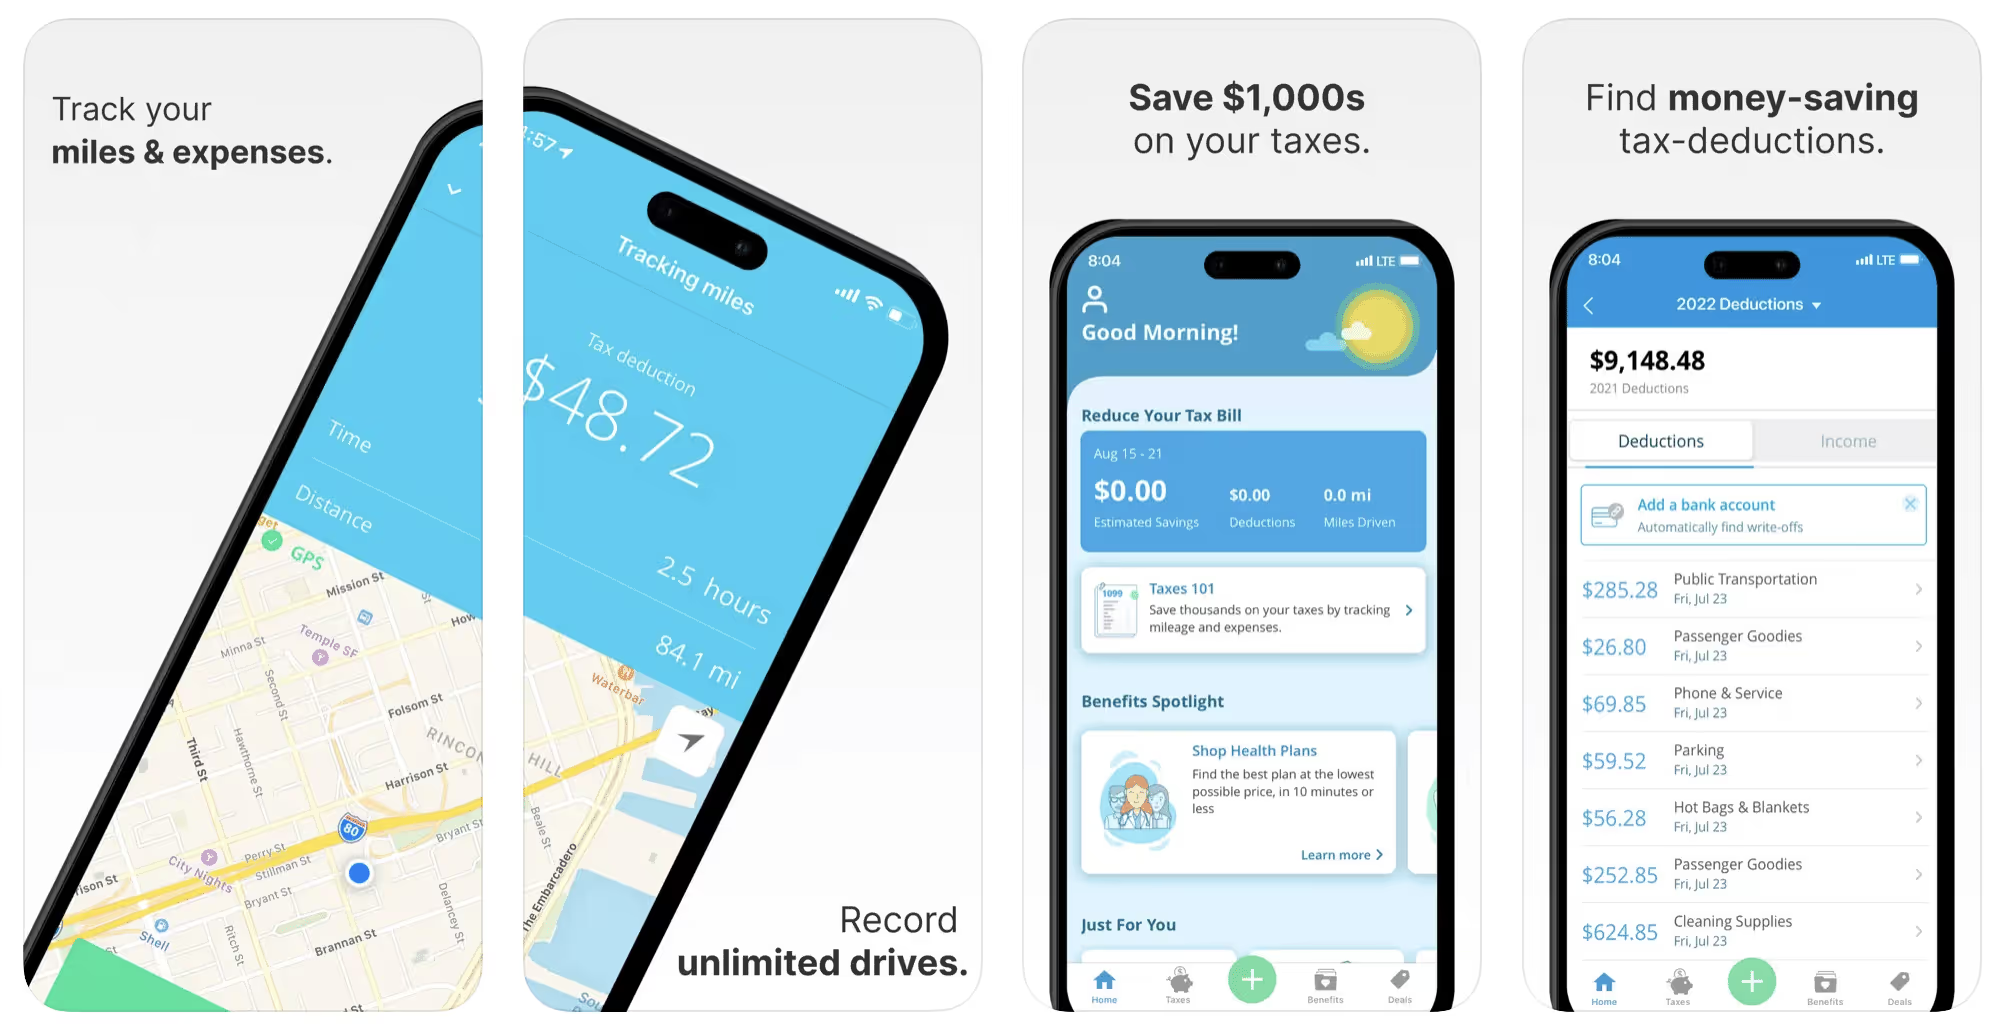
This free mileage tracker does a fair job of keeping track of the distances you rack up while gig driving, but it doesn’t automatically track earnings. It can be a big help, though, in tracking your expenses. You can link Stride to your bank account, and it will automatically scan your expenses to identify items you can potentially deduct. The app is totally free. This could make it the best free mileage tracker app, but there is a small price to pay. The app will persistently push you to consider various insurance plans that they are affiliated with. If you don’t mind that, this is a solid mileage tracker, even if it doesn’t track your earnings.
Available on Android and Apple: Yes
Ratings: 4.8 stars on App Store, 4.6 stars on Google Play
Free version: Yes
Subscription price: None. The app is free.
Created specifically for gig drivers: No
5. Gridwise
Gridwise has a free mileage tracker and free features that record your income and expenses. It gives you access to insurance and benefits, as well as insights about the best times and places to make the most money while gig driving. The Gridwise mileage tracker captures all the miles you drive while you’re on your driving shift, and it can be used if you have other trips you need to make which qualify as business travel.
Drivers love it because it is geared toward the needs of rideshare and delivery workers, providing free information about airport departures and arrivals, event start and let out times, weather, traffic, and more. The Gridwise Plus subscription adds value by providing additional insights and reports, discounts on benefits, the ability to export data in .csv format,, and more.
Available on Android and Apple: Yes
Ratings: 4.9 stars on App Store, 4.6 stars on Google Play
Free version: Yes
Subscription price: $9.95 per month for Gridwise Plus, or $95.99 per year (a $23.41 savings)
Created specifically for gig drivers: Yes!
What is the best mileage tracking app?
Now that we’ve checked them all out, we’re positive about the answer to that. Hands down, it’s Gridwise. Are we biased? You bet we are! But drivers love it too. Gridwise is the best mileage tracker app—and so much more. So many of the features are free, and the subscription to Gridwise Plus will pay for itself with additional insights to boost your earnings and deeper discounts on products and services.
Most important, Gridwise is designed specifically for gig drivers by experts who were once gig drivers themselves! Knowing what gig drivers need is a crucial step in creating an app that rideshare and delivery drivers can really use! Here are a few of the features, besides mileage tracking:
- seamless earnings tracking
- automatic, on/off toggle and manual mileage tracking
- mileage categorization
- airport, traffic, weather, and events information
- insights into where to drive and when to drive
- reports showing earnings across the platforms you use
- discounts on countless products and services for drivers
- additional resources for finding side gigs
- an informative and comprehensive blog
- affordable benefits, including insurance, medical, dental, and alternative practitioner discounts
- a community of drivers just like you
Don’t settle for just any app. Get the best mileage tracker, and so much more, from Gridwise!
[elementor-template id="21599"]

How Much Do Veho Drivers Make? (2026 Guide)
How much do Veho drivers make in 2026? Veho is a fast-growing last-mile package delivery platform that connects drivers with e-commerce and retail brands needing packages delivered to customers. If you have driven for Amazon Flex or Roadie, the model will feel familiar: you claim a delivery route, pick up packages from a hub, and deliver them along your assigned route. Based on publicly reported driver data, job listings, and driver community feedback, Veho drivers typically earn between $16 and $25 per hour depending on route type, market, and efficiency. A note on our data: Gridwise does not currently track Veho-specific earnings. The Veho figures in this article come from public sources. Where we reference Amazon Flex or Roadie data, those numbers come from Gridwise's proprietary dataset -- we will always make that distinction clear.
Quick Answer -- How Much Do Veho Drivers Make?
Based on driver reports, job board listings, and gig worker community data, Veho drivers typically earn between $16 and $25 per hour before expenses. Most drivers report earning closer to the $18 to $22 per hour range on standard routes in mid-size and large markets.
For context, here is how that compares to similar platforms tracked by Gridwise:
- Amazon Flex driver earnings: $20.89/hr median (Gridwise data from tracked drivers)
- Roadie driver earnings: $12.70/hr median (Gridwise data from 6,725 tracked drivers)
- Veho: $16\u2013$25/hr reported range (public sources, not Gridwise data)
That puts Veho squarely between Roadie and Amazon Flex in terms of reported hourly pay. The range is wide because Veho pay depends heavily on your market, route length, and how quickly you complete your deliveries.
Veho Driver Pay Breakdown
Veho pays drivers per route, not per package or per hour. You claim a route through the Veho app, pick up your assigned packages from a local Veho delivery hub, and deliver them along a predetermined path. Your pay for that route is set before you start.
Per-Route Pay
Drivers report route pay ranging from $60 to $150 or more depending on several factors:
- Package count: Routes typically include 20 to 40+ packages. More packages generally means higher pay.
- Route distance: Longer routes covering more ground pay more than compact urban routes.
- Market: Pay varies significantly by city. Higher cost-of-living markets and markets with fewer available drivers tend to offer better route pay.
- Time of year: Holiday seasons and peak e-commerce periods (Black Friday through January) often bring higher route payouts.
Effective Hourly Rate
Most Veho routes are designed to take 3 to 5 hours. If you earn $80 on a route and finish in 4 hours, that is $20 per hour. Finish the same route in 3 hours and your effective rate jumps to $26.67 per hour. This is one of the most attractive aspects of Veho's model: you keep the full route pay regardless of how quickly you finish. Faster drivers earn a higher effective hourly rate.
Per-Package Estimate
Working backward from route pay and package counts, drivers report earning roughly $1.50 to $3.50 per package. This is not how Veho structures its pay -- they pay per route, not per package -- but the per-package math helps you evaluate whether a route is worth claiming.
How Veho Pay Works
Understanding Veho's pay mechanics helps you decide which routes to claim and how to maximize your time on the platform.
Route Claiming
Veho uses a route-claim system similar to Amazon Flex's block system. Routes become available in the app, and drivers claim them on a first-come, first-served basis. Each route includes:
- A pickup location (Veho delivery hub or partner warehouse)
- A set number of packages to deliver
- A delivery zone with mapped stops
- A fixed pay amount visible before you claim the route
This transparency is a significant advantage. Unlike food delivery platforms where you accept orders without knowing exactly how long they will take, Veho tells you the pay and approximate scope before you commit.
Delivery Hub Model
Unlike Roadie (which dispatches from retail stores) or Amazon Flex (which uses Amazon warehouses), Veho operates its own network of delivery hubs. You drive to a Veho hub, scan and load your packages, and head out on your route. The hub model means your first stop is always the same location for a given market, which makes planning your day easier.
Finish Early, Keep Full Pay
This is the key Veho incentive. If your route is estimated at 4 hours and you finish in 3, you still earn the full route pay. Experienced drivers who learn efficient delivery techniques -- optimal stop ordering, quick parking strategies, and familiarity with their delivery zones -- can consistently beat the estimated completion time and effectively increase their hourly rate.
Payment Schedule
Veho typically pays drivers within 24 to 48 hours of completing a route via direct deposit. Some markets may offer same-day or next-day payment options. This is faster than the weekly pay cycles on some competing platforms.
Tips on Veho
Expect minimal to zero tips on Veho. This is package delivery for e-commerce brands and retailers -- not food or grocery delivery. Customers receiving a Veho package usually do not even know who is delivering it until the driver arrives, and there is no built-in tipping prompt in the customer experience the way there is on DoorDash or Uber Eats.
For comparison, Roadie driver earnings show a median tip of just $0.01 per delivery based on Gridwise data from 6,725 drivers -- and Roadie at least delivers branded retail items where customers might think to tip. Package delivery from unknown e-commerce orders is even less likely to generate tips.
The upside of no tips: your earnings are predictable. The route pay you see before claiming is effectively your total compensation. There is no hoping for a generous tipper or worrying about a $0 tip tanking your hourly rate. What you see is what you get.
How to Earn More on Veho
Since Veho pay is route-based and you keep the full amount regardless of completion time, earning more comes down to two things: picking better routes and finishing them faster.
Prioritize High-Pay Routes
Not all routes are created equal. Routes with more packages, longer distances, or in higher-demand markets pay more. When multiple routes are available, do the quick math: divide the route pay by the estimated hours to find your effective hourly rate. A $120 route estimated at 4 hours ($30/hr) beats a $75 route estimated at 3 hours ($25/hr) even though the shorter route sounds more convenient.
Build Route Efficiency
The fastest way to increase your effective hourly rate is to finish routes ahead of schedule. Strategies that experienced Veho drivers report using:
- Sort packages at the hub: Organize your packages by stop order before leaving. This saves time at every delivery.
- Learn your delivery zones: Familiarity with neighborhoods, apartment complex layouts, and parking options cuts minutes per stop.
- Optimize your stop sequence: The Veho app provides a suggested route, but experienced drivers sometimes find more efficient paths.
- Minimize failed deliveries: Every redelivery attempt costs you time. Follow delivery instructions carefully on the first attempt.
Choose the Right Vehicle
A vehicle with more cargo space lets you handle larger routes with more packages in a single run. SUVs and minivans are ideal for Veho -- they offer the cargo space of a truck with easier access for frequent loading and unloading. Sedans work for smaller routes but may limit the routes available to you.
Multi-App Between Routes
If Veho route availability is inconsistent in your market, pair it with other delivery platforms between routes. Amazon Flex driver earnings average $20.89/hr median per Gridwise data, and the block-based structure fits well alongside Veho routes. Roadie driver earnings are lower at $12.70/hr median, but Roadie gigs can fill gaps between Veho routes nicely.
Watch for Peak Periods
E-commerce delivery volume surges during holiday seasons, Prime Day events, and major retail sales. Veho typically offers more routes and sometimes higher pay during these periods. Drivers who make themselves available during peak season can earn significantly more.
Veho vs Amazon Flex vs Roadie -- How Pay Compares
All three platforms involve delivering packages in your own vehicle, but they differ in structure, pay, and who you are delivering for. Here is how they compare.
Pay Comparison
- Amazon Flex: $20.89/hr median hourly earnings (Gridwise data). Block-based, delivering Amazon packages from Amazon warehouses. The most established and highest-paying block-based delivery platform.
- Veho: $16\u2013$25/hr reported range (public sources). Route-based, delivering packages from Veho hubs for multiple retail/e-commerce brands. Growing platform with expanding market coverage.
- Roadie: $12.70/hr median hourly earnings (Gridwise data from 6,725 drivers). Per-gig, delivering packages and large items from retail stores. UPS-owned, lower throughput, essentially no tips.
Model Differences
- Amazon Flex: You deliver exclusively Amazon packages. Blocks are claimed from Amazon logistics warehouses. Pay is per block (typically 3-5 hours). Amazon controls the delivery ecosystem end to end.
- Veho: You deliver packages for multiple e-commerce brands and retailers. Routes are claimed from Veho's own delivery hubs. Pay is per route. Veho is a third-party logistics provider, not a retailer.
- Roadie: You deliver packages, large items, and specialty items (like Delta Air Lines luggage) from retail stores. UPS-owned. Per-gig pricing based on distance, size, and weight. Gig types range from small packages to big and bulky furniture.
Which Is Best?
Amazon Flex pays the most based on Gridwise data but has the most competition for blocks. Veho offers comparable pay in some markets with potentially less competition as the platform grows. Roadie pays less but offers unique big and bulky gigs that can be lucrative for drivers with trucks or SUVs. Many drivers run two or all three of these platforms to maximize their delivery hours.
Is Veho Worth It?
Veho is worth considering if you are in or near a market where it operates. Here is the honest assessment.
The Case for Veho
- Predictable pay: You see the route pay before you claim it. No guessing, no tip dependency.
- Efficiency is rewarded: Finish early and your effective hourly rate goes up. This is rare in gig work.
- Growing platform: Veho has expanded rapidly into new markets since 2023. More hubs mean more routes and more opportunity.
- No passenger interaction: Package delivery means no rider ratings, no awkward conversations, and no concerns about vehicle interior condition.
- Fast payment: 24-48 hour payment turnaround beats the weekly cycles on some platforms.
The Case Against Veho
- Limited markets: Veho does not operate everywhere. If there is no Veho hub near you, it is not an option.
- No tips: Your route pay is your total pay. On food delivery platforms like DoorDash, tips can add 30-50% to your base pay.
- Route competition: In popular markets, desirable routes get claimed quickly. You may need to check the app frequently to grab good routes.
- Expenses eat into pay: Like all gig delivery work, you pay for gas, vehicle maintenance, and insurance. At $18-22/hr gross, net pay after expenses is likely $13-17/hr. Make sure you are tracking tax deductions for gig workers to offset your costs.
Bottom Line
Veho is a solid option for drivers who want predictable, route-based package delivery income. It is not the highest-paying gig platform -- Uber driver earnings and Amazon Flex tend to be higher -- but the pay transparency and efficiency incentives make it attractive for organized, fast drivers. As Veho continues expanding into new markets, it is a platform worth watching.
Veho Driver Earnings FAQ
How much can you make doing Veho full-time?
At the reported range of $16-25/hr, a driver working 40 hours per week could gross roughly $640 to $1,000 per week before expenses. After accounting for gas, maintenance, and self-employment taxes, net income would likely be $500 to $800 per week. These are estimates based on public driver reports, not Gridwise-tracked data.
How much do Veho drivers make per route?
Route pay ranges from approximately $60 to $150+ depending on package count, route distance, and market. Most standard routes in mid-size markets fall in the $70 to $110 range based on driver reports.
Do Veho drivers get tips?
Effectively no. Veho is a package delivery platform, and customers typically do not tip for e-commerce deliveries. Plan your earnings around route pay only.
Is Veho better than Amazon Flex?
Amazon Flex pays a median of $20.89/hr based on Gridwise data, which is at the upper end of Veho's reported range. Amazon Flex has wider market availability but more competition for blocks. Veho's advantage is growing markets with potentially less driver competition and the finish-early-keep-full-pay structure. Many drivers run both platforms.
How much do Veho drivers make after expenses?
After gas, vehicle maintenance, insurance, and self-employment taxes, Veho drivers likely net $13 to $20 per hour depending on vehicle efficiency and local gas prices. The IRS standard mileage deduction for 2026 is $0.70 per mile -- track your miles carefully to maximize your deductions.
What cities is Veho available in?
Veho has been expanding steadily since 2023 and operates in dozens of U.S. metro areas. Availability changes as the company opens new delivery hubs. Check the Veho app or website for current market availability in your area.
Start Tracking Your Delivery Earnings with Gridwise
Veho is a growing platform with promising pay for package delivery drivers, and it is worth adding to your gig app lineup if it is available in your market. While Gridwise does not currently track Veho-specific earnings data, we continue expanding our platform coverage as the gig economy evolves.
What Gridwise does track right now: real earnings data for Amazon Flex, Roadie, DoorDash, Uber, and 200+ other gig platforms. If you are multi-apping across delivery platforms -- and you should be -- Gridwise gives you the data to see exactly which apps pay you the most per hour, per delivery, and per mile in your market.
How Much Do Uber Black Drivers Make?
Uber Black is the premium tier of Uber's rideshare platform, and for drivers who qualify, it can be one of the highest-paying gig opportunities on the road. While a standard UberX trip might pay $12 to $15, a single Uber Black trip routinely pays $40 to $80 or more. The tradeoff? You need a qualifying luxury vehicle, demand is lower, and expenses are significantly higher. In this guide, we break down what Uber Black drivers actually earn, what it costs to operate, and whether the premium tier is worth it for your situation. We also cover Uber XL throughout, since most successful Black drivers run both tiers to fill in around Black demand. We will use real earnings data from 66,952 Uber drivers tracked through Gridwise as a baseline, then explain how Uber Black pay differs from the aggregate.
Quick Answer: How Much Do Uber Black Drivers Make?
Uber Black drivers typically gross $30 to $50 per hour during active driving time in major markets. That is significantly higher than the overall Uber median of $21.92 per hour, which includes all service types (UberX, Comfort, and Black) combined.
Here is how the numbers break down. Gridwise tracks overall Uber driver earnings across all tiers. The aggregate data provides a useful floor:
- All Uber drivers median gross pay: $21.92/hr
- All Uber drivers top 25%: $25.44/hr
- All Uber drivers top 10%: $30.11/hr
- All Uber drivers median per trip: $12.62
- All Uber drivers top 10% per trip: $21.94
Uber Black fares run 2 to 3 times higher than UberX on the same route. Where a typical UberX ride pays $12 to $15, the same distance on Uber Black pays $35 to $60+. For full-time Uber Black drivers in top markets like New York City, Los Angeles, or San Francisco, annual gross earnings of $75,000 to $100,000+ are achievable, though expenses eat into that figure more than they would for a standard UberX driver.
The key caveat: Uber Black demand is lower than UberX. You will complete fewer trips per hour, typically 0.8 to 1.2 compared to the 1.7 trips per hour average across all Uber tiers. But each trip is worth so much more that the math often works out in your favor, especially if you are strategic about when and where you drive.
Real Driver Case Study: One Saturday in Jacksonville
Here is what a single shift looks like for an Uber Black and XL driver in Florida. He grossed $238.67 over 4 hours and 56 minutes across six trips. Uber displays that as $48.42 per hour. After subtracting variable costs (60 cents per mile across 120 miles for gas and wear-and-tear) and a daily share of his own $900/month commercial insurance policy, his net hourly came out to $24.68.
The video walks through the math trip by trip. A strong gross number, a real cost stack underneath, and a meaningfully smaller net. The gap between what the app reports and what lands in your account is the number worth knowing if you are evaluating the premium tier.
Three things to pull out of this driver's example:
- Gross pay is not take-home pay. App-displayed hourly rates do not subtract gas, mileage, or insurance, and that is exactly where the gap between $48 and $24.68 opens up.
- Premium-tier insurance is a daily expense, not just a monthly bill. Spread across 20 driving days, this driver's $900/month commercial policy added about $45 to every shift before he turned on the app.
- Accurate mileage tightens your real hourly. His actual mileage was 125.8, not the 120 he estimated on camera. Tracking real miles inside Gridwise sharpens the net calculation and supports a bigger tax deduction at year-end.
To run the same exercise on your own day, pull one of your best Saturdays into Gridwise and add your real cost per mile. Your gross-to-net gap is one of the most useful numbers to know about your driving.
Uber Black vs. UberX: Why Premium Pays More
The earnings gap between Uber Black and UberX comes down to three factors: higher fares per trip, better tips, and longer average trip distances. Here is how they compare:
Per-Trip Earnings
Across all Uber service types, the median per-trip earnings tracked by Gridwise is $12.62. That figure is heavily weighted toward UberX, which accounts for the vast majority of Uber rides. Uber Black trips typically fall in the $40 to $80+ range, depending on distance and market. Airport transfers and cross-town business trips, the bread-and-butter of Uber Black rides, regularly clear $50 to $100.
The top 10% per-trip figure in our aggregate data ($21.94) gives you a glimpse of what premium-tier trips look like mixed into the overall numbers. Many of those high-value trips are likely Uber Comfort and Black rides pulling the top end upward.
Tips
Across all Uber drivers, the median tip is $1.20 per trip and the average is $1.48. Uber Black riders, who tend to be business travelers and higher-income passengers, tip more consistently and at higher amounts. Tips of $5 to $15 per trip are common on Black rides, and some drivers report tip rates of 15-20% on premium fares. On a $60 trip, a 15% tip adds $9, compared to the $1.20 median tip on a standard Uber ride.
Trip Volume vs. Trip Value
Standard Uber drivers average about 1.70 trips per hour. Uber Black drivers typically complete fewer trips, roughly 0.8 to 1.2 per hour, because demand is lower and trips tend to be longer. The math often still favors Black: one $55 trip per hour beats two $14 trips per hour. But during slow periods, the lower volume can mean significant downtime. Many Black drivers hedge by also accepting Uber Comfort or even UberX requests to fill gaps.
How Uber Black Pay Works
Uber Black uses a premium fare structure that is fundamentally different from UberX pricing.
Premium Fare Structure
Uber Black charges riders higher base fares, per-mile rates, and per-minute rates than UberX. The exact rates vary by market, but as a general comparison:
- Base fare: $8 to $15 (vs. $1 to $3 for UberX)
- Per-mile rate: $3 to $5 (vs. $0.80 to $1.50 for UberX)
- Per-minute rate: $0.40 to $0.65 (vs. $0.10 to $0.20 for UberX)
- Minimum fare: $15 to $25 (vs. $5 to $8 for UberX)
This means even a short Uber Black trip earns you $15 to $25 minimum. A 10-mile, 20-minute trip that would pay $12 to $15 on UberX could pay $45 to $65 on Uber Black.
Surge Pricing on Uber Black
Surge multipliers apply to Uber Black trips just like UberX, and the dollar impact is much larger on a premium fare. A 1.5x surge on a $15 UberX trip adds $7.50. That same 1.5x surge on a $50 Black trip adds $25. Experienced Black drivers position themselves near airports, convention centers, and high-end hotels during peak demand to catch premium surge fares.
Uber's Service Fee
Uber still takes its service fee on Black trips, typically around 25% of the fare before tips. On a $60 trip, that is $15 to Uber and $45 to you, plus the full tip amount. Tips are passed through to drivers at 100%.
Uber Black SUV
Uber Black SUV is an even higher-paying tier for drivers with qualifying luxury SUVs that seat 6+ passengers. Black SUV fares run 20-30% higher than standard Uber Black. Vehicles like the Cadillac Escalade, Lincoln Navigator, Mercedes GLS, and BMW X7 qualify. If you already own one of these vehicles, Black SUV can be the most lucrative rideshare tier available.
Uber Black Vehicle Requirements
Not every luxury car qualifies for Uber Black. The requirements are strict and vary by market, but here are the general standards:
Vehicle Specifications
- Exterior color: Black only
- Interior: Black leather seats required
- Model year: Typically 2019 or newer (varies by market, updated annually)
- Vehicle condition: Excellent. No dents, scratches, or interior wear.
- Four doors minimum
Qualifying Vehicle Makes and Models
Examples of commonly approved Uber Black vehicles include:
- Sedans: BMW 5-Series/7-Series, Mercedes-Benz E-Class/S-Class, Audi A6/A8, Cadillac CT5/CT6, Lincoln Continental, Genesis G80/G90, Lexus ES/LS
- SUVs (for Black SUV tier): Cadillac Escalade, Lincoln Navigator, Mercedes-Benz GLS, BMW X7, Audi Q7, Infiniti QX80, Lexus LX
Uber maintains a market-specific approved vehicle list. Check your city's requirements in the Uber driver app before purchasing or upgrading a vehicle.
Driver Requirements
- Clean driving record: no major violations in the past 7 years
- Background check: standard Uber screening plus additional review in some markets
- Commercial insurance: required in most markets for Black drivers
- TCP or TLC license: required in California (TCP) and New York City (TLC), among other markets
- Vehicle inspection: must pass Uber's inspection process
- Professional appearance: Uber Black riders expect a professional, well-groomed driver
The licensing and insurance requirements can add significant upfront cost. A TCP license in California, for example, involves commercial registration, drug testing, and annual renewal fees. Read our Uber driver insurance guide for a full breakdown of coverage requirements.
Best Times to Drive Uber Black
Uber Black demand follows different patterns than standard UberX. While UberX demand spikes on weekend nights with bar crowds, Black demand peaks during business travel windows and high-end evening events.
To put peak earning times in context, here is what rideshare earnings look like across the full week. This data from Gridwise covers all Uber and Lyft rides combined, showing gross pay per hour by time block and day:
Rideshare Earnings by Day and Time (Gross $/hr)
- Highest earning windows: Sunday 12am-2am ($28.89/hr), Wednesday 12am-2am ($31.07/hr), Saturday 9pm-11pm ($27.32/hr), Saturday 12am-2am ($28.14/hr)
- Lowest earning windows: Tuesday 9am-11am ($20.01/hr), Tuesday 12pm-2pm ($20.37/hr), Wednesday 9am-11am ($20.33/hr)
- Weekend premium: Weekend evenings and late nights consistently pay 25-40% more than weekday midday hours
For Uber Black specifically, the premium demand windows include:
- Weekday mornings (6am-9am): Business travelers heading to meetings and airports
- Weekday evenings (5pm-9pm): Corporate dinners, client entertainment, executive commutes
- Airport runs (all day): Business and first-class travelers arriving and departing consistently request Black
- Friday and Saturday evenings (7pm-12am): High-end dining, events, and nightlife
- Conference and event days: Major business conferences, sporting events, and concerts drive surge demand for premium rides
Best Markets for Uber Black
Uber Black demand is heavily concentrated in major metropolitan areas with large business traveler and affluent populations:
- New York City: highest demand and highest fares nationally
- Los Angeles: entertainment industry and airport traffic
- San Francisco: tech executives and high-income commuters
- Chicago: strong business travel market
- Miami: tourism, events, and nightlife
- Las Vegas: conventions and high-end tourism
- Washington, D.C.: government and lobbying travel
If you are in a smaller market, Uber Black demand may be too inconsistent to rely on as a primary income source. Check your market's Black ride availability before committing to the vehicle investment.
Uber Black Expenses: The Real Costs
Higher earnings come with higher costs. Before calculating your net income as an Uber Black driver, you need to account for expenses that are significantly above what UberX drivers face.
Vehicle Cost
A qualifying Uber Black vehicle typically costs $40,000 to $80,000+ depending on make, model, and condition. Even a used BMW 5-Series or Mercedes E-Class in good condition with recent model year will run $35,000 to $55,000. If you are financing, monthly payments of $600 to $1,200 are common. This is the single largest expense consideration. If buying outright is not realistic, renting a qualifying vehicle is an alternative many drivers use to start.
Depreciation
Luxury vehicles depreciate faster than economy cars, and rideshare miles accelerate that depreciation significantly. Driving 30,000 to 40,000 miles per year for rideshare can cost $8,000 to $15,000+ per year in depreciation on a luxury vehicle. This is a hidden cost many new drivers underestimate.
Insurance
Uber Black typically requires commercial rideshare insurance, which costs $3,000 to $6,000+ per year, roughly 2 to 3 times what personal auto insurance costs on the same vehicle. In markets requiring a TCP or TLC license, additional commercial liability coverage may be mandatory. See our Uber driver insurance guide for details on coverage requirements.
Maintenance and Repairs
Luxury car maintenance costs 2 to 3 times more than standard vehicles:
- Oil changes: $80 to $150 (vs. $30 to $50 for standard vehicles)
- Tires: $800 to $1,500+ per set (vs. $400 to $600)
- Brakes: $500 to $1,200 per axle (vs. $200 to $400)
- Annual maintenance budget: $3,000 to $6,000+ depending on mileage
Fuel
Most qualifying luxury vehicles require premium gasoline and get lower fuel economy than compact cars. At 20 to 25 MPG and premium gas prices, fuel costs can run $300 to $500+ per month for full-time driving.
Detailing and Presentation
Uber Black riders expect a spotless vehicle inside and out. Budget for professional detailing every 1 to 2 weeks at $50 to $100 per visit, plus supplies for daily touch-ups. That is $150 to $400+ per month for a full-time driver.
Total Expense Estimate
For a full-time Uber Black driver, total annual expenses (excluding vehicle purchase/financing) typically run $15,000 to $25,000+:
- Insurance: $3,000 to $6,000
- Maintenance: $3,000 to $6,000
- Fuel: $3,600 to $6,000
- Depreciation: $8,000 to $15,000
- Detailing: $1,800 to $4,800
- Licensing/permits: $500 to $2,000
Make sure you are tracking every business expense for tax deductions for gig workers. The standard mileage deduction (67 cents per mile in 2026) can offset a significant portion of these costs. Read our Uber driver tax guide for a complete breakdown.
Is Uber Black Worth It?
The answer depends almost entirely on one question: do you already own a qualifying luxury vehicle?
Scenario 1: You Already Own a Qualifying Vehicle
If you have a black BMW 5-Series, Mercedes E-Class, or similar luxury sedan sitting in your driveway, Uber Black can be an excellent income source. Your incremental costs are the insurance upgrade ($2,000 to $4,000 more per year), commercial licensing, and extra detailing. Against potential gross earnings of $50,000 to $80,000+ per year in a good market, the ROI is strong.
Even part-time, driving 15 to 20 hours per week targeting peak demand windows, you could gross $25,000 to $40,000 per year with relatively low incremental expenses. Many drivers in this situation find Black significantly more profitable than UberX.
Scenario 2: You Would Need to Buy a Qualifying Vehicle
If you need to purchase a luxury vehicle specifically for Uber Black, the math gets much tighter. A $50,000 vehicle with $800/month payments plus the higher insurance, maintenance, and fuel costs means you need to gross $35,000 to $45,000 per year just to cover your additional vehicle-related expenses, before you have earned a dollar of actual income.
In top markets with strong Black demand (NYC, LA, SF), buying a qualifying vehicle can still make financial sense if you commit to driving 30+ hours per week. In smaller or less dense markets, the risk is considerably higher. We generally would not recommend purchasing a luxury vehicle solely for Uber Black unless you have researched your specific market thoroughly and have a financial cushion.
The Hybrid Approach
Many successful Uber Black drivers take a hybrid approach: they accept Black requests when available and fill downtime with Uber Comfort or UberX trips. This maximizes your earning hours while still capturing premium fares when demand is there. If your vehicle qualifies for multiple tiers, this is typically the most profitable strategy.
For comparison, see how Lyft driver earnings stack up if you are considering multi-apping to fill gaps in Black demand.
Uber Black Driver Earnings FAQ
How much do Uber Black drivers make per trip?
Uber Black trips typically pay $40 to $80+ depending on distance and market. Short trips still earn the minimum fare ($15 to $25), while airport transfers and cross-town rides regularly exceed $60. For context, the median per-trip earnings across all Uber service types is $12.62 based on Gridwise data from 66,952 drivers.
Can you do Uber Black part-time?
Yes, and many Black drivers do exactly that. Targeting peak demand windows (weekday business hours, airport runs, and Friday/Saturday evenings) allows part-time drivers to capture premium fares without the downtime that comes with off-peak hours. Part-time Black drivers working 15 to 20 hours per week in strong markets can gross $1,000 to $1,800+ per week.
How much do Uber Black drivers make in New York City?
NYC is the strongest Uber Black market in the country. Full-time Black drivers in New York report gross earnings of $40 to $60+ per hour, with annual gross income of $80,000 to $120,000+. However, NYC also requires a TLC license and commercial insurance, which adds significant cost. Net earnings after all expenses typically range from $50,000 to $75,000 for full-time drivers.
Do Uber Black drivers get better tips?
Significantly better. While the median tip across all Uber rides is $1.20 per trip (based on Gridwise data), Uber Black riders tip more frequently and at higher amounts. Tips of $5 to $15 are common, and some drivers report that 60-70% of Black riders tip compared to roughly 30-40% of UberX riders. Professional service (opening doors, offering water, maintaining a pristine vehicle) directly impacts your tip rate.
What is the difference between Uber Black and Uber Black SUV?
Uber Black SUV requires a qualifying luxury SUV with seating for 6+ passengers (vehicles like the Cadillac Escalade, Lincoln Navigator, or Mercedes GLS). Black SUV fares are 20 to 30% higher than standard Uber Black. The tradeoff is a more expensive vehicle with higher fuel and maintenance costs, but per-trip earnings can exceed $100 on longer routes.
What is the difference between Uber Black and Uber XL?
Uber Black is the premium luxury tier requiring a black sedan or SUV with specific make/model approval and commercial insurance. Uber XL is the larger-vehicle tier that fits 6 passengers and does not require a luxury vehicle. Any approved SUV, minivan, or large vehicle qualifies. XL pays more per trip than UberX but less than Black. Many drivers who qualify for both tiers run them together, accepting Black requests when available and filling demand gaps with XL trips. The driver featured in our case study earlier in this guide ran four XL trips and two Black trips on the same Saturday, a hybrid pattern that is common in practice.
How do I sign up for Uber Black?
You apply through the Uber driver app or website. You will need to submit your vehicle information for approval, provide proof of commercial insurance (in most markets), pass a background check, and complete a vehicle inspection. In markets requiring a TCP or TLC license, you must obtain that license before you can be approved. The approval process typically takes 1 to 3 weeks. For the general Uber driver sign-up process across all tiers, see our step-by-step guide to becoming an Uber driver.
Start Maximizing Your Premium Earnings
Whether you drive Uber Black, UberX, or a mix of both, the drivers who earn the most are the ones who know their numbers. They track their real hourly rate, they know which days and times generate the best fares in their market, and they log every mile for tax deductions.
The data in this article draws from 66,952 Uber drivers who track their earnings through Gridwise. While we do not break out Uber Black as a separate tier, the aggregate data provides a reliable baseline, and the premium that Black commands above that baseline is well-documented by drivers across the platform.
Keep Reading

How Much Do DoorDash Drivers Make in 2026? (Real Data from 500k+ Dashers)
How much do DoorDash drivers actually make per delivery? Not the inflated "$15 to $25 per hour" claims you see on Reddit or DoorDash's own marketing -- the real numbers, backed by the largest dataset ever published. Based on data from 115,771 DoorDash drivers tracked through Gridwise in 2025, we can show you exactly what Dashers earn per hour, per delivery, and in tips. Whether you are thinking about signing up or want to benchmark your current earnings against other Dashers, this guide breaks down everything: hourly pay, per-delivery earnings, tip income, the best times to dash, and how top earners separate themselves from the pack.
Quick Answer -- How Much Do DoorDash Drivers Make Per Hour?
DoorDash drivers earn a median of $11.26 per hour in total trip pay, based on data from 115,771 Dashers tracked through Gridwise in 2025. When you include all earnings sources (base pay, peak pay, tips, and promotions), the median gross pay rises to $11.63 per hour.
That is the midpoint -- half of all DoorDash drivers earn more, half earn less. The top 25% of Dashers earn $13.49 or more per hour, and the top 10% clear $15.63 per hour. These are gross earnings before expenses like gas and vehicle maintenance.
Those numbers are lower than rideshare platforms like Uber ($21.18/hr median) -- and we will be honest about that throughout this article. But DoorDash has real advantages that the hourly rate alone does not capture: significantly lower vehicle expenses, stronger tip income as a percentage of pay, and extreme scheduling flexibility. Let us break it all down.
DoorDash Driver Earnings Breakdown (2025 Data from 115,771 Dashers)
Here is the complete picture of what DoorDash drivers earn, broken down by every metric that matters. All figures are based on 2025 data from Gridwise's network of 115,771 tracked DoorDash drivers -- the largest sample size of any published DoorDash earnings analysis.
Hourly Earnings
Total trip pay per work hour (base pay + peak pay + tips combined):
- Average: $11.36/hr
- Median: $11.26/hr
- Top 25% (p75): $13.49/hr
- Top 10% (p90): $15.63/hr
Gross pay per work hour (all earnings including bonuses, promotions, and challenge payouts):
- Average: $11.89/hr
- Median: $11.63/hr
- Top 25% (p75): $13.97/hr
- Top 10% (p90): $16.33/hr
The tight gap between average and median tells an important story: DoorDash earnings are relatively consistent across drivers compared to rideshare, where a few high-earning drivers skew the average upward. On DoorDash, the typical Dasher's experience is close to the average experience.
Per-Delivery Earnings
How much DoorDash drivers earn per completed delivery:
- Average: $7.63 per delivery
- Median: $7.44 per delivery
- Top 25% (p75): $8.32 per delivery
- Top 10% (p90): $9.41 per delivery
Gross pay per delivery (including all bonus and promotional pay):
- Average: $8.03 per delivery
- Median: $7.61 per delivery
- Top 25% (p75): $8.69 per delivery
- Top 10% (p90): $10.35 per delivery
The narrower spread in per-delivery earnings (compared to hourly) shows that the biggest differentiator between average and top Dashers is not earning more per delivery -- it is completing more deliveries per hour and cherry-picking higher-value orders.
Tip Earnings
Tips per delivery:
- Average: $3.73 per delivery
- Median: $3.66 per delivery
- Top 25% (p75): $4.37 per delivery
- Top 10% (p90): $5.18 per delivery
Tips per work hour:
- Average: $5.55/hr
- Median: $5.39/hr
- Top 25% (p75): $6.93/hr
- Top 10% (p90): $8.45/hr
Tips are the defining feature of DoorDash earnings. We will dig into why in the tips section below.
Deliveries Per Hour
- Average: 1.51 deliveries per hour
- Median: 1.51 deliveries per hour
- Top 25% (p75): 1.78 deliveries per hour
- Top 10% (p90): 2.02 deliveries per hour
The average Dasher completes about 1.5 deliveries per hour, meaning each delivery cycle (accept, drive to restaurant, wait, pick up, drive to customer, drop off) takes roughly 40 minutes. Top performers squeeze out 2+ deliveries per hour by knowing their zones, avoiding slow restaurants, and stacking orders efficiently.
How DoorDash Pay Works
Understanding DoorDash's pay structure helps you decide which orders to accept and how to maximize your time on the road. Here is how each component works:
Base Pay
DoorDash's base pay ranges from $2 to $10+ per delivery, depending on the estimated time, distance, and desirability of the order. Short, easy deliveries from popular restaurants get lower base pay. Longer drives, orders that have been declined by multiple Dashers, or deliveries in less desirable conditions (bad weather, late night) get higher base pay.
In practice, most standard deliveries have a base pay of $2 to $4. The base pay algorithm is opaque -- DoorDash does not publish exactly how it calculates each offer -- but distance is the biggest factor. A 10-mile delivery will almost always have a higher base than a 2-mile delivery.
Peak Pay
During high-demand periods, DoorDash adds a peak pay bonus -- a flat dollar amount added to every delivery completed in that zone during that window. Peak pay is typically $1 to $3 per delivery, sometimes higher during extreme demand (Super Bowl Sunday, snowstorms, major holidays).
Peak pay is shown on the DoorDash app's map in red and orange zones. If you see a "$2.00 peak pay" notification, every delivery you complete in that area during that time gets an extra $2 on top of base pay and tips.
Tips
Tips are the largest single component of DoorDash driver pay. At a median of $3.66 per delivery, tips represent approximately 49% of total trip pay per delivery ($3.66 of $7.44). On an hourly basis, tips account for about 48% of total hourly earnings ($5.39 of $11.26/hr).
DoorDash customers add tips when placing their order, and these tips are passed through to drivers in full. DoorDash no longer subsidizes base pay with tips (a practice they were criticized for and discontinued in 2019). The tip amount is included in the order offer you see before accepting, though DoorDash may hide a portion of larger tips to prevent cherry-picking based solely on tip size.
DoorDash's Fee Structure
Unlike rideshare where the platform takes a percentage of the fare, DoorDash charges customers delivery fees, service fees, and a small order fee -- but the driver's base pay is calculated separately. Your pay is not a percentage of what the customer paid. This means DoorDash can charge a customer $8 in fees on a $30 order, while your base pay is $2.50 plus a $5 tip.
This structure is why understanding your actual per-delivery and per-hour earnings matters more than looking at what customers pay. The data above shows what Dashers actually receive.
Challenges and Promotions
DoorDash periodically offers bonus challenges:
- Dash Challenges: Complete a set number of deliveries in a time window for a bonus (e.g., "Complete 30 deliveries this weekend, earn an extra $45")
- Guaranteed Earnings: "Earn at least $500 for 50 deliveries this week" -- DoorDash makes up the difference if you fall short
- Sign-up bonuses: New Dashers can earn a DoorDash sign-up bonus worth $100 to $500+ depending on the market and current promotions
These promotions show up in the difference between total trip pay ($11.26/hr median) and gross pay ($11.63/hr median) -- about $0.37 per hour in bonus income for the typical Dasher.
How Much Do DoorDash Drivers Make in Tips?
Tips are the story on DoorDash. At a median of $3.66 per delivery, tips make up approximately 49% of per-delivery earnings and 48% of hourly earnings. This is dramatically different from rideshare platforms:
- DoorDash tips: ~48% of hourly pay ($5.39/hr of $11.26/hr)
- Uber rideshare tips: ~7% of hourly pay ($2.08/hr of $21.18/hr)
Why the massive difference? Three reasons:
1. Customers Tip on Food Cost, Not Just Service
When someone orders $60 worth of food on DoorDash, the app suggests tip amounts based on a percentage of the order total (typically 15%, 20%, 25%). A 20% tip on a $60 order is $12. Compare that to Uber rideshare, where there is no food total to anchor the tip amount -- passengers just pick a flat dollar amount after the ride.
2. Tips Are Added Before the Delivery
DoorDash customers add tips at checkout before the food is even picked up. This means tips are essentially guaranteed once you accept the order (customers rarely remove tips after delivery). On Uber rideshare, tips are added after the ride, and many passengers simply do not bother.
3. Delivery Feels More "Tip-Worthy"
There is a cultural expectation to tip for food delivery that does not exist as strongly for rides. People tip their pizza delivery driver, their DoorDash Dasher, and their Instacart shopper more consistently than they tip their Uber driver.
How to Maximize Your DoorDash Tips
- Dash in affluent neighborhoods -- higher food order totals mean higher percentage-based tips
- Prioritize catering and large orders -- a $150 catering order with a 15% tip is $22.50 for one delivery
- Communicate proactively -- text the customer when you pick up the order and if there are any delays. Simple communication builds goodwill
- Follow delivery instructions carefully -- "Leave at door" means leave at door. "Hand to me" means hand to them. Getting this wrong is the fastest way to lose future tips from repeat customers
- Decline no-tip orders -- orders with $0 tip and $2 base pay are not worth your time. Many experienced Dashers use a minimum $/mile threshold (typically $1.50-$2.00 per mile) to filter orders
Best Times to DoorDash (Delivery Earnings by Day and Time)
When you dash matters almost as much as how many hours you dash. Our data shows clear patterns in delivery earnings by day and time. The following heatmap shows average gross earnings per hour for delivery drivers across all delivery platforms (DoorDash, Uber Eats, Grubhub, and others) -- the patterns apply directly to DoorDash since meal-driven demand follows the same schedule across platforms.
Highest-Earning Delivery Time Slots
- Sunday 6-8pm: $18.28/hr -- Sunday dinner is the single highest-earning window for delivery drivers
- Friday 6-8pm: $17.42/hr -- Friday dinner rush with high order volume and peak pay
- Saturday 6-8pm: $17.48/hr -- Saturday dinner matches Friday for top earnings
- Sunday 3-5pm: $17.12/hr -- late afternoon into early dinner on Sundays stays strong
- Sunday 6-8am: $17.30/hr -- early morning Sunday breakfast orders have surprisingly high pay
Lowest-Earning Delivery Time Slots
- Tuesday 12-2pm: $14.17/hr -- midday Tuesday is the weakest window
- Tuesday 9-11am: $14.25/hr
- Wednesday 9-11am: $14.64/hr
- Thursday 9-11am: $14.43/hr
- Thursday 12-2pm: $14.45/hr
The Dinner Rush Dominates
The 6-8pm dinner window is the highest-earning block on every single day of the week. This should not surprise anyone -- dinner is when the most food gets ordered. But the data shows the premium is significant: dinner hours pay $15.67 to $18.28/hr compared to midday's $14.17 to $16.30/hr. That is up to a 29% premium just for shifting your hours.
Weekends vs Weekdays
Weekend delivery earnings beat weekdays across nearly every time slot:
- Sunday: The highest-earning day overall, with multiple time blocks above $17/hr
- Saturday: Strong across the board, especially dinner and late night
- Tuesday: Consistently the lowest-earning day, with several blocks below $14.50/hr
If you are dashing part-time and can choose your hours, concentrating on Friday through Sunday dinner shifts will maximize your hourly earnings. Weekday midday shifts (especially Tuesday and Wednesday) pay the least.
Late Night Delivers Surprisingly Well
The 12am-2am window pays $14.48 to $16.70/hr depending on the day. Late-night munchies orders often have higher tips and less Dasher competition. Sunday late night ($16.70/hr) and Saturday late night ($16.20/hr) are particularly strong -- people ordering food after midnight tend to tip generously.
How to Earn More on DoorDash
The gap between the median DoorDash driver ($11.26/hr) and the top 25% ($13.49/hr) is $2.23 per hour. Over a 30-hour week, that is an extra $67 per week or $3,480 per year. The top 10% earn $15.63/hr -- nearly 39% more than the median. Here is what they do differently:
Cherry-Pick Orders Strategically
The most impactful thing you can do on DoorDash is decline bad orders. An order offering $3.50 for a 7-mile drive is paying you $0.50 per mile -- well below the cost of operating your vehicle. Most experienced Dashers use a minimum threshold of $1.50 to $2.00 per mile when evaluating orders. A $7 order for a 3-mile delivery ($2.33/mile) is worth taking. A $4 order for a 6-mile drive ($0.67/mile) is not.
Your acceptance rate does not affect your ability to dash in most markets (unlike Uber Pro, where acceptance rate unlocks benefits). DoorDash's Top Dasher program requires a 70% acceptance rate for priority access to orders, but many high-earning Dashers find they earn more by being selective than by chasing Top Dasher status.
Dash During Dinner Rush and Weekends
The heatmap data makes this clear: dinner hours (6-8pm) and weekends pay significantly more than weekday midday shifts. If you can only dash 15-20 hours per week, stack those hours into Friday through Sunday evenings. You will earn substantially more per hour than spreading those same hours across weekday lunches.
Learn Your Zone
Every market has hot spots -- restaurant clusters near residential neighborhoods that generate consistent order volume. After a few weeks of dashing, you will notice patterns: certain restaurant rows ping you with back-to-back orders during dinner, while other areas leave you sitting idle. Park near the clusters that keep you busy, not near random restaurants.
Affluent neighborhoods generate higher-tip orders because the food totals are higher. A $100 sushi order from a high-end neighborhood will tip better than a $12 fast food order from across town. Position yourself accordingly.
Stack Deliveries When Routes Align
DoorDash offers stacked orders -- two pickups from the same restaurant or nearby restaurants going in the same direction. These are golden because you earn two delivery payments while only driving one combined route. Our data shows top performers complete 2.02 deliveries per hour (p90) compared to 1.51 for the average Dasher -- that efficiency gap comes largely from stacking.
Multi-App During Slow Periods
During weekday lunch lulls, running Uber Eats alongside DoorDash can fill dead time. Many full-time delivery drivers toggle between 2-3 apps to minimize idle minutes. Just be sure to turn off other apps once you accept a delivery -- never accept orders from two platforms simultaneously.
Track Everything
You cannot improve what you do not measure. Knowing your actual per-hour rate by day, time, and zone lets you make data-driven decisions about when and where to dash. This is exactly what Gridwise does -- it automatically tracks your DoorDash earnings and shows you your real performance metrics so you can optimize your schedule.
DoorDash Pay vs Other Gig Apps
How does DoorDash stack up against other platforms? Here is a side-by-side comparison of median hourly earnings, based on 2025 Gridwise data across all platforms:
Delivery Platforms
- Walmart Spark: $21.74/hr median (14,666 drivers) -- the highest-paying delivery platform by far
- Grubhub: $15.38/hr median (7,371 drivers)
- Uber Eats: $14.07/hr median (101,709 drivers)
- Instacart: $12.21/hr median (20,538 shoppers)
- DoorDash: $11.26/hr median (115,771 drivers)
Rideshare Platforms
- Uber: $21.18/hr median (66,952 drivers)
- Lyft: $19.48/hr median (31,533 drivers)
Let us be straightforward: DoorDash pays the lowest median hourly rate among major gig platforms. But hourly rate is not the whole story. Here is what the comparison misses:
- Lower vehicle expenses: DoorDash deliveries are typically shorter than rideshare trips. Less mileage means less gas, less wear, and less depreciation. You can also dash on a bike, scooter, or older vehicle that would not qualify for Uber or Lyft.
- No passengers: No wear on your interior, no need for a newer vehicle, no passenger rating anxiety. You pick up food, drop off food.
- No rideshare insurance required: Rideshare drivers need commercial or rideshare-specific insurance ($50-150/month extra). Delivery does not require this in most states.
- Higher tip percentage: DoorDash tips make up ~48% of hourly earnings vs ~7% for Uber rideshare. This means a larger share of your income goes directly to you without platform take.
- Order volume: DoorDash is the largest food delivery platform in the US with roughly 65% market share. In most markets, DoorDash order volume is more consistent than smaller platforms, meaning less idle time.
Is DoorDash Worth It?
At a median of $11.26 per hour in gross pay, DoorDash is not going to compete with a salaried job or even Uber rideshare on hourly rate alone. Let us look at what the numbers actually mean after expenses:
- Gas: DoorDash deliveries average shorter distances than rideshare trips. Typical gas costs run $0.10-0.15 per mile
- Vehicle maintenance: Shorter trips and lower mileage mean less wear -- roughly $0.03-0.07 per mile for delivery vs $0.05-0.10 for rideshare
- Insurance: Standard personal auto insurance covers delivery in most states -- no additional rideshare insurance needed
- Vehicle depreciation: Lower annual mileage means slower depreciation. You can also use older or less expensive vehicles
After expenses, most DoorDash drivers net approximately $9 to $11 per hour. That is lower than rideshare net pay ($15-18/hr for Uber after expenses), but the gap narrows significantly once you account for DoorDash's lower expense profile.
DoorDash works best for people who:
- Need maximum scheduling flexibility -- you can dash for 30 minutes between errands or 8 hours straight
- Want supplemental income -- dashing 10-15 hours per week during dinner rush can add $500-700/month
- Do not have a vehicle that qualifies for rideshare -- DoorDash accepts older cars, and you can deliver on bikes or scooters in many markets
- Prefer not to have passengers -- pickup, drive, drop off, no conversation required
- Multi-app across platforms -- running DoorDash alongside Uber Eats or Grubhub maximizes active delivery time
If you are considering signing up, check the DoorDash driver requirements to make sure you qualify. And make sure you understand the tax side -- our DoorDash tax guide covers everything from quarterly estimated payments to the deductions that can save you thousands. Speaking of deductions, read our guide to tax deductions for gig workers to make sure you are not leaving money on the table when you file.
DoorDash Driver Earnings FAQ
How much can you make DoorDashing full-time?
At the median hourly rate of $11.26, a full-time Dasher working 40 hours per week would gross approximately $450 per week or $23,400 per year before expenses. Top 25% earners working full-time could gross $28,000+ per year. After expenses, full-time DoorDash drivers typically take home $18,700 to $22,900 per year. Most Dashers who treat this as a full-time income multi-app across DoorDash, Uber Eats, and other platforms to increase their effective hourly rate.
How much do DoorDash drivers make per delivery?
The median earnings per delivery is $7.44, with an average of $7.63. This includes base pay and tips combined. Top 10% of Dashers earn $9.41 or more per delivery. Including all promotional pay, the median rises to $7.61 and the top 10% earn $10.35+ per delivery.
How much do DoorDash drivers make in tips?
DoorDash drivers earn a median of $3.66 per delivery in tips, which represents approximately 49% of per-delivery earnings. On an hourly basis, tips contribute a median of $5.39 per hour. Tips are significantly higher on DoorDash (as a percentage of total pay) than on rideshare platforms because customers tip based on food order totals.
Is DoorDash better than Uber Eats?
Uber Eats pays more per hour at the median ($14.07/hr vs $11.26/hr for DoorDash). However, DoorDash has significantly higher order volume in most US markets due to its ~65% market share. Many delivery drivers run both apps and find that DoorDash provides more consistent order flow while Uber Eats offers higher individual payouts. The best strategy is usually to multi-app: accept the best order from whichever platform pings you first. For a detailed look at Uber Eats pay, see our breakdown of Uber Eats driver earnings.
How much do DoorDash drivers make after expenses?
After accounting for gas, maintenance, and depreciation, most DoorDash drivers net approximately $9 to $11 per hour. DoorDash expenses are lower than rideshare because delivery trips are shorter, no rideshare insurance is required, and vehicle requirements are less strict. The IRS standard mileage deduction ($0.725/mile in 2025) can significantly reduce your tax liability -- track every mile to maximize this deduction.
Start Tracking Your DoorDash Earnings Today
The data in this article comes from 115,771 DoorDash drivers who track their earnings through Gridwise -- the largest published dataset of actual Dasher earnings anywhere. The Dashers who earn the most are not just dashing more hours. They are dashing smarter: they know their real per-delivery rate, they know which days and times pay best in their zone, and they track every mile for tax deductions.
Whether you are brand new to DoorDash or a veteran Dasher looking to optimize, the first step is knowing your numbers. How does your actual hourly rate compare to the $11.26 median? Are you dashing during peak hours or leaving money on the table? How much are you really spending on gas per delivery?
Compare your earnings to how much Uber drivers make or other platforms -- and decide whether multi-apping could boost your income.

How Much Do Shipt Shoppers Make? (2025 Data)
How much do Shipt shoppers actually make per order? Not the vague "$15 to $20 per hour" estimates scattered across forums -- the real numbers, from real shoppers, tracked at scale. Based on data from 3,316 Shipt shoppers tracked through Gridwise in 2025, we can show you exactly what Shipt pays per hour, per order, and in tips. The headline finding: Shipt is the highest-paying grocery delivery platform we track, beating Instacart by a wide margin. Whether you are considering signing up or want to see how your earnings compare to other Shipt shoppers, this guide covers everything: hourly pay, per-order earnings, the role tips play, the best times to shop, how to earn more, and the head-to-head comparison with Instacart that every grocery delivery shopper wants to see.
Quick Answer -- How Much Do Shipt Shoppers Make Per Hour?
Shipt shoppers earn a median of $17.44 per hour in total trip pay, based on data from 3,316 shoppers tracked through Gridwise in 2025. When you include all earnings sources (base pay, tips, and bonuses), the median gross pay rises to $18.57 per hour.
That is the midpoint -- half of all Shipt shoppers earn more, half earn less. The top 25% of shoppers earn $21.02 or more per hour, and the top 10% clear $25.05 per hour. These are gross earnings before expenses like gas and vehicle maintenance.
The number that stands out: Shipt's median of $17.44/hr makes it the highest-paying grocery delivery platform in our dataset. For comparison, Instacart shoppers earn a median of $12.21/hr -- meaning Shipt pays 43% more per hour. Per-order pay tells the same story: $16.64 median per Shipt order versus $12.79 per Instacart batch. Tips are strong too, at $5.83 median per order, making up roughly 33% of gross earnings.
Shipt Shopper Earnings Breakdown (2025 Data from 3,316 Shoppers)
Here is the complete picture of what Shipt shoppers earn, broken down by every metric that matters. All figures are based on 2025 data from Gridwise's network of 3,316 tracked Shipt shoppers.
Hourly Earnings
Total trip pay per work hour (base pay + tips combined):
- Average: $17.95/hr
- Median: $17.44/hr
- Top 25% (p75): $21.02/hr
- Top 10% (p90): $25.05/hr
Gross pay per work hour (all earnings including bonuses and promotional pay):
- Average: $19.30/hr
- Median: $18.57/hr
- Top 25% (p75): $22.96/hr
- Top 10% (p90): $27.21/hr
The gap between total trip pay and gross pay ($1.13/hr at the median) reflects bonuses and promotional pay that Shipt offers on top of base order pay and tips. The top 10% of shoppers earn over $25/hr -- comparable to rideshare earnings on Uber and Lyft, which is rare for grocery delivery.
Per-Order Earnings
How much Shipt shoppers earn per completed order:
- Average: $17.34 per order
- Median: $16.64 per order
- Top 25% (p75): $19.26 per order
- Top 10% (p90): $22.74 per order
Gross pay per order (including all bonus and promotional pay):
- Average: $18.51 per order
- Median: $17.83 per order
- Top 25% (p75): $20.57 per order
- Top 10% (p90): $24.28 per order
Shipt per-order earnings are the highest of any grocery delivery platform. The median Instacart shopper earns $12.79 per batch. The median Shipt shopper earns $16.64 per order -- 30% more. Each order involves shopping for groceries in-store and then delivering them, so per-order pay is higher than food delivery apps where you simply pick up a prepared bag. The median DoorDash driver earns $7.44 per delivery -- less than half what a Shipt shopper earns per task.
Tip Earnings
Tips per order:
- Average: $6.15 per order
- Median: $5.83 per order
- Top 25% (p75): $7.54 per order
- Top 10% (p90): $9.88 per order
Tips per work hour:
- Average: $6.45/hr
- Median: $6.14/hr
- Top 25% (p75): $8.34/hr
- Top 10% (p90): $10.75/hr
Tips represent approximately 33% of gross pay on Shipt -- a significant portion of earnings. At $5.83 median per order, Shipt tips are comparable to Instacart tips ($5.39 per batch) in dollar terms. We will break down tip strategy in detail below.
Orders Per Hour
- Average: 1.05 orders per hour
- Median: 1.02 orders per hour
- Top 25% (p75): 1.23 orders per hour
- Top 10% (p90): 1.42 orders per hour
Shipt shoppers complete about one order per hour at the median -- very similar to Instacart's 0.96 batches per hour. This makes sense because both platforms involve the same workflow: drive to the store, walk the aisles picking items, check out, drive to the customer, and deliver. Each order takes roughly 55 to 65 minutes. The top 10% of shoppers complete 1.42 orders per hour (one every 42 minutes), primarily because they know their stores cold and shop with maximum efficiency.
How Shipt Pay Works
Shipt overhauled its pay model in 2023, switching from a transparent commission-based system to an algorithm-based pay structure. Understanding how the current system works is essential for evaluating orders and maximizing your earnings.
Algorithm-Based Pay (Post-2023)
Before 2023, Shipt shoppers earned a straightforward commission: 7.5% of the order total plus tips, with a guaranteed minimum. That model was simple and predictable. Shipt replaced it with an algorithm-based system that calculates pay for each order individually based on several factors:
- Estimated shopping time: Larger orders with more items receive higher base pay because they take longer to shop
- Delivery distance: Farther deliveries pay more to compensate for driving time and fuel
- Order complexity: Orders requiring special handling, heavy items, or unique store layouts may receive higher pay
- Market demand: When order volume is high and shoppers are scarce, pay increases (similar to surge pricing on rideshare)
The switch was controversial among longtime Shipt shoppers, many of whom reported lower pay on certain order types under the new system. However, our 2025 data across 3,316 shoppers shows a median of $17.44/hr -- the highest grocery delivery rate we track. Regardless of how shoppers feel about the algorithm, the actual earnings data tells a strong story.
Base Pay
Base pay on Shipt typically ranges from $8 to $15 per order depending on the factors above. Shipt guarantees a minimum per-order pay (varies by market but generally $8 to $10), so even small orders have a floor. Larger Target or Meijer orders with 40 to 60 items and moderate delivery distance will generally land in the $12 to $15+ base pay range.
Tips
Customers can add a tip when placing their Shipt order, and they can also adjust the tip after delivery. Tips are shown to shoppers in the order offer, making it possible to evaluate total pay before accepting. At a median of $5.83 per order, tips are a critical part of Shipt economics -- shoppers who consistently provide great service build relationships with repeat customers who tip generously.
Order Bundles
Shipt sometimes bundles two orders from the same store into a single delivery run. Bundled orders pay more total but less per individual order than if they were separate. Evaluating bundles requires quick math: is the combined pay worth the extra shopping and delivery time? Experienced shoppers learn to spot good bundles (two small orders from the same store going to nearby addresses) versus bad ones (two large orders going in opposite directions).
Shipt Is Target-Owned
Shipt was acquired by Target in 2017 for $550 million. This means Target orders make up the bulk of Shipt volume in most markets. You will also see orders from Meijer, CVS, Petco, and other retail partners, but Target is the core. If your market has a strong Target presence, Shipt will likely have consistent order volume. In markets without many Target stores, Shipt demand may be limited.
How Much Do Shipt Shoppers Make in Tips?
Tips are a significant driver of Shipt earnings. At a median of $5.83 per order, tips represent approximately 33% of gross pay. Here is how Shipt tips look across the distribution:
- Median tip per order: $5.83
- Average tip per order: $6.15
- Top 25% earn: $7.54+ per order in tips
- Top 10% earn: $9.88+ per order in tips
On an hourly basis, the median Shipt shopper earns $6.14/hr in tips, and the top 10% earn $10.75/hr -- more than some gig workers make in total hourly pay on other platforms.
Why Shipt Tips Are Strong
- Grocery order totals are large: A typical Target or Meijer grocery order is $80 to $150+. Shipt suggests percentage-based tips, so even a modest 5% tip on a $120 order is $6. Larger weekly grocery hauls can generate $15 to $25+ tips.
- Personal shopping creates a tipping dynamic: You are physically selecting produce, finding specific brands, and making replacement decisions. Customers recognize this effort more than a simple food pickup and delivery. The personal service element drives stronger tips.
- Preferred member relationships: Shipt's preferred member system (more on this below) lets customers request specific shoppers. These repeat relationships build loyalty and trust, and loyal customers tend to tip more over time.
How to Maximize Your Shipt Tips
- Communicate proactively about replacements: When an item is out of stock, send a photo of alternatives and ask the customer which they prefer. Never make a substitution without asking. This is the single biggest driver of tip satisfaction on grocery delivery platforms.
- Pick quality produce: Customers notice when you select great-looking fruits and vegetables. Take a few extra seconds to choose well and you will see it reflected in your tips and ratings.
- Deliver organized: Separate cold items from pantry items, keep fragile items protected, and follow delivery instructions exactly. A well-organized delivery creates a positive impression that translates to better tips.
- Build preferred member relationships: Provide excellent service to repeat customers. Once they add you as a preferred shopper, you get first access to their orders -- and preferred customers tend to be the best tippers.
Best Times to Shop Shipt (Delivery Earnings by Day and Time)
When you shop matters as much as how many hours you work. Our data shows clear patterns in delivery earnings by day and time. The following data shows average gross earnings per hour for delivery drivers across all delivery platforms (DoorDash, Uber Eats, Instacart, Shipt, and others) -- the patterns apply to Shipt since grocery demand follows many of the same day-of-week patterns, though Shipt has some unique characteristics we will call out.
Highest-Earning Delivery Time Slots
- Sunday 6-8pm: $18.28/hr -- Sunday dinner is the single highest-earning window for delivery drivers
- Saturday 6-8pm: $17.48/hr -- Saturday dinner rush with high order volume
- Friday 6-8pm: $17.42/hr -- Friday dinner matches Saturday for top earnings
- Sunday 6-8am: $17.30/hr -- early morning Sunday has surprisingly strong pay
- Sunday 3-5pm: $17.27/hr -- late afternoon Sunday stays strong heading into dinner
Lowest-Earning Delivery Time Slots
- Tuesday 12-2pm: $14.17/hr -- midday Tuesday is the weakest window
- Tuesday 9-11am: $14.25/hr
- Thursday 9-11am: $14.43/hr
- Thursday 12-2pm: $14.45/hr
- Tuesday 0-2am: $14.48/hr
Shipt-Specific Timing Patterns
While the heatmap above covers all delivery platforms, Shipt has unique demand patterns driven by grocery shopping habits and Target's customer base:
- Weekend mornings are prime for Shipt: Many families place their weekly grocery order on Saturday or Sunday morning for same-day delivery. Weekend mornings tend to be the strongest window for large Target grocery orders with good tips.
- Target-driven patterns: Since most Shipt orders come from Target, demand correlates with Target shopping patterns. Weekends and early evenings tend to have the highest volume. Target sales events and seasonal promotions can spike Shipt demand.
- Pre-holiday surges: The days before Thanksgiving, Christmas, Easter, and July 4th are among the highest-earning windows for grocery delivery. Order volume and tip generosity both increase during holiday periods.
- Same-day delivery windows: Shipt customers select delivery windows (e.g., 10am-11am, 2pm-3pm). Orders tend to cluster around lunchtime and dinner windows. Scheduling your availability around these windows ensures consistent order flow.
How to Earn More on Shipt
The gap between the median Shipt shopper ($17.44/hr) and the top 25% ($21.02/hr) is $3.58 per hour. Over a 30-hour week, that is an extra $107 per week or $5,564 per year. The top 10% earn $25.05/hr -- 44% more than the median. Here is what separates top earners from average shoppers:
Become a Preferred Shopper
This is the single most important factor for maximizing Shipt earnings. Shipt's preferred member system lets customers designate specific shoppers as their "preferred" shoppers. When a preferred customer places an order, their preferred shoppers get first access to claim it -- before it goes to the general pool. Preferred customers tend to be repeat, high-value shoppers who tip well and order consistently. Building a base of 15 to 20 preferred members can keep your schedule full with high-quality, well-tipping orders.
How to earn preferred status: deliver exceptional service consistently. Communicate well about replacements, pick great produce, deliver on time, and be friendly. After a few great deliveries, many customers will add you as their preferred shopper on their own.
Master Order Selection
Not every Shipt order is worth your time. Before accepting, evaluate:
- Total pay vs item count: A $20 order for 15 items is excellent. A $20 order for 55 items will take much longer. Look for at least $0.40 to $0.75 per item as a rough threshold.
- Tip amount: The tip is visible in the order offer. Orders with generous tips usually come from customers who value the service -- they are likely to become repeat customers and preferred members.
- Delivery distance: Shorter deliveries get you back to availability faster. A 2-mile delivery is almost always better than an 8-mile delivery at the same total pay.
- Store type: Orders from stores you know well are faster to shop. If you have Target memorized, prioritize Target orders over unfamiliar stores.
Shop Faster
Speed is the biggest lever for hourly earnings. If you can complete an order in 45 minutes instead of 60, your effective hourly rate jumps by 33%. Top shoppers build speed by:
- Learning store layouts: Know where every aisle is in your regular stores, especially Target. Shop by aisle order to eliminate backtracking.
- Pre-scanning the order: Review the full item list before you start shopping. Mentally group items by store section so you make one efficient pass.
- Handling replacements efficiently: When an item is out of stock, immediately message the customer with a photo and suggested alternative. Keep shopping other items while you wait for their response.
- Using self-checkout when faster: If lines are long and the store allows it, self-checkout can save 5 to 10 minutes per order.
Protect Your Rating
Your Shipt rating directly affects order access. Higher-rated shoppers see better orders first. A rating drop means you are seeing the orders that top shoppers already passed on -- the low-tip, high-effort jobs. Protect your rating by communicating about every replacement, delivering on time, following delivery instructions exactly, and selecting quality produce.
Multi-App During Slow Periods
When Shipt order volume is low (typically weekday midmornings), running Instacart or DoorDash alongside Shipt can fill dead time. Many grocery delivery shoppers toggle between Shipt and Instacart to minimize idle minutes. Turn off other apps once you accept a Shipt order -- never accept orders from two platforms simultaneously when each order involves 45+ minutes of shopping and delivery.
Shipt vs Instacart -- The Grocery Delivery Pay Comparison
This is the comparison every grocery delivery shopper wants to see. Both Shipt and Instacart involve the same work -- shopping for groceries in-store and delivering them to the customer. Here is how they compare, based on 2025 Gridwise data:
Hourly Earnings
- Shipt: $17.44/hr median (3,316 shoppers)
- Instacart: $12.21/hr median (20,538 shoppers)
- Difference: Shipt pays $5.23 more per hour -- 43% higher
Per-Order Earnings
- Shipt: $16.64 median per order
- Instacart: $12.79 median per batch
- Difference: Shipt pays $3.85 more per order -- 30% higher
Tips
- Shipt: $5.83 median per order (33% of gross pay)
- Instacart: $5.39 median per batch (42% of total pay)
- Difference: Similar dollar amounts, but tips represent a larger share of total pay on Instacart because Instacart base pay is lower
Orders Per Hour
- Shipt: 1.02 median
- Instacart: 0.96 median
- Difference: Nearly identical -- both platforms involve the same shop-and-deliver workflow
When to Choose Shipt
- You are in a market with strong Shipt demand (significant Target presence)
- You want the highest per-hour and per-order pay in grocery delivery
- You are willing to invest in building preferred member relationships for consistent high-quality orders
- You value the preferred shopper system that rewards great service with loyal customer access
When to Choose Instacart
- You are in a market where Shipt has limited availability
- You want more order volume and wider store variety (Costco, Aldi, Kroger, etc.)
- You want the highest tip percentage of any platform (42% of pay on Instacart)
- You prefer delivery-only order options for faster turnaround
The best move for many grocery delivery shoppers: run both apps. Accept the best available order from either platform at any given time. For full Instacart shopper earnings data, see our complete breakdown.
Is Shipt Worth It?
At a median of $17.44 per hour in total trip pay, Shipt is the highest-paying grocery delivery platform we track. That puts it well above Instacart ($12.21/hr) and in the same range as food delivery platforms like Grubhub and Uber Eats. Here is what the numbers look like after expenses:
- Gas: Delivery distances on Shipt are typically short (store to nearby customer), so fuel costs are modest -- roughly $0.08 to $0.12 per mile
- Vehicle maintenance: Lower mileage per order keeps wear and tear costs down -- approximately $0.03 to $0.07 per mile
- Insurance: Standard personal auto insurance covers grocery delivery in most states -- no additional rideshare insurance required
- Phone and insulated bags: Minimal ongoing costs that pay for themselves in better ratings and tips
After expenses, most Shipt shoppers net approximately $14 to $16 per hour. That is a solid rate for flexible, self-scheduled gig work.
Shipt works best for people who:
- Live in markets with strong Shipt demand: Shipt's availability depends heavily on Target store density. In cities with many Target locations, order volume is strong and consistent. In markets with few Target stores, you may struggle to fill your hours.
- Are willing to build customer relationships: The preferred member system is Shipt's biggest advantage over Instacart. Shoppers who invest in building a base of preferred members earn consistently more than those who rely on random order assignment.
- Enjoy grocery shopping: Like Instacart, Shipt is an active gig -- you are on your feet walking aisles, selecting items, and making decisions. If you prefer this to sitting in a car, grocery delivery is a better fit than rideshare.
- Want the highest grocery delivery pay available: The data is clear -- no other grocery delivery platform pays as much per hour as Shipt. If you are choosing one grocery delivery app, Shipt offers the best earnings potential.
Make sure you understand the tax side of gig work. Shipt income is self-employment income, which means quarterly estimated tax payments and tax deductions for gig workers that can save you thousands per year. Track every mile from the start -- the IRS standard mileage deduction alone can significantly reduce your tax bill.
Shipt Shopper Earnings FAQ
How much can you make on Shipt full-time?
At the median hourly rate of $17.44, a full-time Shipt shopper working 40 hours per week would gross approximately $698 per week or $36,275 per year before expenses. Top 25% earners working full-time could gross $43,700+ per year. After expenses, full-time Shipt shoppers typically take home $29,120 to $33,280 per year. Availability depends on your market -- in areas with strong Target presence, filling 40 hours of Shipt orders is feasible. In smaller markets, supplementing with Instacart or DoorDash may be necessary.
How much do Shipt shoppers make per order?
The median earnings per order is $16.64, with an average of $17.34. This includes base pay and tips combined. Top 10% of shoppers earn $22.74 or more per order. Including all promotional pay, the median rises to $17.83 and the top 10% earn $24.28+ per order.
How much do Shipt shoppers make in tips?
Shipt shoppers earn a median of $5.83 per order in tips, which represents approximately 33% of gross pay. On an hourly basis, tips contribute a median of $6.14 per hour. Tips are strong on Shipt because grocery order totals are large, customers appreciate the personal shopping service, and the preferred member system builds loyal tipping relationships over time.
Is Shipt better than Instacart?
Shipt pays significantly more per hour ($17.44 vs $12.21 median) and per order ($16.64 vs $12.79). However, Instacart has more order volume and wider availability in most US markets. Instacart also partners with more stores (Costco, Aldi, Kroger, etc.) while Shipt is primarily Target-based. Many grocery shoppers run both apps and accept the best available order. If your market has strong Shipt demand, it should be your primary grocery delivery platform based on earnings alone.
How much do Shipt shoppers make after expenses?
After accounting for gas, maintenance, and depreciation, most Shipt shoppers net approximately $14 to $16 per hour. Short delivery distances keep per-order expenses low. The IRS standard mileage deduction ($0.725/mile in 2025) can significantly reduce your tax liability -- track every mile to maximize this deduction.
Did Shipt cut pay?
In 2023, Shipt switched from a commission-based pay model (7.5% of order total + tips) to an algorithm-based system. Many longtime shoppers reported this felt like a pay cut on certain order types, especially large orders where the old commission generated more pay. The change was controversial, with shoppers criticizing the lack of transparency in how pay is calculated. That said, our 2025 data across 3,316 shoppers shows Shipt remains the highest-paying grocery delivery platform at $17.44/hr median -- higher than Instacart, DoorDash, and other platforms we track.
Start Tracking Your Shipt Earnings Today
The data in this article comes from 3,316 Shipt shoppers who track their earnings through Gridwise. The shoppers who earn the most are not just shopping more hours. They are shopping smarter: they know their real per-order rate, they know which days and stores pay best, they build preferred member relationships, and they track every mile for tax deductions.
Whether you are brand new to Shipt or a veteran shopper looking to optimize, the first step is knowing your numbers. How does your actual hourly rate compare to the $17.44 median? Are you shopping during peak hours or leaving money on the table? Are your tips higher or lower than the $5.83 average? How much are you really spending on gas per order?
Compare your earnings to Instacart shopper earnings or DoorDash driver earnings -- and decide whether multi-apping could boost your income.
How Much Do Instacart Shoppers Make? (2025 Data from 500k+ Drivers)
How much do Instacart shoppers actually make per batch? Not the vague "$15 to $25 per hour" claims you see floating around Reddit -- the real numbers, from the largest Instacart earnings dataset ever published. Based on data from 20,538 Instacart shoppers tracked through Gridwise in 2025, we can show you exactly what shoppers earn per hour, per batch, and in tips. Instacart is fundamentally different from other gig apps -- you are not just delivering, you are grocery shopping AND delivering, which changes everything about how pay works. Whether you are thinking about signing up or want to benchmark your current earnings against other shoppers, this guide breaks it all down: hourly pay, per-batch earnings, the massive role tips play, the best times to shop, and how top earners separate themselves from average shoppers.
Quick Answer -- How Much Do Instacart Shoppers Make Per Hour?
Instacart shoppers earn a median of $12.21 per hour in total trip pay, based on data from 20,538 shoppers tracked through Gridwise in 2025. When you include all earnings sources (batch pay, tips, and promotions), the median gross pay rises to $12.51 per hour.
That is the midpoint -- half of all Instacart shoppers earn more, half earn less. The top 25% of shoppers earn $14.98 or more per hour, and the top 10% clear $18.44 per hour. These are gross earnings before expenses like gas and vehicle maintenance.
Two things make Instacart stand out from every other gig platform. First, tips make up 42% of total pay -- by far the highest tip percentage of any gig app. Second, per-batch pay is relatively high at $12.79 median, but you only complete about 0.96 batches per hour because each batch involves physically shopping for groceries before you deliver them. That shopping component is what makes Instacart a fundamentally different gig than DoorDash or Uber Eats, and it is why the earnings math works differently too.
Instacart Shopper Earnings Breakdown (2025 Data from 20,538 Shoppers)
Here is the complete picture of what Instacart shoppers earn, broken down by every metric that matters. All figures are based on 2025 data from Gridwise's network of 20,538 tracked Instacart shoppers -- the largest sample size of any published Instacart earnings analysis.
Hourly Earnings
Total trip pay per work hour (batch pay + tips combined):
- Average: $12.93/hr
- Median: $12.21/hr
- Top 25% (p75): $14.98/hr
- Top 10% (p90): $18.44/hr
Gross pay per work hour (all earnings including bonuses, promotions, and challenge payouts):
- Average: $13.30/hr
- Median: $12.51/hr
- Top 25% (p75): $15.40/hr
- Top 10% (p90): $19.04/hr
The gap between median and average is wider on Instacart than on DoorDash, which tells you something important: there is more variation in Instacart earnings. Top shoppers who are fast, strategic about batch selection, and maintain high ratings earn significantly more than average shoppers. The top 10% earn over 50% more per hour than the median -- a bigger gap than you see on most delivery platforms.
Per-Batch Earnings
How much Instacart shoppers earn per completed batch:
- Average: $13.63 per batch
- Median: $12.79 per batch
- Top 25% (p75): $15.50 per batch
- Top 10% (p90): $18.96 per batch
Gross pay per batch (including all bonus and promotional pay):
- Average: $14.02 per batch
- Median: $13.10 per batch
- Top 25% (p75): $15.92 per batch
- Top 10% (p90): $19.41 per batch
Instacart per-batch earnings are noticeably higher than per-delivery earnings on other platforms. The median DoorDash driver earns $7.44 per delivery. The median Instacart shopper earns $12.79 per batch -- 72% more. The reason is simple: Instacart batches are bigger, more complex jobs. You are shopping for 20 to 50 items, navigating a grocery store, making replacement decisions, and then driving to the customer. Each batch takes longer, so per-batch pay is higher to compensate.
Tip Earnings
Tips per batch:
- Average: $6.16 per batch
- Median: $5.39 per batch
- Top 25% (p75): $7.53 per batch
- Top 10% (p90): $10.38 per batch
Tips per work hour:
- Average: $5.97/hr
- Median: $5.11/hr
- Top 25% (p75): $7.44/hr
- Top 10% (p90): $10.65/hr
Tips are the story on Instacart. At $5.39 median per batch, tips represent approximately 42% of total trip pay -- the highest tip percentage of any gig platform we track. We will break down why in the tips section below.
Batches Per Hour
- Average: 0.97 batches per hour
- Median: 0.96 batches per hour
- Top 25% (p75): 1.10 batches per hour
- Top 10% (p90): 1.25 batches per hour
This is the number that makes Instacart fundamentally different from delivery-only apps. The average DoorDash driver completes 1.51 deliveries per hour. The average Instacart shopper completes just 0.96 batches per hour -- about one batch every 62 minutes. Why? Because each batch involves walking through a grocery store, finding and picking every item on the list, checking out, loading the car, and then driving to the customer. The shopping component adds 20 to 30 minutes per batch compared to a food delivery where you just pick up a bag and go.
The top 10% of shoppers complete 1.25 batches per hour (one every 48 minutes). That speed advantage comes from knowing store layouts cold, shopping by aisle order, and minimizing time spent searching for items or waiting at checkout.
Per-Mile Earnings
- Average: $3.46 per mile
- Median: $2.84 per mile
- Top 25% (p75): $4.02 per mile
- Top 10% (p90): $5.68 per mile
Instacart per-mile earnings are strong because delivery distances tend to be short -- grocery stores are usually within a few miles of customers. A median of $2.84 per mile means your vehicle costs are a small fraction of your earnings, making Instacart one of the more efficient gig apps from an expense standpoint.
How Instacart Pay Works
Understanding Instacart's pay structure is essential for deciding which batches to accept and how to maximize your time. Here is how each component works:
Batch Pay (Base Pay)
Instacart's batch pay is the guaranteed minimum you earn for each completed batch, before tips. It is calculated based on several factors:
- Number of items and units: A 50-item batch pays more in base than a 10-item batch because it takes longer to shop
- Delivery distance: Longer drives from the store to the customer increase batch pay
- Estimated effort and time: Instacart's algorithm factors in the expected complexity of the order
- Order demand: Batches that have been waiting or declined by other shoppers get boosted batch pay
In practice, batch pay typically ranges from $7 to $12 for standard orders, though complex multi-item orders or long-distance deliveries can push higher. Instacart guarantees a minimum batch pay (varies by market, but generally $7 to $10), so even small orders have a floor.
Heavy Pay
Orders containing heavy or bulky items trigger an additional heavy pay bonus. This includes things like cases of water, large bags of pet food, gallons of milk in bulk, or anything that adds significant physical effort to the shopping and loading process. Heavy pay is typically $2 to $5 extra per batch, though particularly heavy orders can add more. If you see an order with multiple cases of water, that heavy pay bump is already factored into the batch offer you see on screen.
Distance Bump
When the delivery distance from the store to the customer is longer than average for that market, Instacart adds a distance bump to the batch pay. This is separate from the base calculation and is meant to compensate for the extra driving time and fuel costs. In dense urban areas where most deliveries are under 5 miles, you may rarely see distance bumps. In suburban or rural markets, distance bumps are more common and can add $2 to $5+ to a batch.
Full-Service vs Delivery-Only Orders
Instacart offers two types of orders:
- Full-service orders: You shop for the groceries in-store AND deliver them to the customer. This is the most common type and what most people think of when they picture Instacart. Full-service batches pay more because they require significantly more time and effort.
- Delivery-only orders: The groceries have already been picked and packed by store employees. You simply pick up the bags and deliver them. These batches pay less but are faster to complete -- more like a standard food delivery. Delivery-only orders are common at stores like Costco, Aldi, and some grocery chains that handle their own order fulfillment.
The earnings data in this article includes both full-service and delivery-only batches. If you primarily accept full-service orders, your per-batch pay will tend to be higher than these medians, with lower batches per hour. If you focus on delivery-only, your per-batch pay will be lower but your batches per hour will be higher.
Tips on Instacart
Customers add a tip when placing their Instacart order, and the tip amount is visible to you before you accept the batch. Unlike some platforms, Instacart customers can modify their tip for up to 24 hours after delivery -- they can increase it if you did a great job or decrease it (rare but it happens) if there were issues. In practice, the vast majority of tips remain at the original amount or go up.
The tip is the single largest variable in batch economics. A $30 grocery order from one customer might include a $3 tip, while a $200 weekly grocery haul from another customer might include a $25 tip. This is why batch selection -- and understanding which batches are likely to have good tips -- is the most important skill for maximizing Instacart income.
Why Batches Take Longer Than Deliveries
If you are coming from DoorDash or Uber Eats, the first thing you will notice on Instacart is that each job takes much longer. A typical DoorDash delivery cycle (accept, drive to restaurant, pick up, drive to customer, drop off) takes about 25 to 40 minutes. A typical Instacart full-service batch takes 45 to 75 minutes because you are:
- Driving to the grocery store
- Walking the aisles and finding every item on the list (20 to 50+ items)
- Communicating with the customer about out-of-stock items and replacements
- Waiting in the checkout line
- Loading bags into your car
- Driving to the customer and unloading at their door
This is why the median Instacart shopper completes only 0.96 batches per hour compared to 1.51 deliveries per hour on DoorDash. But it is also why per-batch pay ($12.79 median) and per-batch tips ($5.39 median) are so much higher than per-delivery figures on other platforms.
How Much Do Instacart Shoppers Make in Tips?
Tips are the defining feature of Instacart earnings. At a median of $5.39 per batch, tips make up approximately 42% of total trip pay -- the highest tip percentage of any gig platform we track. Here is how Instacart tips compare across platforms:
- Instacart tips: ~42% of total pay ($5.39 per batch of $12.79)
- DoorDash tips: ~49% of per-delivery pay ($3.66 of $7.44) but a lower dollar amount per task
- Uber rideshare tips: ~7% of hourly pay ($2.08/hr of $21.18/hr)
In dollar terms, Instacart tips per task ($5.39 median) are the highest of any platform -- 47% more per task than DoorDash ($3.66) and nearly triple Uber rideshare tips on a per-trip basis. Why are Instacart tips so much higher?
1. Grocery Order Totals Are Large
The average Instacart grocery order is $80 to $150+. Instacart suggests tip amounts as a percentage of the order total (typically 5%, 10%, 15%, 20%). Even a modest 10% tip on a $120 grocery order is $12. Compare that to a DoorDash food order averaging $30 to $40 where a 20% tip is $6 to $8. The underlying order value drives larger tips.
2. Shoppers Provide Hands-On Service
An Instacart shopper does significantly more work than a delivery driver. You are walking through a store for 30 to 45 minutes, selecting produce by hand, finding specific brands, communicating about replacements, and then delivering everything to the customer's door. Customers recognize this effort. There is a stronger sense of personal service -- someone is literally picking out your avocados and making judgment calls on ripeness. That creates a tipping dynamic more similar to a personal assistant than a delivery driver.
3. Repeat Customer Relationships
Many Instacart customers order weekly from the same stores. Shoppers who consistently deliver excellent service to repeat customers often see tips increase over time. A customer who starts at 10% may bump to 15% or 20% after a few great experiences. This repeat dynamic does not exist on food delivery platforms where the restaurant changes with every order.
How to Maximize Your Instacart Tips
- Communicate proactively about replacements: When an item is out of stock, send a photo of the alternatives and ask the customer which they prefer. Never just make a replacement without asking. This is the number one tip driver on Instacart.
- Choose quality produce: Customers notice when their bananas are bruised or their strawberries are soft. Take 10 extra seconds to pick good produce and it will pay off in better tips and ratings.
- Deliver organized and undamaged: Separate cold items from pantry items, keep bread and eggs on top, and use insulated bags if you have them. Customers who open their door to a well-organized delivery tip more and rate higher.
- Be responsive to messages: Instacart customers can message you during the shop. Respond quickly, be friendly, and be solution-oriented. Customers who feel like they are in good hands tip more generously.
- Prioritize high-tip batches: The tip is visible before you accept. All else being equal, a $15 batch with a $10 tip is better than a $20 batch with a $2 tip -- the first customer values your service and is likely a good repeat customer.
Best Times to Shop Instacart (Delivery Earnings by Day and Time)
When you shop matters as much as how many hours you work. Our data shows clear patterns in delivery earnings by day and time. The following data shows average gross earnings per hour for delivery drivers across all delivery platforms (DoorDash, Uber Eats, Instacart, and others) -- the patterns apply to Instacart since grocery demand follows many of the same day-of-week patterns, though Instacart has some unique characteristics we will call out.
Highest-Earning Delivery Time Slots
- Sunday 6-8pm: $18.28/hr -- Sunday dinner is the single highest-earning window for delivery drivers
- Saturday 6-8pm: $17.48/hr -- Saturday dinner rush with high order volume
- Friday 6-8pm: $17.42/hr -- Friday dinner matches Saturday for top earnings
- Sunday 6-8am: $17.30/hr -- early morning Sunday has surprisingly strong pay
- Sunday 3-5pm: $17.27/hr -- late afternoon Sunday stays strong heading into dinner
Lowest-Earning Delivery Time Slots
- Tuesday 12-2pm: $14.17/hr -- midday Tuesday is the weakest window
- Tuesday 9-11am: $14.25/hr
- Thursday 9-11am: $14.43/hr
- Thursday 12-2pm: $14.45/hr
- Tuesday 0-2am: $14.48/hr
Instacart-Specific Timing Patterns
While the heatmap above covers all delivery platforms, Instacart has some unique demand patterns driven by grocery shopping habits:
- Sunday mornings are golden for Instacart: Many families place their weekly grocery order on Sunday morning for same-day delivery. The Sunday 6-8am slot ($17.30/hr) and 9-11am slot ($16.04/hr) are particularly good for Instacart shoppers because grocery orders flow in early while food delivery is still quiet.
- Weekend mornings outperform weekday mornings: Saturday and Sunday mornings consistently pay more because weekend grocery ordering is heaviest in the morning hours. If you shop Instacart on weekends, start early.
- Pre-holiday surges: The days before Thanksgiving, Christmas, Easter, and July 4th are among the highest-earning windows for Instacart specifically. Grocery order volume spikes as people stock up, and tips tend to be more generous during holiday periods.
- Monday grocery restocking: Monday mornings can be productive for Instacart as some customers restock at the start of the week, especially in suburban markets with families.
The Dinner Rush Still Wins Overall
The 6-8pm window is the highest-earning block on every single day of the week across all delivery platforms. For Instacart specifically, evening batches tend to be smaller "tonight's dinner ingredients" orders rather than full weekly grocery hauls. These batches are faster to complete but may have smaller tips. The sweet spot for Instacart shoppers who want maximum earnings is often weekend mornings through early afternoon for big grocery batches with big tips, then dinner hours for faster supplemental batches.
How to Earn More on Instacart
The gap between the median Instacart shopper ($12.21/hr) and the top 25% ($14.98/hr) is $2.77 per hour. Over a 30-hour week, that is an extra $83 per week or $4,316 per year. The top 10% earn $18.44/hr -- over 51% more than the median. Here is what separates them:
Master Batch Selection
The single most impactful skill on Instacart is knowing which batches to accept and which to skip. Before accepting any batch, evaluate:
- Total pay vs item count: A $15 batch for 10 items is excellent. A $15 batch for 50 items will take three times as long. Experienced shoppers look for a minimum of roughly $0.50 to $1.00 per item.
- Tip amount: A batch with a $10 tip on a $5 batch pay is a customer who values service -- likely a good experience. A batch with $0 tip and $12 batch pay is Instacart padding the pay because no one else wants the order. The first is usually the better bet.
- Delivery distance: Short deliveries get you back to the store (or available for the next batch) faster. A 2-mile delivery is almost always better than a 10-mile delivery at the same total pay.
- Store familiarity: Accept batches from stores you know. If you have the layout of your local Costco memorized, you will shop twice as fast there as at a store you have never visited.
Shop Faster
Speed is the multiplier for Instacart earnings. If you can complete a batch in 45 minutes instead of 65 minutes, your effective hourly rate jumps by 44%. Top shoppers build speed through:
- Learning store layouts: Know where every aisle is in your regular stores. Shop by aisle order, not by list order. This eliminates backtracking.
- Pre-planning the route through the store: Scan the full item list before you start shopping. Mentally group items by store section so you make one efficient pass.
- Using self-checkout when faster: If the store allows it and lines are long, self-checkout can save 5 to 10 minutes per batch.
- Handling replacements efficiently: When an item is out of stock, immediately message the customer with a photo and a suggested replacement. Do not stand in the aisle waiting for a response -- keep shopping other items and circle back.
Protect Your Rating
Your Instacart rating directly affects which batches you see. 5-star shoppers see the best batches first, before they are offered to lower-rated shoppers. A drop from 5.0 to 4.7 stars can mean you are only seeing the batches that higher-rated shoppers already passed on -- the low-tip, high-effort orders nobody wants. Protect your rating by:
- Communicating about every replacement -- never make a substitution without asking
- Delivering on time -- if you are running behind, message the customer
- Following delivery instructions exactly -- "Leave at door" vs "Hand to customer" matters
- Choosing quality produce and checking expiration dates -- damaged items tank your rating
Multi-App During Slow Periods
When Instacart batch volume is low (weekday midmornings, for example), running DoorDash or Uber Eats alongside Instacart can fill dead time. Many full-time gig workers toggle between grocery delivery and food delivery to minimize idle minutes. Just turn off other apps once you accept an Instacart batch -- never accept orders from two platforms simultaneously, especially on Instacart where each batch can take 45+ minutes.
Track Everything
You cannot improve what you do not measure. Knowing your actual per-hour rate by day, time, store, and batch type lets you make data-driven decisions about when and where to shop. This is exactly what Gridwise does -- it automatically tracks your Instacart earnings and shows you your real performance metrics so you can optimize your schedule and batch selection strategy.
Instacart Pay vs Other Gig Apps
How does Instacart stack up against other platforms? Here is a side-by-side comparison of median hourly earnings, based on 2025 Gridwise data across all platforms:
Grocery Delivery Platforms
- Shipt: $17.44/hr median -- the highest-paying grocery delivery platform
- Instacart: $12.21/hr median (20,538 shoppers)
The Shipt vs Instacart comparison is the most relevant head-to-head because both platforms involve grocery shopping and delivery. Shipt pays $5.23 more per hour at the median -- a significant difference. However, Shipt has less availability in many markets and a smaller order volume. In cities where both platforms are active, many shoppers run both and accept whichever offers the better batch at any given moment.
Food Delivery Platforms
- Uber Eats: $14.07/hr median (101,709 drivers)
- Grubhub: $15.38/hr median (7,371 drivers)
- DoorDash: $11.26/hr median (115,771 drivers)
Rideshare Platforms
- Uber: $21.18/hr median (66,952 drivers)
- Lyft: $19.48/hr median (31,533 drivers)
At $12.21/hr, Instacart sits in the middle of the delivery pack -- below Uber Eats and Grubhub, above DoorDash. But the comparison is more nuanced than hourly rate alone:
- Tips are highest on Instacart: At 42% of total pay, Instacart tips are the highest of any platform by percentage. In dollar terms per task, Instacart tips ($5.39 median) beat every other platform.
- Per-batch pay is high: At $12.79 median per batch, each Instacart job pays significantly more than a DoorDash delivery ($7.44) or Uber Eats delivery. You just complete fewer of them per hour.
- Per-mile earnings are strong: At $2.84 median per mile, Instacart is efficient from an expense standpoint. Short grocery delivery distances keep your fuel costs low.
- Different kind of work: Instacart is physically active -- you walk 3,000 to 5,000+ steps per batch. Some people prefer this to sitting in a car. It is less monotonous than food delivery but more physically demanding.
Is Instacart Worth It?
At a median of $12.21 per hour in gross pay, Instacart falls in the middle range of gig platform earnings. Let us look at what the numbers actually mean after expenses:
- Gas: Instacart delivery distances are typically short (store to nearby customer), so gas costs are modest -- roughly $0.08 to $0.12 per mile on average
- Vehicle maintenance: Lower mileage per batch means less wear on your vehicle -- approximately $0.03 to $0.07 per mile
- Insurance: Standard personal auto insurance covers grocery delivery in most states -- no additional rideshare insurance required
- Phone and insulated bags: Minimal ongoing costs -- a good set of insulated bags ($20-30) pays for itself in better ratings and tips
After expenses, most Instacart shoppers net approximately $10 to $12 per hour. The strong per-mile earnings ($2.84 median) keep your expense ratio lower than rideshare, where you drive significantly more miles per dollar earned.
Instacart works best for people who:
- Enjoy the shopping process: If walking through a grocery store selecting items sounds more appealing than sitting in traffic, Instacart is a better fit than rideshare or food delivery
- Are fast and organized shoppers: Speed is the biggest lever for Instacart earnings. If you are the type of person who navigates a grocery store efficiently, you have a natural advantage
- Want the highest tips in gig work: 42% of pay coming from tips means your service quality directly drives your income more than on any other platform
- Want supplemental income on weekends: Shopping 10 to 15 hours on weekends during peak grocery ordering times can add $500 to $700+ per month
- Prefer physical activity: Instacart is a workout -- you are on your feet, walking aisles, lifting groceries. If you want to get paid to move, this beats sitting in a car all day
If you are considering signing up, check the Instacart shopper requirements to make sure you qualify. New shoppers may also be eligible for an Instacart sign-up bonus depending on market and current promotions. And make sure you understand the tax side -- gig income is self-employment income, which means quarterly estimated tax payments and tax deductions for gig workers that can save you thousands per year. Track every mile from the start -- the IRS standard mileage deduction alone can reduce your tax bill significantly.
Instacart Shopper Earnings FAQ
How much can you make on Instacart full-time?
At the median hourly rate of $12.21, a full-time Instacart shopper working 40 hours per week would gross approximately $488 per week or $25,400 per year before expenses. Top 25% earners working full-time could gross $31,100+ per year. After expenses, full-time Instacart shoppers typically take home $20,800 to $24,960 per year. Many full-time shoppers also run Shipt, DoorDash, or Uber Eats alongside Instacart to increase their effective hourly rate and minimize idle time between batches.
How much do Instacart shoppers make per batch?
The median earnings per batch is $12.79, with an average of $13.63. This includes batch pay and tips combined. Top 10% of shoppers earn $18.96 or more per batch. Including all promotional pay, the median rises to $13.10 and the top 10% earn $19.41+ per batch.
How much do Instacart shoppers make in tips?
Instacart shoppers earn a median of $5.39 per batch in tips, which represents approximately 42% of total trip pay -- the highest tip percentage of any gig platform. On an hourly basis, tips contribute a median of $5.11 per hour. Tips are high on Instacart because grocery order totals are large and customers appreciate the hands-on personal shopping service.
Is Instacart better than Shipt?
Shipt pays more per hour at the median ($17.44/hr vs $12.21/hr for Instacart). However, Instacart has significantly more order volume and availability in most US markets. Instacart also has the highest tip percentage of any platform at 42%. Many grocery delivery shoppers run both apps and accept the best available batch from either platform. If your market has strong Shipt demand, it is worth running both.
Is Instacart better than DoorDash?
Instacart pays slightly more per hour ($12.21 vs $11.26 median) and significantly more per task ($12.79 vs $7.44 per delivery). Instacart tips are also larger ($5.39 vs $3.66 per task). The tradeoff is that Instacart batches take longer and are more physically demanding -- you are walking through a store, not just picking up a bag. DoorDash is faster, simpler, and has higher order volume. Many gig workers run both and switch between them based on demand. For a full comparison, see our DoorDash driver earnings breakdown.
How much do Instacart shoppers make after expenses?
After accounting for gas, maintenance, and depreciation, most Instacart shoppers net approximately $10 to $12 per hour. Instacart expenses are lower per dollar earned than rideshare because delivery distances are short and per-mile earnings are strong ($2.84 median). The IRS standard mileage deduction ($0.725/mile in 2025) can significantly reduce your tax liability -- track every mile to maximize this deduction.
Do Instacart shoppers get paid for shopping time?
Yes. Instacart batch pay covers the entire job -- shopping time, checkout, driving, and delivery. There is no separate "shopping pay" and "delivery pay." When you accept a batch, the quoted pay covers everything from the moment you start shopping to the moment you drop off the groceries. The hourly figures in this article ($12.21 median) reflect total active time, including in-store shopping.
If you have questions about the Instacart app, account issues, or batch problems, check our guide to Instacart shopper support for the fastest ways to get help.
Start Tracking Your Instacart Earnings Today
The data in this article comes from 20,538 Instacart shoppers who track their earnings through Gridwise -- the largest published dataset of actual Instacart shopper earnings anywhere. The shoppers who earn the most are not just shopping more hours. They are shopping smarter: they know their real per-batch rate, they know which days and stores pay best, and they track every mile for tax deductions.
Whether you are brand new to Instacart or a veteran shopper looking to optimize, the first step is knowing your numbers. How does your actual hourly rate compare to the $12.21 median? Are you shopping during peak hours or leaving money on the table? Are your tips higher or lower than the 42% average? How much are you really spending on gas per batch?
Compare your earnings to Uber driver earnings or DoorDash driver earnings -- and decide whether multi-apping could boost your income.

How Much Do Uber Eats Drivers Make in 2026? (Data from 500k+ Drivers)
How much do Uber Eats drivers actually make per delivery? Not the "$10 to $25 per hour" guesswork you find on forums and recycled blog posts -- the real numbers from real drivers. Based on data from Uber Eats drivers tracked through Gridwise in 2025, we can tell you exactly what delivery drivers earn. The median Uber Eats driver makes $14.07 per hour in total trip pay -- and that is before you factor in tips, which add a median of $6.26 per hour on top. Unlike Uber rideshare, Uber Eats lets you deliver with almost any vehicle -- cars, bikes, scooters, and even on foot in some markets. That lower barrier to entry makes it one of the most accessible gig platforms available. Whether you are considering signing up or benchmarking your current delivery earnings, this guide covers everything: hourly pay, per-delivery earnings, tip income, the best times to deliver, and how Uber Eats stacks up against DoorDash and Uber rideshare.
Quick Answer -- How Much Do Uber Eats Drivers Make Per Hour?
Uber Eats drivers earn a median of $14.07 per hour in total trip pay, based on data from 101,709 drivers tracked through Gridwise in 2025. When you include all earnings (base pay, tips, promotions, and bonuses), the median gross pay rises to $15.03 per hour.
That is the midpoint -- half of all Uber Eats drivers earn more, half earn less. The top 25% of Uber Eats drivers earn $17.02 or more per hour, and the top 10% clear $20.83 per hour. These are gross earnings before expenses like gas, insurance, and vehicle maintenance.
Here is another way to think about it: the median Uber Eats driver earns $8.16 per delivery and completes about 1.70 deliveries per hour. That faster turnover is one reason UE drivers out-earn DoorDash drivers, who only complete 1.51 deliveries per hour.
One critical detail most articles miss: tips make up a massive share of Uber Eats earnings. The median tip is $3.73 per delivery -- roughly 46% of the base delivery pay. We will break that down in detail below.
Uber Eats Earnings Breakdown
Here is the full picture of what Uber Eats drivers earn, broken down by every metric that matters. All figures are based on 2025 data from Gridwise's network of tracked drivers.
Hourly Earnings
Total trip pay per work hour (base fare + surge + tips combined):
Gross pay per work hour (all earnings including bonuses and promotions):
The gap between total trip pay ($14.07 median) and gross pay ($15.03 median) reflects the additional income from Uber promotions like quests and consecutive delivery bonuses. That extra dollar per hour adds up -- over a 30-hour week, it is an additional $29 in your pocket.
Per-Delivery Earnings
How much Uber Eats drivers earn per completed delivery:
Gross pay per delivery (including all bonuses and promotions):
The narrower spread between median ($8.16) and top 10% ($12.00) on per-delivery pay compared to rideshare tells an important story: Uber Eats deliveries are more uniform in value than rideshare trips. You are less likely to land a huge $30+ trip, but you are also less likely to get stuck with a $4 minimum fare.
Deliveries Per Hour
Uber Eats drivers complete deliveries faster than DoorDash drivers (1.70 vs 1.51 median deliveries per hour). That 13% faster turnover means more earning opportunities per hour on the road. Top 10% Uber Eats drivers are completing over two deliveries per hour, which is an extremely efficient pace for food delivery.
How Uber Eats Pay Works
Understanding how Uber Eats calculates your pay helps you decide which orders to accept and when to drive. Uber Eats delivery pay comes from several components, and it works differently from rideshare pay.
Base Pay
Every Uber Eats delivery includes a base pay amount that Uber calculates using several factors: the estimated time of the delivery, the distance to the restaurant and then to the customer, and the desirability of the order. Unlike rideshare, where fares are primarily distance and time-based, Uber Eats base pay is more opaque -- Uber uses an algorithm that weighs multiple factors to set each offer.
Base pay for a typical delivery ranges from $2 to $8 before tips, depending on distance and complexity. Stacked orders (picking up from two restaurants or delivering to two customers on one trip) tend to pay more per batch but less per individual delivery.
Trip Supplement
Uber adds a trip supplement when an order is not attractive enough to get accepted by nearby drivers. If an order has been declined multiple times or involves a long drive to a far-off customer, Uber increases the payout to incentivize acceptance. This is why patience can pay off -- orders that sit unclaimed often get sweetened.
Surge and Boost Zones
During high-demand periods, Uber activates surge pricing or boost zones for deliveries. Surge adds a multiplier or flat bonus to your base pay. Boost zones are pre-scheduled promotions Uber shows you in the app -- for example, "1.3x pay in downtown between 6pm and 9pm." These are predictable and strategic drivers plan their shifts around them.
Promotions and Quest Bonuses
Uber regularly offers bonus incentives to delivery drivers:
These promotions are reflected in the gap between total trip pay ($14.07/hr median) and gross pay ($15.03/hr median) in our data. Drivers who consistently hit quest targets earn meaningfully more.
Uber's Service Fee
Uber takes a service fee on every delivery. The exact percentage varies by market and order type, but it typically ranges from 15% to 30% of the delivery fee (before tips). Critically, Uber does not take a cut of your tips -- 100% of customer tips go directly to you. All earnings figures in this article reflect what drivers actually receive after Uber's cut.
How Much Do Uber Eats Drivers Make in Tips?
Tips are where Uber Eats delivery really separates itself from other gig work. Food delivery customers tip significantly more than rideshare passengers, and tips make up a larger share of your total pay on Uber Eats than on almost any other platform.
Tip Earnings Per Delivery
Tip Earnings Per Hour
Let those numbers sink in. The median Uber Eats driver earns $6.26 per hour just in tips. That is more than many rideshare drivers earn in total tips per hour ($2.08/hr median for Uber rideshare). The top 10% of Uber Eats drivers earn over $11 per hour in tips alone -- that is essentially an entire second income stream on top of base pay.
Why Tips Are So High on Uber Eats
The median tip of $3.73 per delivery represents approximately 46% of the median base delivery pay ($8.16). Compare that to Uber rideshare, where tips are roughly 6-7% of trip pay. Several factors drive higher tipping on food delivery:
How to Maximize Your Uber Eats Tips
Since tips represent nearly half of your per-delivery earnings, small improvements in tip rates compound quickly:
Best Times to Deliver Uber Eats (Earnings by Day and Time)
When you deliver matters as much as how you deliver. Gridwise tracks delivery earnings across all major platforms by day of week and time block. Here is what the data shows for average gross earnings per hour across delivery platforms.
Dinner Rush Dominates (6pm-8pm)
The highest-earning window for delivery drivers is the dinner rush from 6pm to 8pm. This is true every single day of the week, but especially on weekends:
Sunday dinner is king for delivery earnings. The $18.28/hr average is 29% higher than the lowest-earning time blocks during the week. If you can only deliver during one window, make it Sunday evening.
Afternoon Rush (3pm-5pm)
The pre-dinner window is the second-best time block on most days, as early dinner orders and snack deliveries pick up:
Late Night Delivers Strong Pay (12am-5am)
One surprising finding in the data: the late-night and early morning hours pay well above average. The 3am-5am window averages $16-$17/hr across most days, and midnight to 2am consistently outperforms midday hours:
Late-night orders tend to have higher base pay (fewer drivers available) and customers ordering late often tip generously. If you are a night owl, this is a lucrative window most drivers overlook.
Avoid Midweek Midday
The lowest-earning times are consistently Tuesday through Thursday from 9am to 2pm:
The difference between the best and worst time blocks is over $4 per hour. Over a 20-hour delivery week, choosing the right shifts versus the wrong ones is the difference between $365 and $285 -- an extra $80 per week or $4,000+ per year.
How to Earn More on Uber Eats
The difference between the median Uber Eats driver ($14.07/hr) and the top 10% ($20.83/hr) is nearly $7 per hour. That gap is not luck -- it is strategy. Here is what separates top earners from the average driver.
Benchmark Against the Best
Know your targets. If you are earning the median ($14.07/hr), here is what leveling up looks like:
Multi-App to Fill Dead Time
The most effective way to increase your hourly earnings is to run multiple delivery apps simultaneously. When Uber Eats is slow, DoorDash or Grubhub might have orders waiting. The key rules for multi-apping:
Position Near Restaurant Clusters
Where you wait between deliveries matters enormously. Park near dense restaurant areas -- shopping centers, downtown strips, food courts -- rather than residential neighborhoods. Being closer to restaurants means faster pickup times and more offers per hour. The data shows top drivers complete 2.28 deliveries per hour versus the median 1.70 -- much of that efficiency comes from smart positioning.
Prioritize High-Value Time Blocks
Based on the heatmap data above, structure your delivery schedule around the highest-paying windows:
Be Strategic About Order Acceptance
Not every Uber Eats order is worth taking. Experienced drivers evaluate each offer based on:
Remember, as an independent contractor, you have the right to decline any order. Your acceptance rate does not affect your account standing on Uber Eats the way it might on other platforms. Be selective and prioritize profitability over volume. Before tax season, make sure you are tracking all deductible expenses -- review our guide to tax deductions for gig workers so you keep more of what you earn.
Uber Eats vs Uber Rideshare vs DoorDash
How does Uber Eats compare to driving Uber rideshare or delivering for DoorDash? Here is a side-by-side comparison using real Gridwise data.
Uber Eats vs DoorDash
Uber Eats is the highest-paying major delivery platform based on our data:
The pay advantage is clear: Uber Eats drivers earn more per hour AND complete more deliveries per hour than DoorDash drivers. The combination of higher per-delivery pay and faster turnover makes Uber Eats the stronger platform for delivery-focused gig workers.
Uber Eats vs Uber Rideshare
Rideshare pays significantly more per hour, but the comparison is more nuanced than just the hourly rate:
For a deeper dive into rideshare numbers, see our full breakdown of how much Uber rideshare drivers make.
When Each Platform Makes Sense
Is Uber Eats Worth It in 2026?
Based on the data, Uber Eats is the best-paying major delivery platform and one of the most accessible entry points into gig work. Here is the honest assessment.
The Case for Uber Eats
The Realistic Considerations
Who Uber Eats Is Best For
Uber Eats Driver Pay FAQ
Can you make $1,000 a week doing Uber Eats?
At the median pay of $14.07/hr, you would need about 71 hours per week to hit $1,000. At the top 25% level ($17.02/hr), it drops to about 59 hours. At the top 10% ($20.83/hr), you would need about 48 hours. It is possible but requires significant weekly hours. A more realistic target for a full-time delivery driver working 40 hours per week is $560 to $830 per week depending on skill level and market.
Does Uber Eats pay more than DoorDash?
Yes. Based on Gridwise data from 101,709 Uber Eats drivers and comparable DoorDash driver data, Uber Eats pays a median of $14.07/hr vs DoorDash's $11.26/hr -- a 25% premium. Uber Eats drivers also complete more deliveries per hour (1.70 vs 1.51), contributing to the higher hourly earnings.
How much do Uber Eats drivers make in tips?
The median Uber Eats driver earns $3.73 per delivery in tips, which translates to $6.26 per hour. The top 10% earn $6.20 per delivery and $11.09 per hour in tips. Tips represent approximately 46% of base delivery pay on Uber Eats -- significantly higher than the roughly 6-7% tip rate on Uber rideshare.
Is Uber Eats better than driving Uber?
It depends on your situation. Uber rideshare pays more -- $21.18/hr median vs $14.07/hr for Uber Eats. But rideshare requires a newer qualifying vehicle and carrying passengers. Uber Eats has a lower barrier to entry (bikes, scooters, older cars), lower vehicle costs, and no passenger management. Many drivers do both and accept whichever offer pays more at any given time.
What is the best time to deliver Uber Eats?
The highest-paying window is the dinner rush from 6pm to 8pm, especially on weekends. Sunday dinner pays the most at $18.28/hr average. Late night (12am-5am) is a surprisingly strong window at $15-$17/hr. The lowest-paying times are Tuesday through Thursday mornings (9am-2pm) at $14-$14.50/hr. Focusing on peak hours can earn you over $4/hr more than driving during slow times.
Start Tracking Your Uber Eats Earnings Today
The data is clear: Uber Eats is the highest-paying major delivery platform at $14.07 per hour median, beating DoorDash by 25%. Tips are the differentiator -- at $3.73 median per delivery, they represent nearly half of your per-delivery income and $6.26 per hour in additional earnings. The top 10% of Uber Eats drivers earn $20.83 per hour, proving that strategic driving -- working peak hours, positioning near restaurant clusters, and being selective about orders -- pays off significantly.
Whether you are just starting out or looking to benchmark your current earnings, the key is tracking your real numbers against these benchmarks. Knowing exactly what you earn per hour, per delivery, and in tips -- broken down by day and time -- is how you move from the median to the top 25% and beyond.

How Much Do Spark Drivers Make? (2025 Data from 500k+ Drivers)
How much do Walmart Spark drivers actually make in 2026? Not the vague "$15 to $25 per hour" estimates recycled across the internet -- the real numbers from the largest Spark driver earnings dataset ever published. Based on data from 14,666 Spark drivers tracked through Gridwise in 2025, Spark is the highest-paying delivery platform in the United States, with a median hourly rate of $21.74. That is not a typo. Spark drivers out-earn DoorDash Dashers by nearly double, beat Instacart shoppers by $9.53 per hour, and even edge out Uber driver earnings at $21.18 per hour -- and Uber drivers carry passengers. Whether you are considering signing up for Spark or want to benchmark your current earnings, this guide breaks down everything: hourly pay, per-task earnings, tip income, the best times to deliver, and how top Spark drivers maximize their income.
Quick Answer -- How Much Do Spark Drivers Make Per Hour?
Spark drivers earn a median of $21.74 per hour in total trip pay -- the highest of any delivery platform -- based on data from 14,666 Spark drivers tracked through Gridwise in 2025. When you include all earnings sources (base pay, tips, incentives, and bonus payouts), the median gross pay rises to $22.57 per hour.
That is the midpoint -- half of all Spark drivers earn more, half earn less. The top 25% of Spark drivers earn $25.55 or more per hour, and the top 10% clear $30.26 per hour. These are gross earnings before expenses like gas and vehicle maintenance.
To put that in perspective: Spark's median hourly rate beats every other delivery platform by a wide margin. DoorDash driver earnings come in at $11.26 per hour median. Uber Eats pays $14.07. Even Uber rideshare -- where you carry passengers and put significantly more miles on your car -- pays a median of $21.18 per hour, which is $0.56 less than Spark. For a delivery-only platform, those numbers are exceptional.
Spark Driver Earnings Breakdown (2025 Data from 14,666 Drivers)
Here is the complete picture of what Spark drivers earn, broken down by every metric that matters. All figures are based on 2025 data from Gridwise's network of 14,666 tracked Spark drivers.
Hourly Earnings
Total trip pay per work hour (base pay + tips combined):
- Average: $22.71/hr
- Median: $21.74/hr
- Top 25% (p75): $25.55/hr
- Top 10% (p90): $30.26/hr
Gross pay per work hour (all earnings including incentives, bonuses, and promotional payouts):
- Average: $23.65/hr
- Median: $22.57/hr
- Top 25% (p75): $26.78/hr
- Top 10% (p90): $31.95/hr
The gap between total trip pay and gross pay ($0.83 per hour at the median) represents Spark's incentive and bonus programs. That is a meaningful supplement -- roughly $33 extra per 40-hour week -- and it is higher than the bonus gap on most competing platforms.
Per-Task Earnings
How much Spark drivers earn per completed delivery or order:
- Average: $11.01 per task
- Median: $10.25 per task
- Top 25% (p75): $13.46 per task
- Top 10% (p90): $16.93 per task
Gross pay per task (including all bonus and incentive pay):
- Average: $11.49 per task
- Median: $10.66 per task
- Top 25% (p75): $14.12 per task
- Top 10% (p90): $17.88 per task
At $10.25 median per task, Spark pays 38% more per delivery than DoorDash ($7.44 per delivery). And because Spark drivers complete more tasks per hour (more on that below), the per-task advantage compounds into an even larger hourly difference.
Tip Earnings
Tips per task:
- Average: $2.98 per task
- Median: $2.64 per task
- Top 25% (p75): $4.10 per task
- Top 10% (p90): $5.62 per task
Tips per work hour:
- Average: $6.10/hr
- Median: $5.54/hr
- Top 25% (p75): $7.92/hr
- Top 10% (p90): $10.62/hr
Tips represent approximately 26% of total trip pay per task ($2.64 of $10.25) and about 25% of hourly earnings ($5.54 of $21.74 per hour). While that percentage is lower than DoorDash (where tips are nearly half of all pay), the actual dollar amounts are competitive because Spark's base pay is so much higher. We will break down Spark tipping patterns in detail below.
Tasks Per Work Hour
- Average: 2.28 tasks per hour
- Median: 2.10 tasks per hour
- Top 25% (p75): 2.65 tasks per hour
- Top 10% (p90): 3.35 tasks per hour
This is one of the most important numbers in this article. Spark drivers complete a median of 2.10 tasks per hour -- the highest throughput of any delivery platform. DoorDash Dashers complete 1.51 deliveries per hour. Instacart shoppers complete just 0.96 orders per hour. Spark's higher throughput is a direct result of the Walmart model: orders are pre-packed by Walmart employees (for curbside pickup orders), pickup locations are centralized at one store, and delivery distances tend to be shorter because Walmart stores are distributed throughout suburban neighborhoods.
Pay Per Mile
Gross pay per point-to-point mile:
- Average: $2.37 per mile
- Median: $2.06 per mile
- Top 25% (p75): $2.75 per mile
- Top 10% (p90): $3.64 per mile
At $2.06 per mile median, Spark drivers earn well above the IRS standard mileage deduction rate of $0.70 per mile. The high per-mile rate reflects Spark's shorter delivery distances -- most Walmart deliveries are within a few miles of the store, meaning you earn more per mile driven compared to longer-distance food delivery or rideshare trips.
How Spark Driver Pay Works
Understanding Walmart's pay structure helps you decide which orders to accept and how to maximize your time on the road. Spark operates differently from food delivery apps like DoorDash or Uber Eats because every order originates from a Walmart store. Here is how each component works.
Base Pay
Walmart calculates base pay for each Spark order based on several factors:
- Distance: Longer deliveries to addresses farther from the Walmart store receive higher base pay
- Order size: Larger orders with more items or heavier loads can carry higher base pay
- Demand: When customer demand exceeds available drivers, base pay increases (similar to surge pricing on rideshare)
- Time of day: Orders during peak windows may have higher base pay to attract drivers
Base pay on Spark typically ranges from $7 to $15 per order, though it can go higher for long-distance deliveries or during high-demand periods. This is significantly higher than DoorDash's typical $2 to $4 base pay per delivery.
Order Types
Spark offers several types of orders, each with different pay characteristics:
- Curbside delivery: The most common order type. Walmart employees pick and pack the groceries, and you simply load them at the curbside pickup area and deliver. These are the fastest to complete and drive the high tasks-per-hour numbers.
- Shop and deliver: You shop for the items inside Walmart and then deliver them. These pay more per order but take significantly longer, which can reduce your hourly rate if the order is complex.
- Express/ASAP orders: Time-sensitive deliveries that need to arrive quickly. These often carry higher base pay due to urgency.
- Dotcom orders: General merchandise orders from Walmart.com. These are typically lighter items and shorter deliveries.
Surge Pricing
When demand spikes -- during bad weather, holidays, or peak grocery shopping hours -- Spark increases the pay offered per order. Unlike Uber's percentage-based surge multiplier, Spark's surge is typically a flat dollar increase added to the base pay. You will see higher-paying orders appear in the app during these windows, and accepting them is one of the easiest ways to boost your hourly earnings.
Incentive Programs
Spark offers periodic incentive programs that reward consistency and volume:
- Trip bonuses: Complete a set number of deliveries in a time window for a flat bonus (e.g., "Complete 20 deliveries this week, earn an extra $30")
- Guaranteed earnings: Walmart occasionally offers minimum earnings guarantees for new or returning drivers
- Streak bonuses: Complete multiple consecutive deliveries without declining an offer to earn extra pay
These incentives show up in the difference between total trip pay ($21.74/hr median) and gross pay ($22.57/hr median) -- about $0.83 per hour in bonus income for the typical Spark driver.
Payment Schedule
Spark pays drivers weekly via direct deposit, typically on Tuesdays for the previous week's earnings. Spark also offers a daily cash-out option through the Branch app, which lets you access your earnings the same day -- though some drivers report a small fee for instant transfers.
How Much Do Spark Drivers Earn in Tips?
Spark driver tips tell an interesting story. At a median of $2.64 per task, tips account for approximately 26% of per-task earnings and 25% of hourly earnings. Here is the full breakdown:
- Tip per task median: $2.64
- Tip per task average: $2.98
- Tips per hour median: $5.54
- Tips per hour top 10%: $10.62
While Spark's tip percentage is lower than DoorDash (where tips are nearly 48% of hourly pay), the actual tip dollars per hour are comparable -- $5.54/hr on Spark versus $5.39/hr on DoorDash. The difference is that Spark's base pay does the heavy lifting, while DoorDash relies on tips to make the economics work for drivers.
Walmart Customer Tipping Patterns
Walmart delivery tipping is different from food delivery tipping in several ways:
- Grocery order sizes are larger: A typical Walmart grocery order is $100 to $200+, but customers do not always tip as a percentage of the order total the way they do with restaurant food delivery. Many Walmart customers tip a flat $3 to $5 regardless of order size.
- Tips are added after delivery: Unlike DoorDash where tips are added at checkout, many Walmart customers can adjust or add tips after the delivery is complete. This means your service quality directly impacts your tip income.
- Repeat customers tip more consistently: Walmart grocery delivery customers tend to be repeat users -- they order weekly or biweekly. Once they establish a tipping habit, it tends to stick. Building a reputation for careful handling and communication pays off over time.
- Some customers do not tip at all: A meaningful percentage of Walmart delivery customers do not tip, which pulls the median down. The gap between median ($2.64) and top 25% ($4.10) shows that a portion of deliveries come with no tip, while tipped deliveries are reasonably generous.
How to Maximize Your Spark Tips
- Communicate proactively: Send a quick text when you are on the way and when you arrive. Let the customer know if you placed bags in a specific spot or if anything seemed unusual with the order.
- Handle groceries with care: Separate cold items from pantry items, do not crush bread under canned goods, and keep frozen items together. Customers notice.
- Follow delivery instructions exactly: If the customer says "leave at side door," leave at the side door. Small details drive repeat tips.
- Take a delivery photo: Even if not required, a photo of the bags at the door gives customers confidence their order arrived safely.
- Be fast but careful: Walmart customers expect prompt delivery, but they care even more about their groceries arriving intact.
Best Times to Drive Spark (Delivery Earnings Heatmap)
When you deliver matters almost as much as which platform you use. The following earnings data is based on all delivery platforms combined (not Spark-specific), showing the average gross earnings per hour by day and time block. It gives you a reliable picture of when delivery demand -- and pay -- peaks.
Peak Earning Windows
The highest-paying delivery windows based on Gridwise data:
- Sunday 6-8pm: $18.28/hr average -- the single best delivery window of the week
- Saturday 6-8pm: $17.48/hr average
- Friday 6-8pm: $17.42/hr average
- Sunday 3-5pm: $17.27/hr average
- Sunday 6-8am: $17.30/hr average
The dinner rush (6-8pm) consistently pays the most across every day of the week. Weekends dominate the top of the list, with Sunday being the single best day for delivery earnings.
Lowest Earning Windows
- Tuesday 12-2pm: $14.17/hr average -- the lowest-paying window
- Tuesday 9-11am: $14.25/hr average
- Wednesday 9-11am: $14.64/hr average
- Thursday 9-11am: $14.43/hr average
Midday on weekdays is consistently the lowest-paying window. If you are a part-time Spark driver choosing your hours, avoid the Tuesday through Thursday lunch lull.
Spark-Specific Timing Considerations
While the heatmap above covers all delivery platforms, Spark has some unique timing patterns worth noting:
- Morning grocery rush (6-10am): Walmart online grocery orders are often placed the night before for morning delivery. Early morning slots can be lucrative on Spark because curbside pickup orders are pre-packed and ready, making for fast task completion.
- Sunday grocery restocking: Sunday is the biggest grocery shopping day in America, and that translates directly to Spark order volume. Sunday earnings data confirms this -- it is the highest-paying day across nearly every time block.
- Walmart store hours matter: Unlike DoorDash or Uber Eats which operate 24/7 through late-night restaurants, Spark orders are limited to Walmart's operating hours. Most Walmart stores are open 6am to 11pm, which means the late-night delivery window (midnight to 5am) is largely unavailable on Spark.
- Holiday and weather surges: Thanksgiving week, Christmas Eve, and snowstorm days generate massive Spark demand as customers order groceries for delivery instead of driving to the store themselves.
How to Earn More as a Spark Driver
The difference between a median Spark driver ($21.74/hr) and a top 10% earner ($30.26/hr) is $8.52 per hour -- or $341 per 40-hour week. Here is what separates top Spark earners from average ones.
Leverage the Throughput Advantage
Spark's biggest structural advantage is task throughput. At 2.10 tasks per hour median, you are completing deliveries faster than on any other platform. Top 10% drivers push that to 3.35 tasks per hour. The key to high throughput on Spark:
- Park near the curbside pickup area: Minimize the time between accepting an order and loading groceries. Some drivers park in the Walmart lot between orders.
- Know your delivery zone: Familiarity with streets and neighborhoods around your Walmart store cuts delivery time significantly. Turn-by-turn GPS adds minutes per delivery that experienced drivers eliminate.
- Prioritize curbside orders over shop-and-deliver: Curbside orders are pre-packed. Shop-and-deliver orders require you to walk the store aisles, which can cut your tasks per hour in half. Accept shop-and-deliver only when the pay premium justifies the time.
Maintain a High Acceptance Rate and Rating
Spark uses driver metrics to determine who gets priority access to orders. Drivers with higher acceptance rates and customer ratings are more likely to receive high-value offers first. While you should not accept every order blindly, maintaining a consistently high acceptance rate keeps you in the priority queue.
- Target a 90%+ acceptance rate -- declining too many orders pushes you down the priority list
- Keep your customer rating at 4.7 or above -- ratings directly affect order access
- Complete deliveries on time -- late deliveries hurt your metrics more than most drivers realize
Choose the Right Walmart Location
Not all Walmart stores generate equal Spark demand. High-volume Walmart Supercenters in suburban areas tend to produce the most consistent order flow. Walmart Neighborhood Markets have lower order volume. If you have multiple Walmart locations within driving distance, spend a week testing each one and track your earnings per hour at each location using Gridwise.
Multi-App During Downtime
Spark order flow can be inconsistent, especially in smaller markets or during off-peak hours. When Spark orders slow down, toggle on DoorDash, Uber Eats, or Instacart to fill gaps. The key is making Spark your primary platform (because it pays the most per hour) and using other apps as supplemental income between Spark orders. Many experienced gig drivers earn $25 or more per hour by multi-apping strategically with Spark as their anchor.
Track Your Earnings Religiously
You cannot optimize what you do not measure. Track your per-hour earnings by day, time, and Walmart location to identify your personal peak windows. Gridwise does this automatically -- it tracks every delivery across all your gig apps, calculates your true hourly rate including time between orders, and shows you exactly when and where you earn the most.
Spark Driver Pay vs Other Delivery Apps
Here is how Spark stacks up against every major gig platform, using median hourly earnings from Gridwise data:
Median Hourly Earnings by Platform
- Spark: $21.74/hr (total trip pay) -- #1 delivery platform
- Uber (rideshare): $21.18/hr -- requires carrying passengers
- Lyft: $19.48/hr -- requires carrying passengers
- Grubhub: $15.38/hr
- Uber Eats: $14.07/hr
- Instacart: $12.21/hr
- DoorDash: $11.26/hr
Spark is not just the highest-paying delivery platform -- it beats every delivery app by a significant margin. At $21.74 per hour, Spark pays 93% more than DoorDash ($11.26), 54% more than Uber Eats ($14.07), and 78% more than Instacart ($12.21). It even edges out Uber rideshare ($21.18), which requires carrying passengers, dealing with cancellations, and putting substantially more miles on your vehicle.
Per-Delivery Earnings Comparison
- Spark: $10.25 per task median
- DoorDash: $7.44 per delivery median
- Instacart: varies widely by order size
Spark pays 38% more per individual delivery than DoorDash. Combined with higher throughput (2.10 tasks/hr vs 1.51), the hourly earnings gap is even more dramatic.
Task Throughput Comparison
- Spark: 2.10 tasks per hour median -- #1 across all delivery apps
- DoorDash: 1.51 deliveries per hour median
- Instacart: 0.96 orders per hour median
Spark's throughput advantage is massive. Completing 2.10 tasks per hour means a typical delivery cycle on Spark takes about 29 minutes -- compared to 40 minutes on DoorDash and over 62 minutes on Instacart. The Walmart curbside model (pre-packed orders, centralized pickup, shorter delivery distances) is structurally faster than food delivery or grocery shopping platforms.
The Caveats
Before you delete DoorDash and go all-in on Spark, consider the limitations:
- Availability: Spark is not available everywhere. It operates in areas with Walmart stores that offer delivery, which covers most of suburban and rural America but may not be available in dense urban cores where DoorDash and Uber Eats dominate.
- Zone capacity: Spark limits the number of drivers per zone. If your local Walmart already has enough Spark drivers, you may be waitlisted. Check Spark Driver requirements for your area.
- Order consistency: Spark order flow can be less predictable than DoorDash in some markets. You may have busy stretches followed by quiet periods, especially in lower-population areas.
- Store hours: Unlike 24/7 food delivery, Spark is limited to Walmart's operating hours (typically 6am to 11pm). No late-night Spark runs.
Is Spark Driver Worth It?
Based on the data: yes, Spark is worth it -- and it is arguably the best delivery gig available if you live near a Walmart with active Spark demand.
Here is the case for Spark:
- $21.74/hr median is exceptional for delivery work. At 40 hours per week, that is roughly $870 per week or $3,480 per month before expenses.
- Lower mileage than rideshare: Walmart deliveries are typically shorter distances than Uber rides, meaning less wear on your vehicle, lower gas costs, and more tax deductions for gig workers relative to miles driven.
- No passengers: Delivery-only means no awkward conversations, no cleaning up after riders, no safety concerns with strangers in your car.
- High throughput keeps you busy: At 2.10 tasks per hour, you are rarely sitting idle waiting for orders during peak times. Consistent task flow means consistent earnings.
- Tips are a bonus, not a necessity: Unlike DoorDash where tips make up nearly half your pay, Spark's base pay is strong enough that tips are supplemental income rather than something you depend on.
Here is when Spark might not be the best fit:
- No Walmart nearby: If the nearest Walmart is a 20+ minute drive from your home, commute time cuts into your effective hourly rate.
- Saturated zone: If your local Spark zone is full and you are waitlisted, you simply cannot start driving. DoorDash and Uber Eats have lower barriers to entry.
- Urban-core drivers: If you live in a dense city center, food delivery apps like DoorDash and Uber Eats may offer higher order volume than Spark, which is strongest in suburban markets.
- Need 24/7 flexibility: Spark's dependence on Walmart store hours means no late-night or early-morning earning windows, unlike rideshare or food delivery.
For most gig drivers who have access to Spark in their area, the math is clear: start with Spark as your primary platform, multi-app with DoorDash or Amazon Flex during downtime, and track everything to optimize your schedule. If you run into issues with the platform, check out our guide to Spark Driver customer service for support options.
Spark Driver Earnings FAQ
How much can you make doing Spark full-time?
At the median hourly rate of $21.74, a full-time Spark driver working 40 hours per week would earn approximately $870 per week or $3,480 per month before expenses. Top 10% drivers earning $30.26 per hour would gross about $1,210 per week. After expenses (gas, maintenance, insurance), most full-time Spark drivers can expect to net $18 to $22 per hour depending on their vehicle's efficiency and local gas prices.
How much do Spark drivers make per delivery?
The median Spark driver earns $10.25 per delivery in total trip pay, or $10.66 per delivery in gross pay (including incentives). Top 25% of drivers earn $13.46 or more per delivery, and top 10% earn $16.93 or more.
How much do Spark drivers make in tips?
The median Spark driver earns $2.64 per delivery in tips, or $5.54 per hour in tip income. Top 10% of Spark drivers earn $5.62 per delivery and $10.62 per hour in tips. Tips account for approximately 25% of total hourly earnings on Spark.
Is Spark better than DoorDash?
In terms of pay, Spark significantly outperforms DoorDash. Spark's median hourly rate ($21.74) is nearly double DoorDash's ($11.26). Per-delivery earnings are 38% higher ($10.25 vs $7.44), and task throughput is 39% higher (2.10 vs 1.51 tasks per hour). However, DoorDash is available in more markets, has no driver cap per zone, and operates 24/7 through late-night restaurants. If Spark is available in your area, it is the better-paying option by a wide margin.
Is Spark better than Instacart?
Yes, by a significant margin. Spark pays $21.74 per hour median versus Instacart's $12.21 per hour -- a 78% difference. Spark's throughput advantage is even more dramatic: 2.10 tasks per hour versus Instacart's 0.96, meaning Spark drivers complete more than twice as many orders per hour. Spark also does not require you to shop for items (on curbside orders), while Instacart always requires in-store shopping.
How much do Spark drivers make after expenses?
After accounting for gas, vehicle maintenance, and depreciation, most Spark drivers net approximately $18 to $22 per hour. Spark's shorter delivery distances (reflected in the high $2.06/mile pay rate) mean lower per-task expenses than rideshare or long-distance delivery platforms. The IRS standard mileage deduction ($0.70/mile in 2026) can offset a significant portion of driving costs at tax time.
Do you need a special vehicle for Spark?
No. Any reliable vehicle with enough cargo space for grocery bags works for Spark. You do not need a specific model year or vehicle type like some rideshare platforms require. A sedan with a clean trunk, an SUV, or a minivan all work well. Larger vehicles can handle bigger orders, which may result in higher-paying offers. For full details, see our guide to Spark Driver requirements.
Start Tracking Your Spark Earnings Today
Spark drivers earn a median of $21.74 per hour -- the highest of any delivery platform -- with top earners clearing $30.26 per hour or more. The combination of strong base pay, solid tips, and the highest task throughput in the delivery industry makes Spark a standout choice for gig drivers with access to the platform.
But the drivers who earn the most are the ones who track their numbers obsessively. They know which Walmart location pays best, which hours produce the highest earnings, and when to toggle on a second app to fill gaps. That is exactly what Gridwise does automatically.
How Much Do Lyft Drivers Make? (2025 Data from 500k+ Drivers)
How much do Lyft drivers actually make in 2026? Not the recycled "$15 to $25 per hour" estimates from outdated blog posts -- the real numbers from real drivers. We analyzed earnings from 31,533 Lyft drivers tracked through Gridwise in 2025 to deliver the most accurate picture of Lyft driver pay available anywhere. Whether you are thinking about signing up, already driving, or trying to decide between Lyft and Uber, this guide covers everything: hourly pay, per-trip earnings, tip income, the best times to drive, and a head-to-head comparison with Uber backed by actual data.
Quick Answer -- How Much Do Lyft Drivers Make Per Hour?
Lyft drivers earn a median of $19.48 per hour in total trip pay, based on data from 31,533 drivers tracked through Gridwise in 2025. When you include all earnings (base pay, Prime Time surge, bonuses, and tips), the median gross pay rises to $20.38 per hour.
That is the midpoint -- half of all Lyft drivers earn more, half earn less. The top 25% of Lyft drivers earn $22.96 or more per hour, and the top 10% clear $27.63 per hour. These are gross earnings before expenses like gas, insurance, and vehicle maintenance.
For context, that is about $1.70 per hour less than Uber drivers at the median ($19.48 vs $21.18). But as you will see later in this article, the smartest drivers do not pick one app over the other -- they run both.
Lyft Driver Earnings Breakdown (2025 Data from 31,533 Drivers)
Here is the full picture of what Lyft drivers earn, broken down by every metric that matters. All figures are based on 2025 data from Gridwise's network of tracked drivers.
Hourly Earnings
Total trip pay per work hour (base fare + Prime Time surge + tips combined):
- Average: $20.67/hr
- Median: $19.48/hr
- Top 25% (p75): $22.96/hr
- Top 10% (p90): $27.63/hr
Gross pay per work hour (all earnings including bonuses and promotions):
- Average: $21.57/hr
- Median: $20.38/hr
- Top 25% (p75): $24.03/hr
- Top 10% (p90): $28.85/hr
The gap between total trip pay and gross pay ($0.90/hr at the median) represents bonus earnings from Lyft's streak bonuses, ride challenges, and other promotions. That is roughly $18 extra over a 20-hour driving week -- not life-changing, but it adds up over time, especially for drivers who consistently hit their bonus targets.
Per-Trip Earnings
How much Lyft drivers earn per completed ride:
- Average: $13.06 per trip
- Median: $11.05 per trip
- Top 25% (p75): $14.22 per trip
- Top 10% (p90): $20.20 per trip
The median per-trip pay of $11.05 is lower than Uber's $12.18. This is largely because Lyft trips tend to be shorter on average. Drivers who consistently land longer rides -- airport runs, scheduled rides to events, suburban-to-downtown commutes -- earn significantly more per trip.
Per-Mile Earnings
- Average: $2.00 per mile
- Median: $1.76 per mile
- Top 25% (p75): $2.19 per mile
- Top 10% (p90): $2.92 per mile
Here is an interesting wrinkle: Lyft actually pays more per mile than Uber ($1.76 vs $1.59 at the median). Because Lyft trips skew shorter, each mile driven with a passenger earns more -- even though the total trip value is lower. This matters for vehicle wear and tear: shorter, higher-per-mile trips can actually be more efficient for your car.
Trips Per Hour
- Average: 1.72 trips per hour
- Median: 1.70 trips per hour
- Top 25% (p75): 1.97 trips per hour
- Top 10% (p90): 2.23 trips per hour
Lyft drivers complete essentially the same number of trips per hour as Uber drivers (1.70 vs 1.69). The throughput is virtually identical, which means the earnings gap comes entirely from lower per-trip fares -- not from sitting idle longer between rides.
How Lyft Driver Pay Works
Understanding how Lyft calculates your pay helps you maximize every shift. Lyft driver earnings come from several components:
Base Fare and Per-Mile/Per-Minute Rates
Every Lyft trip starts with a base fare (typically $0.50 to $2.50 depending on your market), plus a per-mile rate and a per-minute rate. These rates vary by city and ride type. Standard Lyft rides pay the lowest base rates, while Lyft Lux and Lyft Lux Black command premium fares.
A typical Lyft ride of 6 miles taking 12 minutes might break down as:
- Base fare: $1.00
- Per-mile ($0.85 x 6 miles): $5.10
- Per-minute ($0.12 x 12 min): $1.44
- Subtotal before Lyft's fee: $7.54
Prime Time (Lyft's Surge Pricing)
When rider demand exceeds driver supply, Lyft activates Prime Time -- a percentage-based multiplier that increases your fare. Unlike Uber's surge (which shows a multiplier like 2.0x), Lyft displays Prime Time as a percentage (e.g., +50%, +100%). A +75% Prime Time on a $10 fare would pay you $17.50. Prime Time kicks in most often during bar close (midnight to 2am), major events, bad weather, and Friday/Saturday nights.
Lyft's Service Fee
Lyft takes a service fee on every trip, typically 20% to 25% of the fare (before tips). In some markets and on some ride types, this can vary. All the earnings data in this article reflects what drivers actually receive after Lyft's cut -- so these are your real take-home numbers before personal expenses.
Streak Bonuses
Lyft's streak bonus program is one of its strongest driver incentives. Accept and complete a consecutive set of rides (typically 3 rides in a row) without declining or canceling, and Lyft adds a flat bonus to your earnings -- usually $5 to $18 per streak depending on your market and time of day. Streaks activate most frequently during peak demand periods, and they stack: a driver who hits multiple streaks in an evening can add $30 to $60+ to their total earnings.
Ride Challenges
Lyft regularly offers ride challenges: complete a target number of rides within a set time window (e.g., "Complete 50 rides this week, earn an extra $75"). These challenges reward volume and consistency, and they can significantly boost your effective hourly rate if you are already planning to drive during that period.
Power Driver Bonus
Lyft's Power Driver program rewards high-volume drivers who meet specific thresholds for total rides and acceptance rate. Benefits include rental car discounts (for drivers on Lyft's Express Drive rental program) and reduced commission rates, effectively increasing your take-home pay on every ride. To qualify, you typically need to complete 160+ rides per month and maintain a 90%+ acceptance rate.
How Much Do Lyft Drivers Earn in Tips?
Tips are part of the Lyft driver earnings picture, though they account for a smaller share of total pay than many drivers expect.
Tip Earnings Per Trip
- Average tip per trip: $1.18
- Median tip per trip: $0.93
- Top 25% tip per trip: $1.45
- Top 10% tip per trip: $2.23
Tip Earnings Per Hour
- Average tips per hour: $1.85
- Median tips per hour: $1.61
- Top 25% tips per hour: $2.39
- Top 10% tips per hour: $3.32
Why Lyft Tips Are Lower Than Uber
At $0.93 per trip, Lyft tips are about 22% lower than Uber's $1.20 median. A few factors contribute to this gap. Lyft's passenger base historically skewed toward more budget-conscious riders, and its tipping feature was added later than Uber's, which means the tipping habit is somewhat less ingrained among Lyft regulars. That said, tips still add roughly $1.61 per hour at the median -- about $32 extra over a 20-hour week.
Tips account for approximately 5% of total Lyft driver earnings at the median. That is lower than Uber (~7%) and significantly lower than delivery platforms like DoorDash where tips make up roughly a third of total pay.
How to Increase Your Lyft Tips
While you cannot force passengers to tip, these habits consistently correlate with higher tip rates:
- Keep your car spotless and fresh-smelling -- cleanliness is the single biggest driver of passenger reviews and tipping behavior
- Offer phone chargers -- a small investment that signals professionalism and earns goodwill
- Communicate proactively about route choices -- "I'm taking the expressway to avoid traffic on 5th" builds passenger confidence
- Maintain a 4.9+ rating -- higher-rated drivers are more likely to be matched with higher-rated (and higher-tipping) passengers
- Drive Lyft Lux or Lux Black -- premium ride passengers tip more consistently and at higher dollar amounts
Best Times to Drive Lyft (Earnings by Day and Time)
When you drive matters almost as much as how long you drive. Our data covers rideshare earnings across both Uber and Lyft, showing average gross pay per hour by day and time. Because most drivers multi-app, these combined numbers represent what you can actually expect to earn during each time slot.
Highest-Earning Time Slots
- Wednesday 12am-2am: $31.07/hr -- mid-week late-night surprisingly tops the entire chart
- Sunday 12am-2am: $28.89/hr -- bar closing time drives massive surge and Prime Time demand
- Sunday 3am-5am: $28.26/hr -- continued late-night demand as bars and clubs empty out
- Saturday 9pm-11pm: $27.32/hr -- prime going-out hours with consistent Prime Time activation
- Saturday 12am-2am: $28.14/hr -- the classic bar-close rush
Lowest-Earning Time Slots
- Tuesday 9am-11am: $20.01/hr -- low demand, no surge, minimal Prime Time
- Wednesday 9am-11am: $20.33/hr -- same pattern mid-week
- Tuesday 12pm-2pm: $20.37/hr -- midday lull with oversupply of drivers
- Monday 9am-11am: $21.00/hr -- weekday morning slump
The Peak Hours Strategy
The gap between the best and worst time slots is massive: $31.07/hr vs $20.01/hr -- a 55% difference. A Lyft driver who works 20 hours exclusively during peak windows earns the same gross pay as someone who works 31 hours during off-peak times. The takeaway is clear: concentrate your driving hours during evenings, nights, and weekends to maximize your hourly rate.
Late-night shifts (9pm to 5am) consistently outperform all other time blocks across every day of the week. Weekend nights are the most reliable, but even weeknight late shifts pay well above midday averages.
How to Earn More as a Lyft Driver
The difference between a median Lyft driver ($19.48/hr) and a top-25% driver ($22.96/hr) is nearly $3.50 per hour -- that is an extra $70 over a 20-hour week or $3,640 over a year. Here is how top earners pull ahead.
Multi-App with Uber
This is the single most impactful strategy for Lyft drivers. Running both Lyft and Uber simultaneously lets you accept whichever ride pays more and eliminates dead time between requests. When Lyft is slow, Uber picks up the slack -- and vice versa. Most top-earning rideshare drivers in our dataset run both apps. Check out how much Uber drivers make to see the full Uber earnings breakdown.
Stack Streak Bonuses
Lyft's streak bonuses are one of the platform's best-kept secrets. During peak hours, streaks can activate frequently -- accept three rides in a row without declining and earn $5 to $18 extra per streak. A driver who hits four streaks in an evening adds $20 to $72 to their earnings with zero extra effort. The key is maintaining a high acceptance rate during streak-eligible windows.
Hit Ride Challenge Targets
Lyft's ride challenges reward volume: complete a target number of rides (usually 40 to 80 per week) and earn a lump-sum bonus. If you are already planning to drive 20+ hours, structuring your schedule to hit the challenge target turns bonus money from aspirational to automatic. Check the Driver tab in your Lyft app every Monday to see available challenges.
Drive During Peak Hours
Refer to the heatmap data above. Shifting even a few hours from midday to evening can add $3 to $5/hr to your effective rate. The highest-earning Lyft drivers are not necessarily working more hours -- they are working the right hours.
Qualify for Power Driver
Lyft's Power Driver program reduces your effective commission rate when you hit ride volume and acceptance rate thresholds. If you are driving 30+ hours per week anyway, the reduced commission means more money per trip without changing anything about your driving behavior.
Maintain a High Rating
Drivers with ratings above 4.9 get matched with higher-rated passengers, who tend to take more predictable trips and tip more consistently. The basics matter: clean car, polite communication, smooth driving, and knowing the efficient routes in your market.
Know Your Market's Airport and Event Schedule
Airport pickups and event surge are where per-trip earnings jump dramatically. Our data shows top-10% drivers averaging $20.20 per trip versus $11.05 at the median -- and much of that gap comes from longer, higher-value rides. Check your local airport queue rules and keep an eye on concert, sports, and convention schedules.
Lyft vs Uber -- How Driver Pay Actually Compares
This is the section most readers came here for. If you are deciding between Lyft and Uber -- or wondering whether it is worth adding Lyft to your existing Uber routine -- here is how the two platforms stack up, using real data from both driver populations tracked through Gridwise.
Head-to-Head Earnings Comparison
Hourly Pay (Median):
- Uber: $21.18/hr total trip pay | $21.92/hr gross
- Lyft: $19.48/hr total trip pay | $20.38/hr gross
- Difference: Uber pays $1.70/hr more at the median
Per-Trip Pay (Median):
- Uber: $12.18 per trip
- Lyft: $11.05 per trip
- Difference: Uber pays $1.13 more per trip
Per-Mile Pay (Median):
- Uber: $1.59 per mile
- Lyft: $1.76 per mile
- Difference: Lyft actually pays $0.17 more per mile
Tips (Median Per Trip):
- Uber: $1.20 per trip
- Lyft: $0.93 per trip
- Difference: Uber tips are ~29% higher
Trips Per Hour (Median):
- Uber: 1.69 trips/hr
- Lyft: 1.70 trips/hr
- Difference: Virtually identical
What the Numbers Actually Mean
Uber pays more per hour and per trip. That is the bottom line, and there is no way to sugarcoat it. At the median, an Uber driver working 20 hours per week grosses about $34 more per week ($1,770 more per year) than a Lyft-only driver working the same hours.
But the story has nuance. Lyft's higher per-mile rate ($1.76 vs $1.59) tells us something important: Lyft trips are shorter on average, but each mile driven with a passenger is more valuable. For drivers who care about vehicle wear and minimizing mileage, this matters. Shorter trips also mean less time driving in one direction away from demand hotspots.
The trip throughput being virtually identical (1.70 vs 1.69 trips/hr) means Lyft drivers are not spending more time idle between rides. The earnings gap comes purely from trip value, not from utilization.
The Real Answer: Run Both Apps
The data makes a strong case for multi-apping. Lyft-only drivers earn $19.48/hr. Uber-only drivers earn $21.18/hr. But drivers who run both apps and accept the best available ride at any given moment can potentially earn above either platform's standalone median by eliminating downtime and always capturing the highest-paying trip available.
If you are currently Uber-only, adding Lyft gives you more ride requests to choose from. If you are Lyft-only, adding Uber boosts your baseline hourly rate. Either way, multi-apping is the proven strategy among the highest earners in our dataset. Make sure you meet the Lyft driver requirements and the Uber requirements to keep both options open.
Is Driving for Lyft Worth It?
The honest answer depends on your situation and strategy.
As a standalone platform, Lyft pays a median of $19.48/hr before expenses. After accounting for gas, maintenance, insurance, and vehicle depreciation, most Lyft drivers net approximately $14 to $17 per hour. That is competitive with many hourly jobs, especially considering the schedule flexibility, but it is not as strong as Uber's standalone numbers.
As part of a multi-app strategy, Lyft becomes significantly more valuable. Running Lyft alongside Uber gives you more ride requests, less downtime, and the ability to chase whichever platform is offering better surge or bonuses at any given moment. This is how most top earners operate.
Lyft is worth it if:
- You multi-app with Uber -- Lyft fills the gaps when Uber is slow and vice versa
- You drive during peak hours -- late nights and weekends pay 30-55% more than off-peak
- You chase Lyft's bonus programs -- streak bonuses and ride challenges can add $50 to $150+ per week
- You track your numbers -- knowing your real hourly rate, best times, and expenses is the difference between driving smart and driving blind
- Schedule flexibility matters to you -- Lyft lets you drive whenever you want with no minimum hours
Lyft may not be worth it if you are looking for the single highest-paying rideshare platform and refuse to multi-app. In that scenario, Uber's $1.70/hr advantage makes it the better standalone choice.
Regardless of which platform you choose, make sure you are tracking tax deductions for gig workers -- the standard mileage deduction alone ($0.70 per mile in 2025) can save Lyft drivers thousands of dollars per year at tax time.
Lyft Driver Earnings FAQ
How much can you make driving Lyft full-time?
At the median hourly rate of $19.48, a full-time Lyft driver working 40 hours per week would gross approximately $780 per week or $40,500 per year before expenses. Top 25% earners working full-time could gross $47,800+ per year. After expenses and taxes, full-time Lyft drivers typically take home $30,000 to $38,000 per year depending on their market, vehicle costs, and driving strategy.
Do Lyft drivers make less than Uber drivers?
Yes. Based on 2025 Gridwise data, Lyft drivers earn a median of $19.48/hr compared to Uber's $21.18/hr -- about $1.70 less per hour. However, Lyft pays more per mile ($1.76 vs $1.59), and many successful drivers run both apps simultaneously to maximize their earnings. Read our full breakdown of how much Uber drivers make for the complete comparison.
How much do Lyft drivers make per ride?
The median earnings per Lyft trip is $11.05, with an average of $13.06. The top 10% of Lyft drivers earn $20.20 or more per trip, typically by landing longer rides, airport pickups, or Lyft Lux trips during Prime Time.
How much do Lyft drivers make after expenses?
After accounting for gas, maintenance, insurance, and depreciation, most Lyft drivers net approximately $14 to $17 per hour. The exact amount depends on your vehicle's fuel efficiency, local gas prices, and how well you track and deduct business expenses. Read our guide to tax deductions for gig workers to make sure you are claiming everything you are entitled to.
How much do Lyft drivers make a week?
It depends on how many hours you drive. At the median rate of $19.48/hr: driving 20 hours per week grosses about $390, 30 hours grosses $584, and 40 hours grosses $779. The best strategy is to focus your hours during peak earning windows (nights and weekends) rather than simply logging more total hours.
Can you drive for both Lyft and Uber at the same time?
Yes. Both Lyft and Uber allow drivers to use other rideshare platforms. You can have both apps open simultaneously and accept rides from whichever platform offers the best fare at any given moment. This is called multi-apping, and it is the single most effective strategy for maximizing rideshare earnings. Just make sure you turn off the other app once you accept a ride so you do not get conflicting trip requests.
Is there a Lyft sign-up bonus for new drivers?
Yes, Lyft periodically offers sign-up bonuses for new drivers, typically ranging from $100 to $500+ depending on your market. Requirements usually include completing a minimum number of rides within your first 30 days. Check the current Lyft sign-up bonus offers in your area.
Start Tracking Your Lyft Earnings Today
The data in this article comes from 31,533 Lyft drivers who track their earnings through Gridwise. The drivers who earn the most are not just driving more hours -- they are driving smarter. They know their real hourly rate, they know which days and times pay best in their market, and they track every mile for tax deductions.
Whether you drive exclusively for Lyft, multi-app with Uber, or work across multiple gig platforms, the first step to earning more is knowing your real numbers. Stop guessing what you make per hour -- measure it.
Work smarter. Earn more.
Whether you drive, deliver, or pick up shifts — Gridwise helps you track earnings, mileage, and performance so you stay in control of your work. Download the app and take charge today.
