Here's what we cover:
COVID-19 is causing the ride-hailing industry to pump the brakes. So how should TNCs respond
COVID-19 has decimated the ride-hailing industry. So how will TNCs respond?
COVID-19, the vicious viral disease caused by the infamous novel coronavirus, has crippled the once flourishing ride-hailing industry.
As most major cities throughout the world implemented lockdowns and shelter-in-place orders to slow the infection rate of the virus, they also brought movement in cities to a near standstill — and the demand for ride-hailing with it.
On March 19th, 2020, Uber CEO Dara Khosrowshahi told analysts that Uber bookings were down some 60% to 70% in “more recently impacted markets like Seattle.” Khosrowshahi also noted that the company was expecting a rebound to begin in the middle of the second quarter, roughly near the end of April.
Things didn’t quite happen according to Dara Khosrowshahi’s plan, however, because as we write this article at the end of April 2020, most citizens are still sheltering in place.
We, of course, can understand this by simply turning on the news and seeing most major cities around the globe extend stay at home orders instead of reducing them, but we can also look to mobility data to tell us a more detailed story about how COVID-19 and stay-at-home orders have affected urban mobility.
How? One of the best ways to measure the amount of movement in a city is by understanding congestion as quantified by driving speed. Less movement in a city means less congestion, which means fewer drivers on the road.
At Gridwise, we can leverage the anonymized data of more than 105,000 ride-hail drivers to understand how people are moving around their city. When we look at the average speed of ride-hail drivers in major urban centers who’ve been hit hard by the COVID-19 pandemic, we’ve noticed a stark increase in speed for those drivers who are still out on the road.
In New York City, for instance, we saw ride-hail speeds increase by 32.29% in April when compared to January, which was a result of drivers just not being on the road.
And New York City isn’t the only city that has seen its streets go barren.
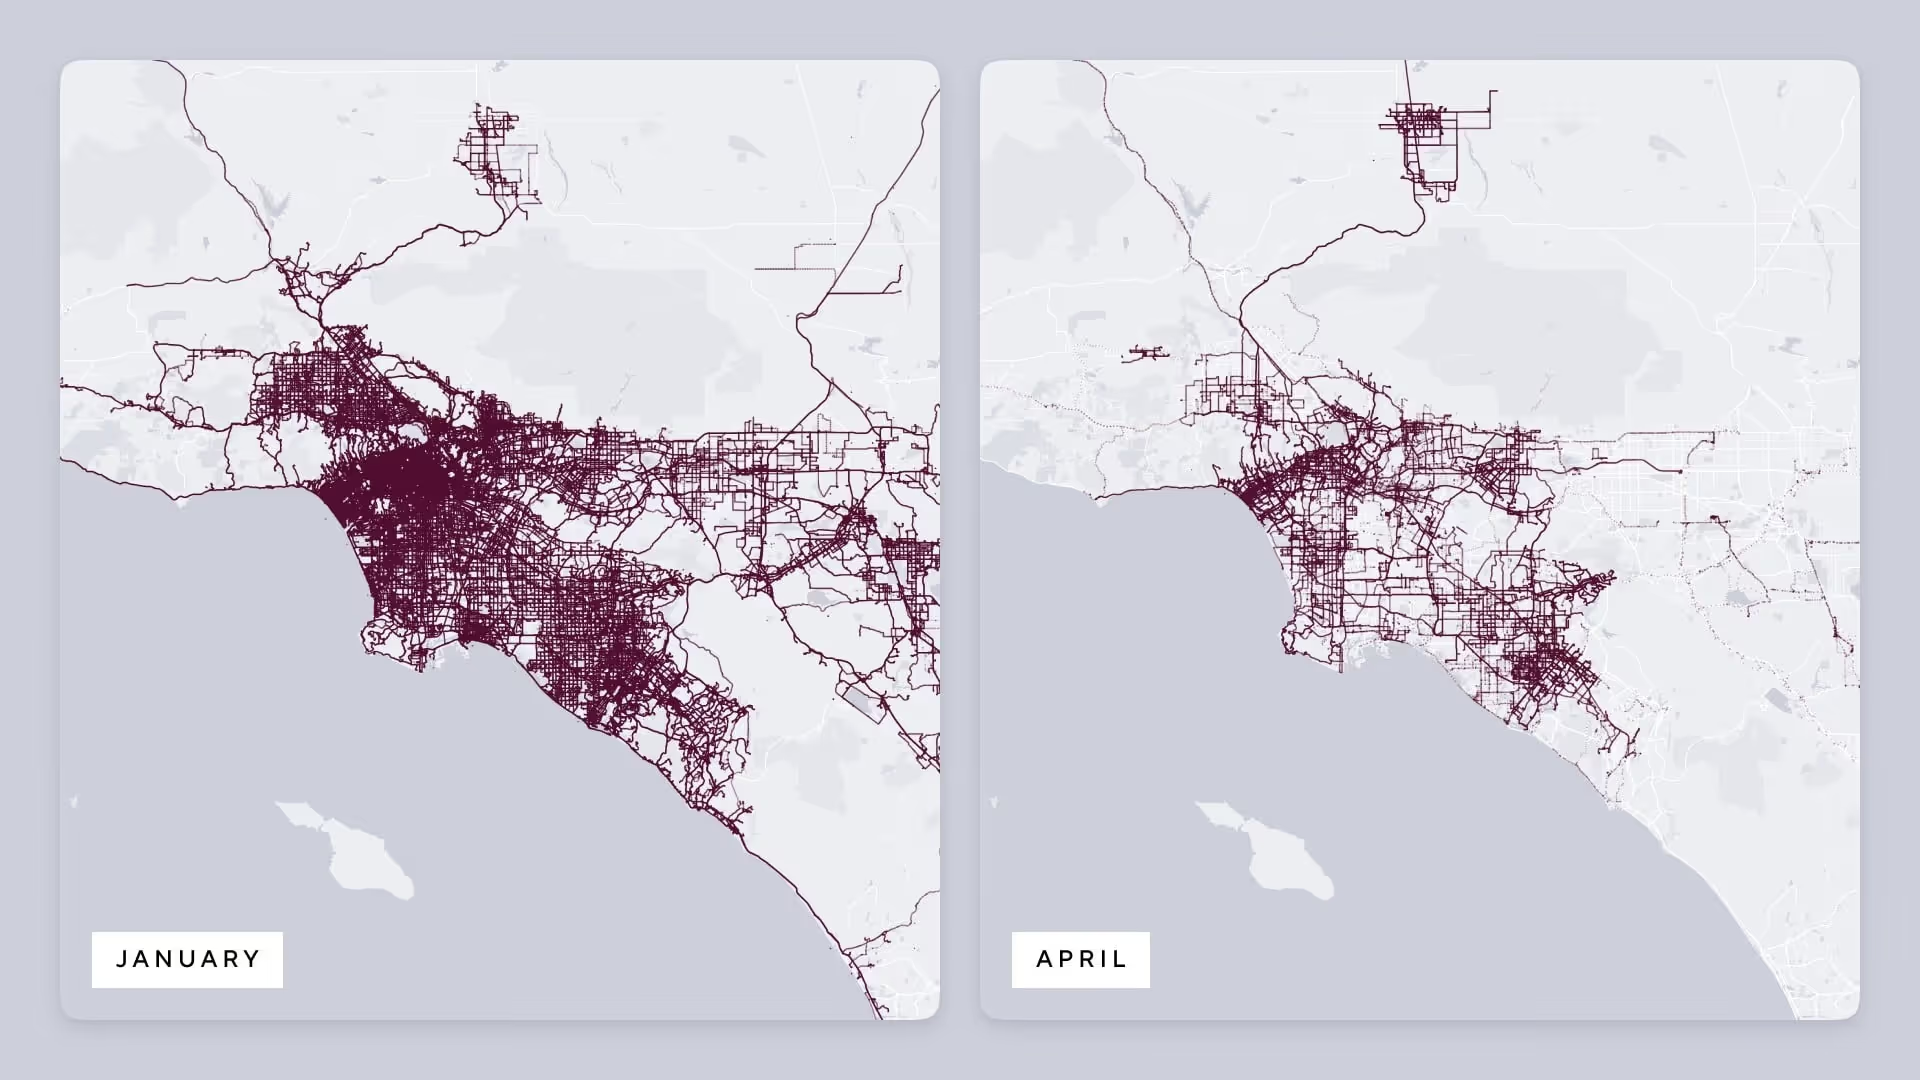
As the coronavirus pandemic tightens its grip on cities around the world, city streets have been transformed overnight. Offices, schools, businesses, and public institutions closed their doors and households buttoned up under stay-at-home and shelter-in-place orders. Roads from NYC to Chicago have become arteries without blood, and the visualizations below make this strikingly clear.

These maps show rideshare activity in New York City and Los Angeles respectively in January and April of 2020.
In the January maps, you can see that rideshare vehicles were covering every corridor of a city as activity was still persisting with strong adoption across all services as it had in previous months.
Not shown on a map (but burned into our memories) is what happened in mid-March. U.S. cities implemented lockdowns and stay-at-home orders, which brought mobility to a near halt.
At this point in time, ride-hail trip volume had plummeted up to 70% in major cities — while at the same time delivery has started to explode in volume, with select services seeing an uptick of 87% in daily revenue.
The persistent activity has resulted from ride-hail vehicles moving essential workers, as well as deliveries.
Significant decrease in ride-hail driver earnings
From the first national broadcast about the rapid spread of COVID-19, companies and workers throughout the United States started feeling the disastrous effects of the crisis, and it’s been especially tough on ride-hail drivers.
The graph below shows the volatility of median hourly wages for U.S. ride-hail drivers.
We can see that national driver earnings reached a high of $19.36 per hour on February 24, 2020 before decreasing by more than 35% to an abysmally low $12.35 per hour in mid-March.

The decline in driver earnings isn’t surprising. As demand decreases, driver earnings will inevitably decrease along with it.
So why, then, are we seeing earnings increase? Because the supply of drivers has decreased as well.
We at Gridwise wanted to know more about the supply side of the rideshare industry, so we conducted a study that included more than 2,000 of our drivers. We found that 46% of drivers stopped driving for rideshare services completely because they felt it was unsafe to keep driving with a deadly virus on the loose. When asked separately if they started driving for a delivery service, 49% said they were driving for services like DoorDash, Postmates, or Instacart.
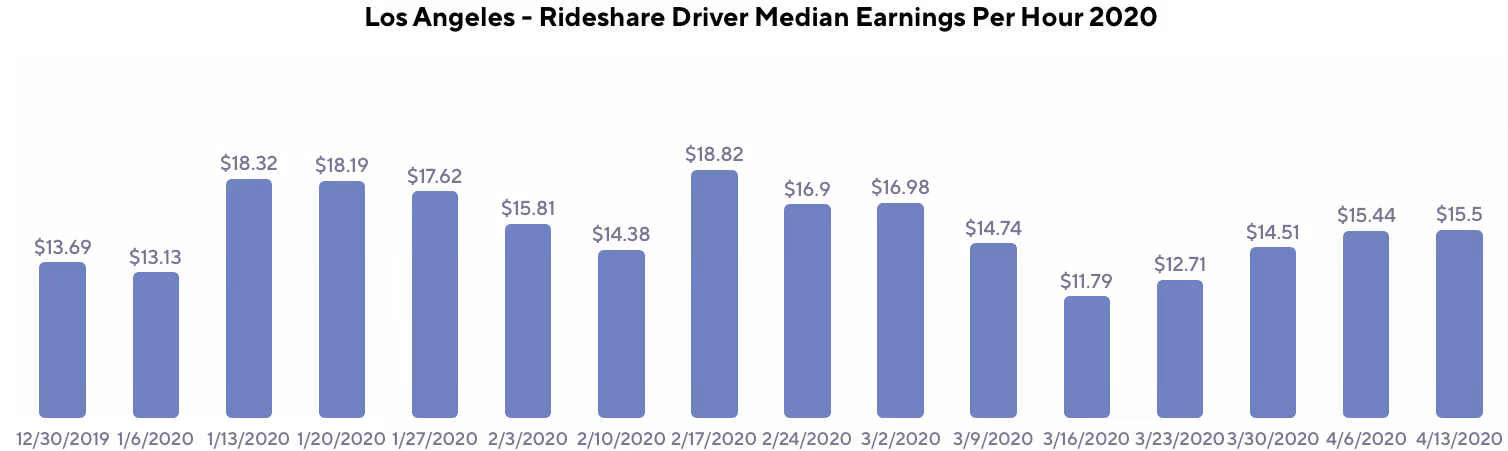
Los Angeles is a great example of a city whose hourly earnings initially declined and then rebounded weeks after a lockdown went into effect. You can see this on the graph below. Take a look at how earnings plummeted from March 9 to March 16, and dropped even further on March 23. Then by the next week, earnings had jumped from a low of $11.79 back to $15.50.
Why? Because these earnings graphs only include the hourly earnings of drivers still on the road. Not those who have chosen not to drive.
What will happen when stay-at-home orders end?
First, let’s talk about what won’t happen. As soon as these orders are lifted, we’ll all breathe a sigh of relief — but the reality is, ride-hailing demand won’t immediately go back to pre-COVID-19 levels.
At Gridwise we conducted another study (we do that a lot). This time we surveyed 800 consumers because we wanted to better understand consumer perspectives on mobility in 2020. Our study revealed that riders plan to take an average of 25% fewer rides to work using ride-hailing services, and about 17% fewer rides with ride-hailing services for recreational purposes.
This actually makes perfect sense. Even as stay-at-home orders are lifted, most people will still be extra cautious when venturing outside.
Our study confirmed that too. Nearly half of the respondents told us that as long as COVID-19 is still a threat in 2020, they plan to go out 75% less often than they normally would, and more than one-third plan to reduce going out by anywhere from 25% to 50%.
Also not surprising is what people say about using public transportation — which in many ways will be hit even harder than ride-hail. We found that riders plan to use public transportation 23% less often to get to work and 31% less often for recreational purposes than they did before COVID-19.
Based on these insights, we expect to see frequent public transit users flock more toward ride-hailing services for their primary mode of transportation in an effort to steer clear of crowded areas.
So how can TNCs not only survive, but thrive?
By embracing delivery, of course. You already see this happening across the ride-hailing industry.
Lyft, for instance, previously had no delivery business, and in April 2020 launched a service aimed to deliver meals and groceries to essential workers.
Uber has not only doubled down on an Uber Eats business that was already larger than Grubhub, but they have also expanded their offerings. Uber now offers Uber Direct, which expands its services to include grocery and retail delivery services, and Uber Connect, which is a peer-to-peer delivery service.
You even have Alto, a Dallas-based ride-hailing service that has completely pivoted to the delivery market.
While these changes may feel abrupt, the data show that focusing on delivery is the right thing to do not only in the short term, but the medium term as well.
Our consumer sentiment analysis also shows that since the COVID-19 crisis hit, food delivery consumers have been ordering out about 16% more often than they did before the crisis. They also told us they expect to continue ordering out at about that same rate throughout 2020 as stay-at-home orders subside, but COVID-19 remains a persistent, everyday issue.
Even more interesting is the fact that customers are ordering groceries a whopping 62% more than they previously did. This will probably drop slightly after stay-at-home orders are lifted. But there will still be a huge increase in grocery deliveries compared to pre-COVID times as consumers say they will still order delivery 55% more often than they did before.
So which TNCs will win?
Using proprietary data, we have concluded that companies well equipped to focus on food, grocery, and retail product delivery are well-positioned for growth through 2020 and beyond. Uber is well-positioned in the food delivery space to continue to grow while competing with food delivery companies such as Postmates, DoorDash, Grubhub, and others.
Although late to the game, services like Lyft and Alto have started delivery segments of their business as they realize that operating a delivery segment is key for today’s survival and future growth.
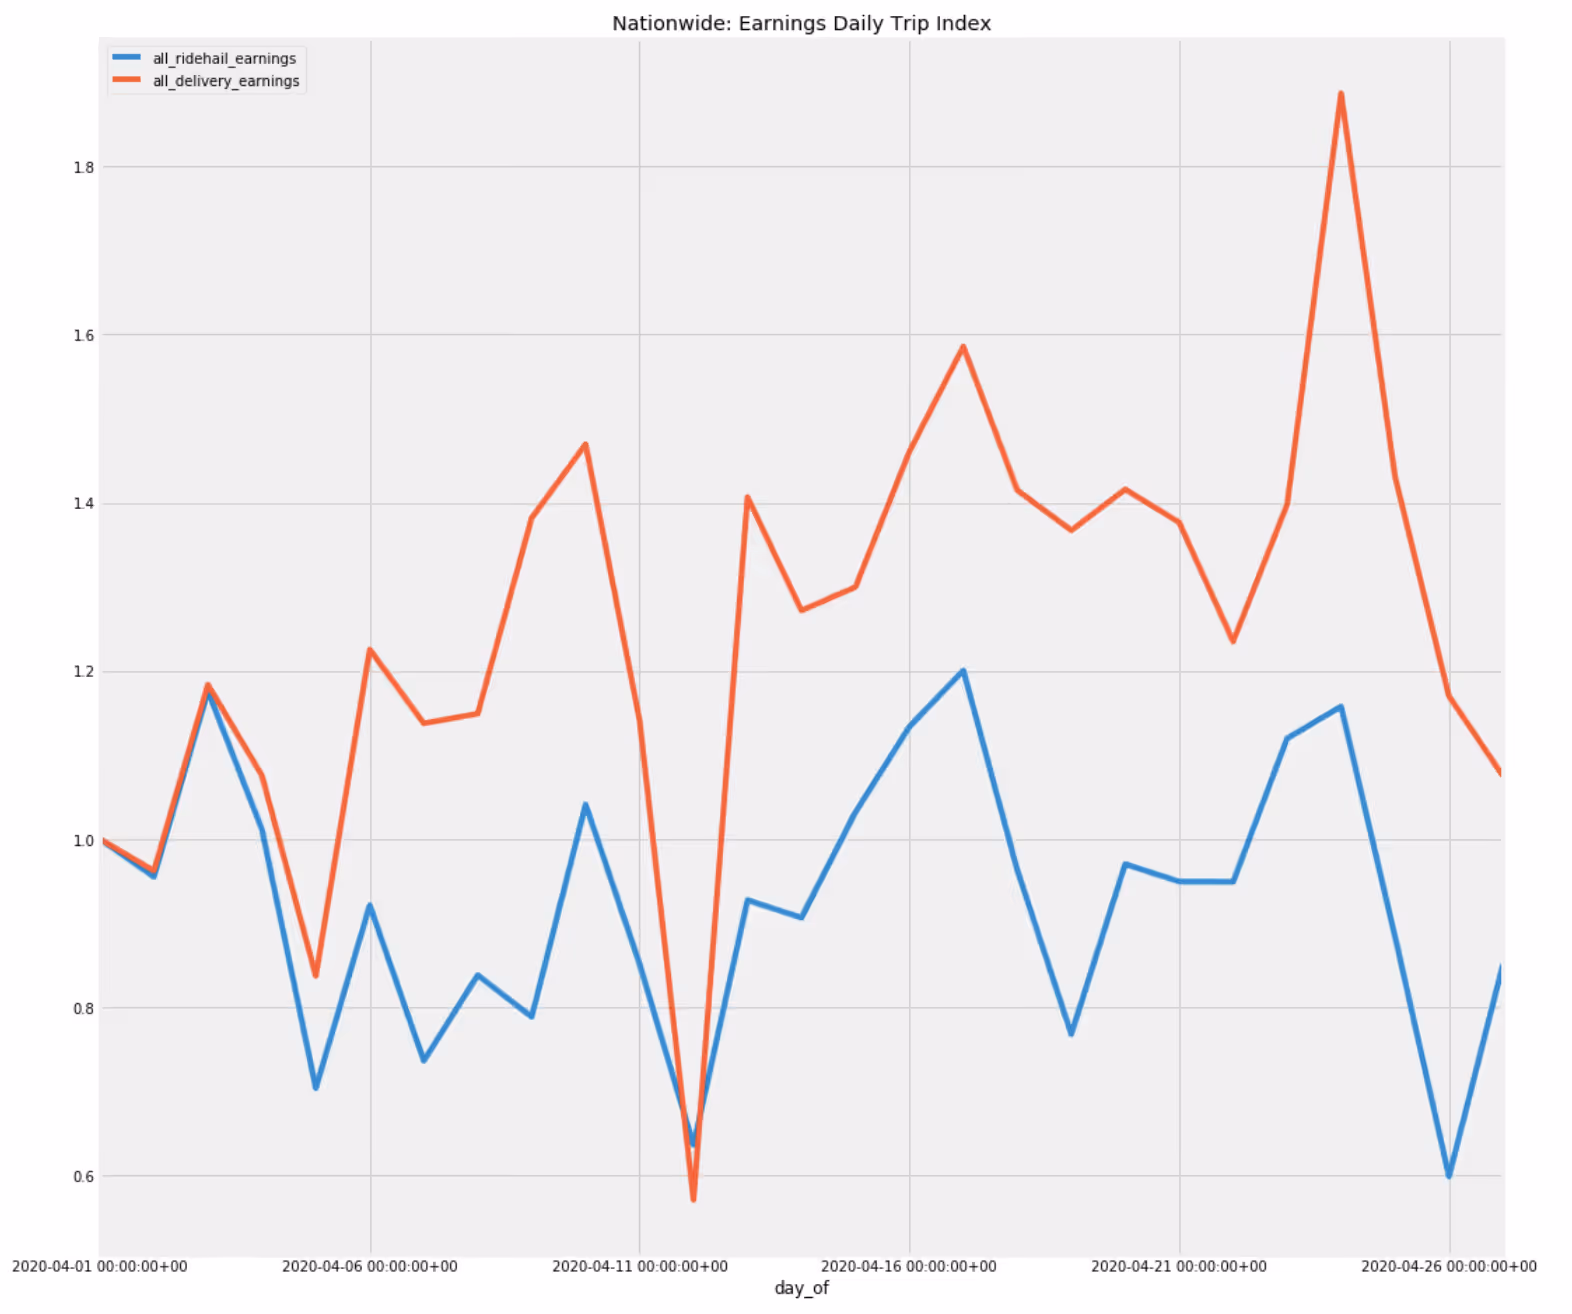
Drivers who focus on delivery will also benefit throughout 2020. The graph below shows that while ride-hail drivers have unfortunately been making less through April 2020, delivery drivers are earning more each week.
But is the ride-hailing industry in trouble?
Reports of the death of the ride-hailing industry have been greatly exaggerated.
Despite COVID-19, the ride-hailing industry does appear to be well-primed for medium- and long-term success.
Uber and Lyft have around $13 billion in cash on hand and the ability to raise more funds if needed, which gives both companies plenty of runway to weather the COVID-19 storm.
But even more importantly, ride-hailing is well-positioned against public transportation when it comes to winning back recreational travelers within urban environments.
Our consumer analysis study also found that while consumers plan to use ride-hail services 17% less for recreational purposes throughout 2020 when compared to a pre-COVID-19 world, consumers also say they will use public transportation 31% less.
These data confirm the obvious: that consumers will shy away from public transportation and move toward ride-hail services when they do go out.
And you can expect ride-hail companies to lean into this by building their images around being the sanitized travel option for consumers.
Uber and Lyft also have room to decrease prices, as they have been slowly but surely increasing their prices since the beginning of 2019 as competition decreased. Unfortunately, drivers on the supply side may see their rates cut so these companies can remain profitable. But with TNCs and delivery companies receiving record numbers of driver applications, this may prove to be a non-issue.
So in the short-term, the major ride-hailing companies will certainly take a hit to their revenue — but with a $13 billion war chest between them, don’t expect them to go away anytime soon. In the short-term, they’ll focus on delivery, while picking up riders that would have otherwise taken public transportation throughout the rest of 2020. This will prime them for a strong 2021.
Share article:
Related posts

Rideshare Insurance: What Every Driver Needs to Know
Disclaimer: Gridwise is not a licensed insurance agency or broker. The information in this article is for educational purposes only and should not be considered insurance advice. Insurance coverage, requirements, and costs vary by state, insurer, and individual circumstances. Always consult with a licensed insurance professional before making coverage decisions.
You're parked in a shopping center lot with your rideshare app on, waiting for a ping. A distracted driver runs a stop sign and clips your rear bumper. The damage is $3,800. You call your personal insurer: claim denied, commercial use exclusion. You call Uber or Lyft: their coverage during this waiting phase handles the other driver's liability, but nothing for your car. You pay the $3,800 out of pocket.
That gap is real, and it catches thousands of drivers every year. Your personal auto policy is built for non-commercial life. Rideshare platforms provide strong coverage once a trip is in progress, but the window between logging in and accepting a ride sits largely in no-man's land. The good news: closing that gap typically costs $15 to $30 a month and takes a single call to your insurer.
This post breaks down exactly how rideshare insurance works period by period, which type of policy fits your situation, what additional steps protect you beyond the basics, and what to do if you ever get into an accident while the app is on.
In this post:
- The three coverage periods and what each one means for your protection
- Why Period 1 is the most expensive gap for rideshare drivers
- The three types of policies and which one you actually need
- What a rideshare endorsement costs and why the math favors getting one
- Five practices that protect you beyond just getting endorsed
- What to do immediately after an accident while the app is on
The video above walks through the full coverage framework rideshare drivers face, from the three-period structure to the three types of policies available. The breakdown below adds the cost math, additional best practices the video does not cover, and a step-by-step guide for what to do after an accident.
The Three Coverage Periods Determine Who Pays After an Accident
Rideshare companies divide your time behind the wheel into distinct states, each with its own coverage rules. Understanding them is the foundation for everything else.
Period 0 is when the app is completely off. You are driving your personal vehicle for personal reasons, and only your personal auto insurance applies. Straightforward.
Period 1 begins the moment you log into the app and make yourself available, before you have accepted any request. This is where most coverage problems happen. Your personal insurer typically excludes claims arising from commercial or rideshare use. Platforms provide contingent liability coverage during Period 1 (generally $50,000 per person, $100,000 per accident, $25,000 for property damage), but they do not cover damage to your own vehicle.
Periods 2 and 3 cover the window from accepting a ride through dropping off the passenger. Coverage improves significantly here. Both Uber and Lyft provide up to $1,000,000 in third-party liability during these phases, plus contingent collision and comprehensive coverage for your vehicle up to actual cash value. That contingent coverage only applies if you already carry collision and comprehensive on your personal policy, and the deductible is typically $2,500 before the platform's physical damage coverage activates.
Knowing which period you were in at the time of an incident determines which coverage applies, what deductible you owe, and which insurer handles the claim.
Period 1 Is the Coverage Gap That Costs Drivers the Most
Period 1 is sometimes called the "danger zone," and the financial exposure behind that label is concrete. You are logged into the platform, legally operating as a for-hire driver, so your personal insurer considers you engaged in commercial activity. At the same time, the platform's strongest coverage has not activated because no ride is in progress.
The result: if your car is damaged during Period 1, the platform's contingent coverage does not apply to your vehicle. Your personal insurer denies the claim. A $4,000 repair bill becomes entirely your problem.
This is not a rare edge case. Period 1 covers a lot of real driving time: repositioning to a high-demand area, sitting in an airport lot, idling near a venue waiting for post-event demand. All of it happens in Period 1, and none of it has physical damage coverage from the platform.
Three Types of Insurance, and One That Fits Most Drivers
Most rideshare drivers interact with three categories of insurance. Choosing the right one depends on how and how much you drive.
A personal auto policy is designed for non-commercial use. It is what most drivers start with, and on its own it is generally not sufficient for rideshare work. The commercial use exclusion built into most personal policies means your insurer can deny claims that occur while the rideshare app is active.
A rideshare endorsement is an add-on to your existing personal policy. It informs your insurer of your rideshare activity and extends your personal coverage into all active periods, including Period 1. This closes the gap that exists when the app is on but no trip is in progress. Most major insurers offer endorsements: State Farm, Allstate, GEICO, Progressive, Farmers, USAA, and Liberty Mutual, among others. Not every insurer offers them in every state, so your first step is confirming availability with your current carrier.
A commercial policy is built for full-time business use: fleets, dedicated livery services, or Uber Black and Uber SUV drivers who are required to carry commercial insurance in most markets. Commercial policies typically run $200 to $400 per month, substantially higher than an endorsement, and designed for a different level of business exposure.
For the majority of rideshare drivers doing part-time or full-time UberX, Lyft, UberXL, or delivery work, a rideshare endorsement is the right fit. It covers the Period 1 gap at a fraction of the cost of a commercial policy. If rideshare driving is your primary income and your vehicle is essentially a dedicated business asset, a commercial policy is worth evaluating with a licensed professional.
A Rideshare Endorsement Costs Less Than One Bad Accident
A rideshare endorsement typically adds $15 to $30 per month to your existing personal auto premium. Some carriers price the add-on as low as $5 to $10 per month depending on your location, driving history, and vehicle.
The comparison that matters: one uninsured accident during Period 1 can easily cost $5,000 to $15,000 or more in out-of-pocket repairs, liability exposure, or both. Twelve months of endorsement coverage at $20 per month is $240 a year. That $240 is the cost of protection against a financial hit that could erase weeks of driving income in a single incident.
Treat the endorsement as a cost of doing business, in the same category as fuel and maintenance. Drivers who track their real profit per mile using Gridwise can log insurance as a business expense alongside mileage and fuel costs, which gives a complete picture of what each hour of driving actually nets after all expenses.
If your current insurer does not offer a rideshare endorsement, that is a straightforward reason to get quotes from insurers that do. The endorsement market is competitive.
Five Practices That Protect You Beyond the Endorsement
Getting endorsed closes the biggest gap, but it is not the only thing worth doing.
Disclose your rideshare activity upfront. Some drivers avoid mentioning rideshare work to their insurer hoping to keep premiums down. If your insurer discovers undisclosed commercial use after an accident, they can deny the claim and cancel your policy at the same time. Disclosing upfront and getting the appropriate endorsement eliminates that exposure entirely.
Know your deductibles before you need them. Uber and Lyft's contingent physical damage coverage during Periods 2 and 3 carries a $2,500 deductible. If total damage is under that threshold, the platform's collision coverage effectively does not help you. Many personal policies carry deductibles of $500 to $1,000, which may be significantly lower depending on your coverage. Knowing in advance which policy takes the lead, and what you will owe, prevents surprises in the middle of an already stressful situation.
Mount a dash cam. A dash cam provides objective footage of what happened and in what sequence. In a dispute where fault is contested, clear video is often the difference between a denied claim and a resolved one. This applies equally to your personal insurer and the platform's insurance team. Front and rear coverage is worth the modest additional cost.
Check your state's specific rules. Rideshare insurance regulations vary meaningfully by state. California's TNC legislation affects how Period 1 coverage works in ways that differ from other states. New York City TLC drivers face commercial insurance requirements that a standard endorsement does not satisfy. Florida's no-fault structure adds complexity to how PIP coverage interacts with rideshare claims. If you drive in a state with a distinct regulatory environment, confirming that your coverage meets local requirements with a licensed professional in your state is not optional.
Build your accident documentation routine before you need it. The steps that protect you are not complicated, but they are much easier to execute if you have thought through them in advance: move to safety, call 911 if anyone is injured, photograph all vehicles and damage from multiple angles, get the other driver's insurance information and license plate, collect witness contacts, and report the incident through the app and to your personal insurer. Doing this quickly and thoroughly makes the claims process significantly smoother.
What to Do After an Accident While the App Is On
If you are in an accident while logged into a rideshare app, the first hour matters.
Get everyone to safety first. If there are injuries, call 911 before anything else. Check on your passenger if you had one, and on other parties involved.
Document everything on scene while you still can: photos of all vehicles, damage from multiple angles, the other driver's license and insurance card, road conditions, and any relevant signage. Get names and phone numbers from any witnesses. Do this before vehicles are moved, if the scene is safe enough to allow it.
Report the accident through the rideshare app as soon as possible. Both Uber and Lyft have in-app reporting that creates a timestamped record. Also report to your personal insurer, even if you expect the platform's coverage to handle it: failing to notify your personal carrier can create complications with your policy down the line.
Determine which period you were in. Pull up your trip history to confirm your exact status at the time. Period 1 means your rideshare endorsement handles your vehicle damage, assuming you have one. Periods 2 or 3 mean the platform's insurance takes the primary role, subject to the $2,500 deductible.
If the claim becomes complicated, a licensed insurance professional or attorney familiar with vehicle claims can represent your interests through the process. For any significant incident, that option is worth knowing about.
Know Your Coverage Before the Moment You Need It
The drivers who get through accidents without a financial crisis are almost always the ones who sorted their coverage before anything happened. The Period 1 gap exists on every platform in every state. A rideshare endorsement is the fix, and at $15 to $30 a month it is one of the lower-cost decisions in your driving business.
Driving for a rideshare platform without informing your insurer is a gamble that can produce a denied claim and a canceled policy at the same time. Getting endorsed means you have done both things at once: disclosed your activity and closed the gap.
Insurance rules, rates, and endorsement availability vary by state and by carrier. Call your current insurer, confirm they offer a rideshare endorsement, verify it covers all the platforms you drive for, and ask what your deductible will be under each relevant scenario. If they do not offer an endorsement, take that as a prompt to find one that does.
For the complete breakdown of Uber-specific coverage details and a phase-by-phase look at what Uber provides, see the Uber Driver Insurance Guide.
Keep Reading
- UberX vs Uber Comfort vs Uber Black: Which Pays More?
- Uber Driver Car Rental: What You Need to Know
- How Much Do Uber Black Drivers Make?
Want to see your actual insurance cost as a share of your profit per mile? Download Gridwise free and track your earnings, fuel costs, and expenses across all your platforms in one place, so you know exactly what each hour of driving is worth.

Protect Your Uber Driver Earnings When Gas Prices Rise
It's Tuesday at 2pm in Jacksonville. Gas is $3.89. You're sitting in your car, app closed, trying to decide whether it's even worth going online. You just filled up for $68, and the math doesn't feel like it's working in your favor.
Here's what most drivers do next: they obsess over the pump price. They check GasBuddy. They drive an extra four miles to save seven cents per gallon. They post in driver forums asking if anyone else is getting killed out there.
None of that moves your uber driver earnings in a meaningful direction.
What actually moves the number is something different: not the price of gas, but the percentage of your hourly earnings that gas is consuming. Drivers who understand that distinction don't stop driving when prices spike. They adjust how they drive. There's a specific metric for this, and once you start tracking it, your whole relationship with the pump changes.
This post breaks down the Jacksonville approach: a practical playbook built around gas drag, smarter scheduling, and a few specific moves that lower your cost-per-mile without requiring you to find cheaper gas.
In this post:
- What gas drag is and how to calculate it for your own driving
- Why your working hours matter more than the price on the sign
- How to eliminate dead miles before they kill your margins
- The right way to evaluate long trips and avoid dead zones
- How to stack fuel programs without much effort
A Jacksonville-based driver breaks down the gas drag concept and how shifting your schedule — not hunting for cheaper gas — is what actually protects your take-home. The written breakdown below goes deeper on the math and the Jacksonville-specific strategy.
Gas Drag Is the Metric That Actually Measures Fuel's Impact on Your Earnings
Gas drag is the percentage of your hourly earnings consumed by fuel costs. That's the whole definition, and it changes everything about how you think about a $3.89 fill-up.
Here's a simple version of the math. Say gas costs you $12 per hour of driving. That's a rough estimate based on fuel consumption at typical rideshare speeds. If your uber driver earnings that hour come out to $18, your gas drag is around 67%. Most of that hour went to the gas station.
Now take the same $12 fuel cost in an hour where you earned $32 because you were working a Friday evening surge near the stadium. Gas drag drops to 37%. Same gas price. Same car. Completely different outcome.
That's why watching the pump price alone misses the point. A day with $4.20 gas but high demand and tight positioning can have lower gas drag than a day with $3.50 gas spent circling dead zones waiting for requests that never come. The fuel cost didn't change. Your earnings changed, and that's what you can actually control.
To calculate your own gas drag: take your average fuel spend per driving hour and divide it by your average earnings per hour. If you don't have those numbers handy, tracking your drives in the Gridwise app gives you a real earnings-per-hour figure across your platforms, which makes this calculation something you can actually run instead of estimate.
Your Uber Driver Earnings Per Hour Depend More on When You Drive Than How Much You Drive
Long hours at low-demand times produce a double loss: lower earnings per hour and the same (or higher) fuel cost per hour because stop-and-go traffic burns more gas than steady driving. The result is maximum gas drag.
The Jacksonville market has predictable high-demand windows: weekday mornings around the airport, evening surges Thursday through Saturday, and Sunday afternoon ride volume tied to flight schedules and events. Drivers who time their availability to those windows consistently earn more per hour than drivers who grind full days hoping volume shows up.
This is not about driving fewer hours for the sake of it. It's about being intentional with the hours you work. A four-hour block during an active evening surge produces better uber driver earnings per hour than eight hours that include a dead Tuesday afternoon. And when your earnings-per-hour goes up, your gas drag percentage goes down, even if the price at the pump stays exactly where it is.
Reviewing your earnings data week over week makes this more concrete. Look at which day-of-week and time-of-day windows consistently produce your highest earnings per hour. Drive those windows. Treat the slow windows as time you get back.
Dead Miles Are a Hidden Tax on Every Trip You Take
A dead mile is any mile you drive without a passenger or an active delivery. It costs fuel. It adds wear. It produces zero income. And it compounds: one 8-mile repositioning trip to a bad pickup area can require three or four decent rides just to break even on the fuel and time you spent getting there.
The Jacksonville geography makes this especially relevant. The airport queue generates solid fares, but the return trip from some destinations on the south side can leave you 12 miles from the next meaningful request. If your next ride doesn't generate enough to offset that positioning cost, the trip was profitable on paper and unprofitable in practice.
Before you accept a repositioning move, ask one question: is there a reason to believe the next request will come from where I'm going? If the answer is based on a hunch rather than what you know about demand patterns in that area, the dead miles probably aren't worth it. Staying near areas with consistent pickup volume, and not chasing isolated requests that pull you away from them, is one of the lowest-effort ways to lower your cost-per-mile without changing anything about how you drive.
Trips That End in Dead Zones Cost You Twice
A long trip looks attractive in the moment. The fare is high, the surge bonus pops, and the estimated earnings show up in the notification before you've decided to accept. What doesn't show up is where the trip ends and what that means for your next 20 minutes.
If a trip terminates in an area with low request density, you absorb the fuel cost of getting back to productive territory before you earn another dollar. That return cost doesn't appear anywhere in the ride's summary. It gets counted against whatever comes next, or gets lost entirely if you go offline and head home.
The way to evaluate a long trip is not just the fare. It's the fare minus the repositioning cost you'll likely pay after. A $28 trip that drops you 14 miles from anywhere useful may net out to less than a $19 trip that keeps you in a busy corridor.
This calculus shifts when a surge bonus is involved, or when you know from experience that the destination area generates its own requests at that time of day. A drop-off at the Jacksonville airport almost always produces a return trip or a short queue wait. A drop-off at a residential area 12 miles south of downtown almost never does. Knowing the difference before you accept is what separates drivers who manage gas drag from drivers who are managed by it.
Stack Fuel Programs to Lower Your Cost Per Mile Without Chasing Deals
Gas will never be free, but your effective cost per gallon can be meaningfully lower than the sticker price if you're using the programs available to you. The key word is "stack": using one program is fine, but using two or three together on the same fill-up is where the savings become significant.
The basic combination most Jacksonville drivers can access: a fuel rewards card tied to a grocery loyalty program (Publix BonusCash pairs with Shell, for example), a cash-back credit card with a fuel category bonus, and whatever current platform promotion is live. Uber Pro and Lyft Rewards both offer periodic fuel discounts or cash-back bonuses for drivers who hit activity thresholds. These programs run independently and can be combined with retail fuel rewards.
The practical ceiling for most drivers stacking two or three programs is somewhere in the range of 25 to 40 cents off per gallon. On a 12-gallon fill-up, that's $3 to $5 per tank. That's not transformational on a single fill, but across 52 weeks it's a meaningful reduction in your annual fuel spend, without requiring you to do anything differently except use the programs you've already qualified for.
One thing worth watching: some platform fuel programs include conditions that make them worth less than they appear at signup. Read what the per-gallon discount actually requires before building it into your projections.
Gas Prices Don't Beat Drivers Who Plan Their Week
The drivers who get hurt most when gas prices spike are the ones treating rideshare like a vending machine: insert hours, receive money. When fuel costs rise, that model breaks down fast because there's no feedback loop telling you which hours are actually productive.
The drivers who absorb fuel cost increases without much drama tend to be the ones who already know their numbers. They know their average earnings per hour on a Thursday night versus a Tuesday afternoon. They know which areas consistently produce back-to-back requests. They know which long trips are worth taking and which ones leave them stranded. That knowledge doesn't cost anything to develop. It just requires tracking what you actually earn, not what the completed trip summary says.
Gas drag is a useful concept because it turns a passive complaint ("gas is so expensive") into an active variable ("my gas drag is 42% and I want it under 30%"). Once you're thinking in those terms, the pump price becomes one input among several, not the headline number that makes or breaks your week.
Track your hours, know your windows, cut the dead miles, and evaluate long trips honestly. Gas prices will keep moving. Your earnings don't have to move with them.
Keep Reading
- How to Make $1,000 a Week With Uber
- UberX vs Uber Comfort vs Uber Black: Which Service Tier Pays More?
- Uber Driver Car Rental: What You Need to Know
Want to see your actual earnings per hour across platforms in one place? Download Gridwise free and track your real take-home, fuel spend, and mileage all in one dashboard, so you always know your gas drag before you go online.
Driver Pay in 2026: How to Benchmark Your Earnings and Drive Smarter
Rider prices per trip are up 9.6% this year. Driver pay per trip is up 3.6%. Those numbers come from the Gridwise Annual Gig Mobility Report -- and they're worth knowing, but not because of what they say about the industry. They're worth knowing because they give you a benchmark. If your per-trip earnings are up more than 3.6% in your market, you're outperforming the national average. If they're flat, you're falling behind it. That's the question worth asking.
Uber and Lyft give drivers consistent demand, built-in payment infrastructure, and a steady flow of riders without you having to find them yourself. Working those platforms well means knowing where your numbers stand and making deliberate decisions about when and where you drive.
Your trip receipts give you one side of that picture. The data you build over time gives you the other. Here's how to read both.
In this post:
- What your receipts show you and how to use them
- How to benchmark your numbers against the national average
- The three levers that actually move your earnings
- How Gridwise shows you where to focus your hours
A Gridwise driver walks through actual airport trip receipts -- a black ride and two XL runs -- and uses the numbers to think through what each trip was actually worth. The breakdown below adds the framework for how to apply that same thinking to your own data.
What Your Trip Receipts Actually Tell You
When you get paid on a trip, you see the upfront fare, any promotions applied to your side, and whatever the rider tipped. That's your side of the transaction -- and for benchmarking purposes, it's what matters, because your take-home is what determines whether a trip was worth your time.
The tip is your clearest signal for how the rider experienced the trip. Most riders tip 10 to 20% of their total. A $15 tip on an airport black ride tells you the passenger spent real money and valued the service. A $12 tip on an XL run tells you the same. That matters when you're deciding which trip types to prioritize.
Promotions on the driver side are part of your actual payout too. An $11.27 promo on a $42.67 XL fare brings your total for that trip to $53.94. Track the full number -- upfront fare plus promotions plus tip -- as your per-trip income. That's what goes into your hourly calculation, and per hour is the number worth watching.
The Benchmark That Actually Matters
The Gridwise Annual Gig Mobility Report puts national driver pay growth at 3.6% year-over-year. Your own number is what tells you whether your market and your driving pattern are performing above or below that.
If you drove similar hours this year as last and your per-trip average is flat, you're running below the national trend. If it's up 5 or 6%, you're ahead of it. Neither outcome is final -- it's information. And information is what lets you make a different decision next week than you made last week.
Rider prices in your market may be moving at a different rate than the national 9.6% average. Your city, the service tiers you focus on, and the hours you drive all shape what those numbers actually look like for you. National data gives you context. Your own trip history gives you the answer.
The Three Levers That Move Your Earnings
You can't set your own rates, but you're not without options. The variables that actually move your earnings are when you drive, where you drive, and which service tier you focus on.
When you drive determines what demand looks like. Morning airport runs in a business-travel market behave differently than weekend evening rides in a nightlife area. The earnings profile of each pattern varies by city and by season. National averages tell you the trend -- your own trip history tells you which pattern is working in your specific market right now.
Where you drive shapes the trip types that come to you. Positioning near an airport, a stadium, or a high-density neighborhood changes the mix of trips you see. Different zones carry different per-trip averages, and those averages shift based on time of day. Drivers who earn above the national average are usually the ones who have figured out which zone-and-time combinations consistently work in their area.
Which service tier you focus on changes the math on every single trip. Black and XL typically pay more per trip but require more vehicle investment. Standard is higher volume with smaller per-trip numbers. The right answer depends on your costs, your vehicle, and what demand looks like in your area at the times you drive.
How Gridwise Shows You Where to Focus
Gridwise tracks your real take-home per trip and per hour across all the platforms you drive for. That's the baseline -- you can see whether your numbers are trending up, flat, or down week over week without doing the math yourself.
The when-and-where data is where it gets more useful. Gridwise shows you which hours and zones are performing best in your market, so instead of guessing whether a Wednesday morning airport run beats a Friday night downtown loop, you can see it directly in your own trip history. Over time that pattern becomes a scheduling tool -- you put your hours where the math has consistently worked, and you stop guessing.
The national benchmarks from the Gridwise Annual Gig Mobility Report give you something to orient against. Your own Gridwise data shows you how your market compares. If your numbers are running flat while rider prices in your area are climbing, that's worth responding to -- a shift in hours, a different zone, a change in your service mix. The data gives you the information. What you do with it is yours to decide.
Your Numbers Are the Tool
The 3.6% national driver pay growth figure is useful context. But the number that determines how this year goes for you isn't the national average -- it's your per-trip average in your market on the days and in the zones you actually work.
Drivers who consistently earn above the trend aren't doing anything secret. They know which hours work in their area, which zones produce the trip types that fit their vehicle and service level, and they check their numbers often enough to know when something has shifted. That's a discipline worth building -- and it starts with tracking the right data.
Keep Reading
- How to Make $1,000 a Week with Uber
- UberX vs Uber Comfort vs Uber Black: Which Pays More?
- How to Make $1,000 a Week with Uber Eats
Want to see how your per-trip earnings compare to the national trends? Download Gridwise free and track your real take-home per trip and per hour across every platform you drive for.
Work smarter. Earn more.
Whether you drive, deliver, or pick up shifts — Gridwise helps you track earnings, mileage, and performance so you stay in control of your work. Download the app and take charge today.
